Races in Westford, Massachusetts (MA) Detailed Stats
Ancestries, Foreign-born residents, place of birth

Recent posts about races in Westford, Massachusetts on our local forum with over 2,400,000 registered users:
 | Littleton or Westford (10 replies) |
| Chelmsford or Westford? (42 replies) |
| V.Good school district/ housing with Asian Indian community around (34 replies) |
| interested in buying a house in Groton MA (3 replies) |
| Moving Junior year teen to Westford/Acton- NEED HELP (25 replies) |
| towns that offer the most jobs per dollar of house (58 replies) |
Latest news about races in Westford, MA collected exclusively by city-data.com from local newspapers, TV, and radio stations
6.3% of Westford, MA residents are foreign-born (3.0% born in Asia, 1.7% born in Europe), which is 184.7% less than the foreign-born rate of 18.0% across the entire state of Massachusetts.
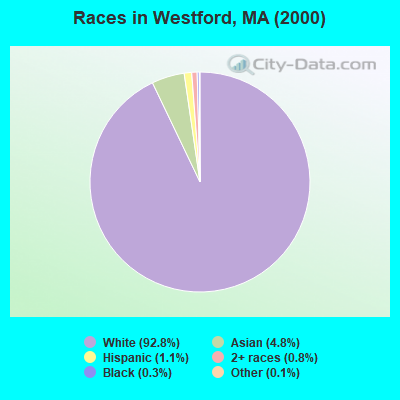
Race distribution in Westford

- 19,26792.8%White alone
- 9914.8%Asian alone
- 2291.1%Hispanic
- 1630.8%Two or more races
- 610.3%Black alone
- 290.1%Other race alone
- 110.05%American Indian alone
- 30.01%Native Hawaiian and Other
Pacific Islander alone
2000
2022
-
- 5,198,35981.9%White alone
- 428,7296.8%Hispanic
- 318,3295.0%Black alone
- 236,7863.7%Asian alone
- 110,3381.7%Two or more races
- 43,5860.7%Other race alone
- 11,2640.2%American Indian alone
- 1,7060.03%Native Hawaiian and Other
Pacific Islander alone

-
- 4,676,62767.0%White alone
- 911,03813.0%Hispanic
- 501,4637.2%Asian alone
- 459,7406.6%Black alone
- 341,8894.9%Two or more races
- 84,4031.2%Other race alone
- 5,8380.08%American Indian alone
- 9760.01%Native Hawaiian and Other
Pacific Islander alone

Income and house value in Westford
- Median household income in 2022
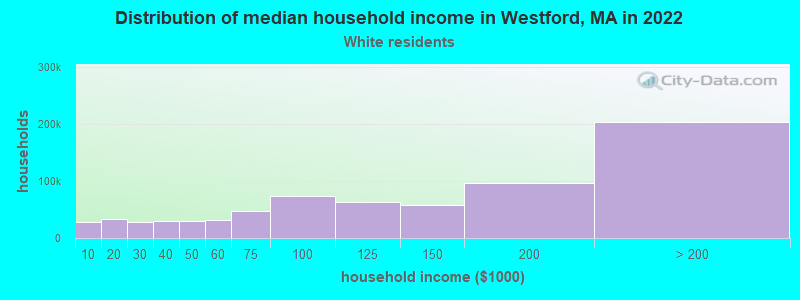
- $190,362White non-Hispanic householders
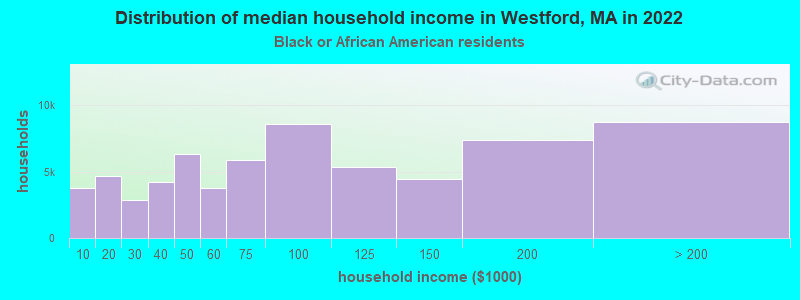
- $198,017Black householders
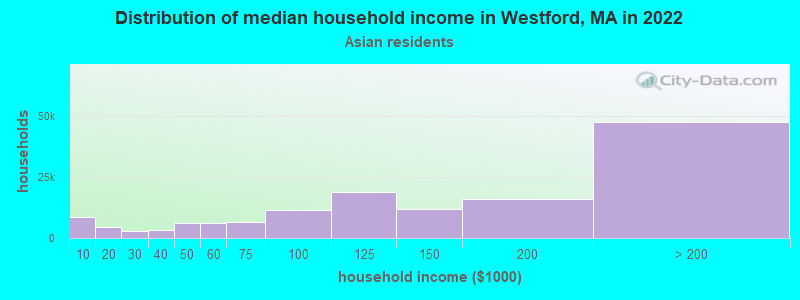
- over $200,000Asian householders
- $198,721Some other race householders
- over $200,000Two or more races householders
- $181,863Hispanic or Latino race householders
- Median 2022 house value
- $784,640White Non-Hispanic householders
- $744,786Black or African American householders
- $847,954Asian householders
- $822,798Some other race householders
- over $1,000,000Two or more races householders
- $501,706Hispanic or Latino householders
Household income for White non-Hispanic householders
Household income for Black householders
Household income for Asian householders
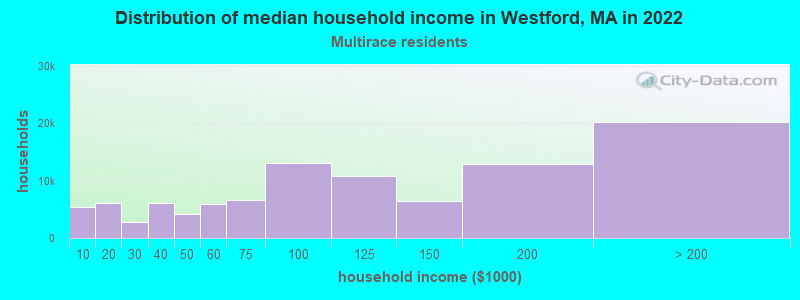
Household income for Two or more races householders
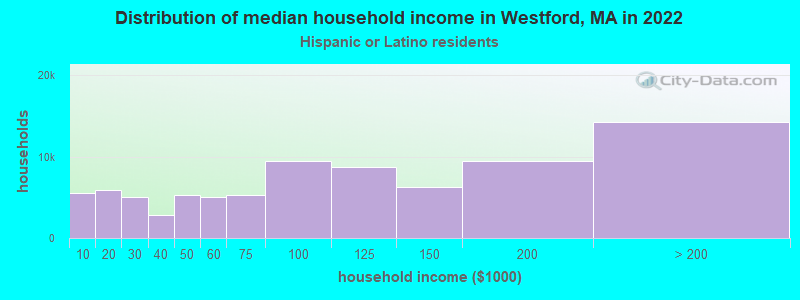
Household income for Hispanic or Latino race householders
Foreign-born residents in Westford
1,312 residents are foreign born (3.0% Asia, 1.7% Europe).
| This city: | 6.3% |
| Massachusetts: | 12.2% |
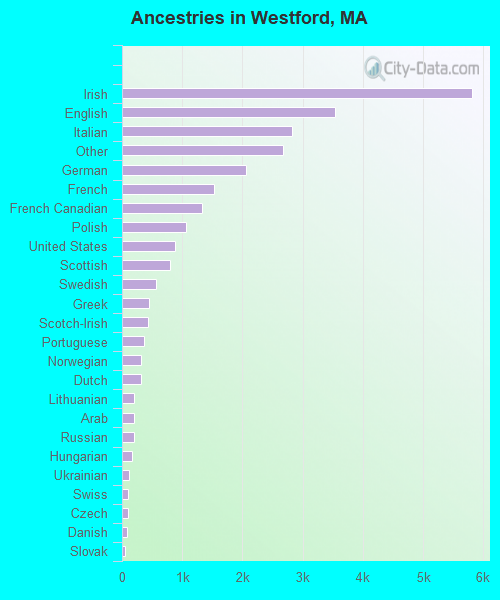
Ancestries in Westford

- 5,80422.1%Irish
- 3,54413.5%English
- 2,82910.8%Italian
- 2,68010.2%Other
- 2,0517.8%German
- 1,5285.8%French
- 1,3345.1%French Canadian
- 1,0714.1%Polish
- 8873.4%United States
- 7963.0%Scottish
- 5602.1%Swedish
- 4521.7%Greek
- 4241.6%Scotch-Irish
- 3621.4%Portuguese
- 3221.2%Norwegian
- 3191.2%Dutch
- 1950.7%Lithuanian
- 1930.7%Arab
- 1920.7%Russian
- 1690.6%Hungarian
- 1100.4%Ukrainian
- 1020.4%Swiss
- 920.4%Czech
- 830.3%Danish
- 530.2%Slovak
- 440.2%Subsaharan African
- 410.2%Welsh
- 190.07%West Indian
Zip codes: 01886.