Races in Westminster, Colorado (CO) Detailed Stats
Data:
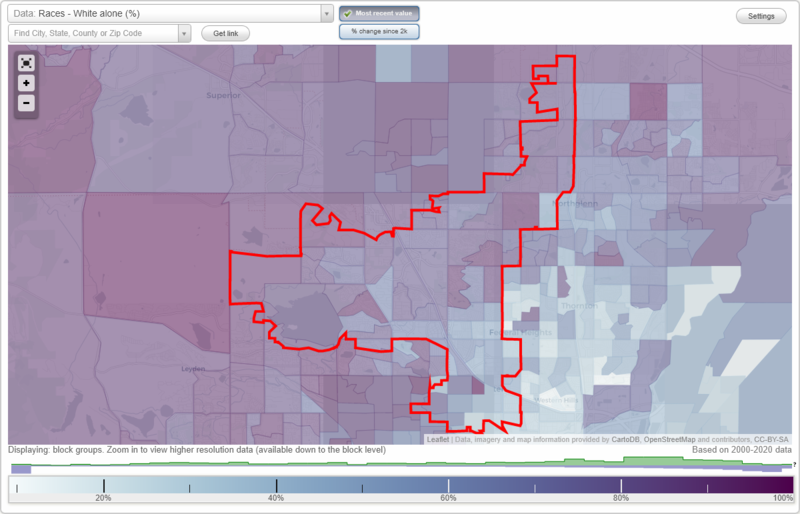
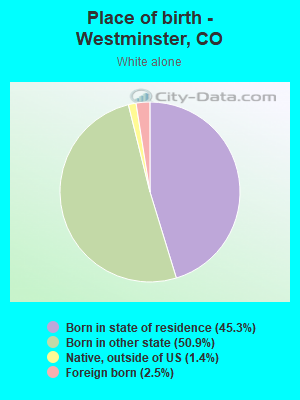
Races - White alone (%)
Races - White alone (% change since 2000)
Races - Black alone (%)
Races - Black alone (% change since 2000)
Races - American Indian alone (%)
Races - American Indian alone (% change since 2000)
Races - Asian alone (%)
Races - Asian alone (% change since 2000)
Races - Hispanic (%)
Races - Hispanic (% change since 2000)
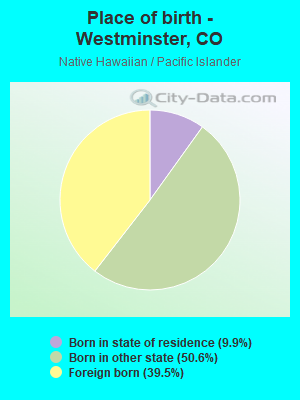
Races - Native Hawaiian and Other Pacific Islander alone (%)
Races - Native Hawaiian and Other Pacific Islander alone (% change since 2000)
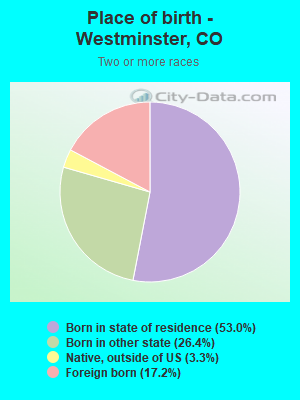
Races - Two or more races(%)
Races - Two or more races(% change since 2000)
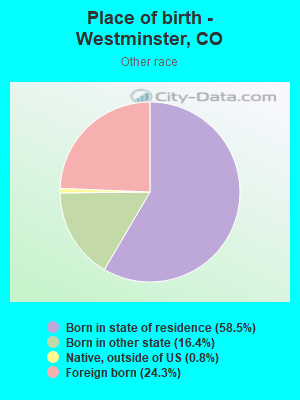
Races - Other race alone (%)
Races - Other race alone (% change since 2000)
Racial diversity
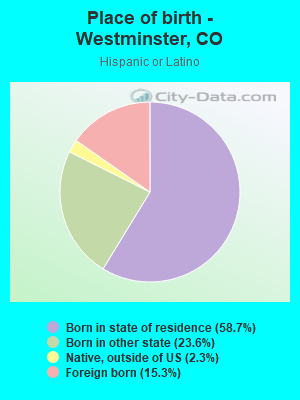
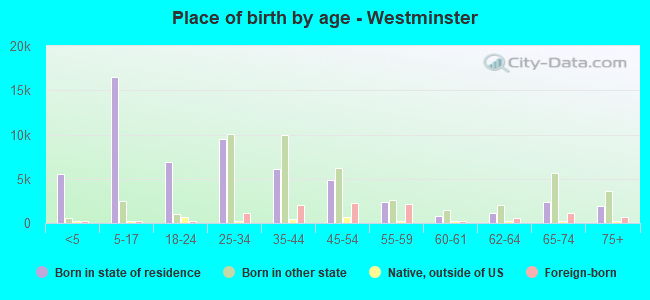
Place of birth - Born in state of residence (%)
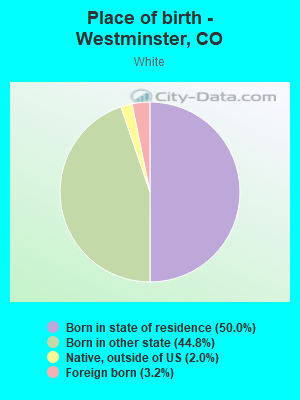
Place of birth - Born in state of residence (%) - White
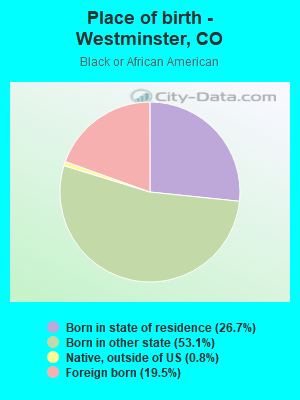
Place of birth - Born in state of residence (%) - Black or African American
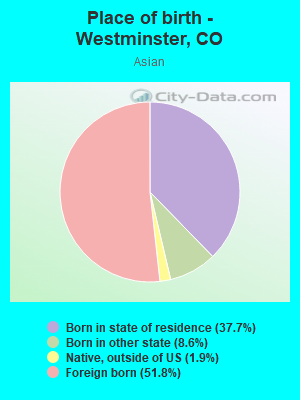
Place of birth - Born in state of residence (%) - Asian
Place of birth - Born in state of residence (%) - Hispanic or Latino
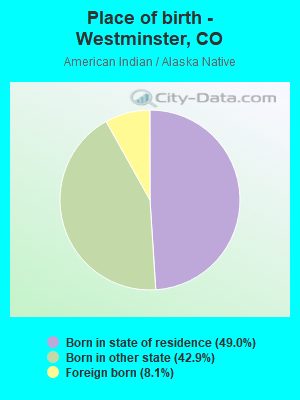
Place of birth - Born in state of residence (%) - American Indian and Alaska Native
Place of birth - Born in state of residence (%) - Multirace
Place of birth - Born in state of residence (%) - Other Race
Place of birth - Born in other state (%)
Place of birth - Born in other state (%) - White
Place of birth - Born in other state (%) - Black or African American
Place of birth - Born in other state (%) - Asian
Place of birth - Born in other state (%) - Hispanic or Latino
Place of birth - Born in other state (%) - American Indian and Alaska Native
Place of birth - Born in other state (%) - Multirace
Place of birth - Born in other state (%) - Other Race
Place of birth - Native, outside of US (%)
Place of birth - Native, outside of US (%) - White
Place of birth - Native, outside of US (%) - Black or African American
Place of birth - Native, outside of US (%) - Asian
Place of birth - Native, outside of US (%) - Hispanic or Latino
Place of birth - Native, outside of US (%) - American Indian and Alaska Native
Place of birth - Native, outside of US (%) - Multirace
Place of birth - Native, outside of US (%) - Other Race
Place of birth - Foreign born (%)
Place of birth - Foreign born (%) - White
Place of birth - Foreign born (%) - Black or African American
Place of birth - Foreign born (%) - Asian
Place of birth - Foreign born (%) - Hispanic or Latino
Place of birth - Foreign born (%) - American Indian and Alaska Native
Place of birth - Foreign born (%) - Multirace
Place of birth - Foreign born (%) - Other Race
Residents speaking English at home (%)
Residents speaking English at home - Born in the United States (%)
Residents speaking English at home - Native, born elsewhere (%)
Residents speaking English at home - Foreign born (%)
Residents speaking Spanish at home (%)
Residents speaking Spanish at home - Born in the United States (%)
Residents speaking Spanish at home - Native, born elsewhere (%)
Residents speaking Spanish at home - Foreign born (%)
Residents speaking other language at home (%)
Residents speaking other language at home - Born in the United States (%)
Residents speaking other language at home - Native, born elsewhere (%)
Residents speaking other language at home - Foreign born (%)
Marital status - Never married (%)
Marital status - Now married (%)
Marital status - Separated (%)
Marital status - Widowed (%)
Marital status - Divorced (%)
Ancestries Reported - Arab (%)
Ancestries Reported - Czech (%)
Ancestries Reported - Danish (%)
Ancestries Reported - Dutch (%)
Ancestries Reported - English (%)
Ancestries Reported - French (%)
Ancestries Reported - French Canadian (%)
Ancestries Reported - German (%)
Ancestries Reported - Greek (%)
Ancestries Reported - Hungarian (%)
Ancestries Reported - Irish (%)
Ancestries Reported - Italian (%)
Ancestries Reported - Lithuanian (%)
Ancestries Reported - Norwegian (%)
Ancestries Reported - Polish (%)
Ancestries Reported - Portuguese (%)
Ancestries Reported - Russian (%)
Ancestries Reported - Scotch-Irish (%)
Ancestries Reported - Scottish (%)
Ancestries Reported - Slovak (%)
Ancestries Reported - Subsaharan African (%)
Ancestries Reported - Swedish (%)
Ancestries Reported - Swiss (%)
Ancestries Reported - Ukrainian (%)
Ancestries Reported - United States (%)
Ancestries Reported - Welsh (%)
Ancestries Reported - West Indian (%)
Ancestries Reported - Other (%)
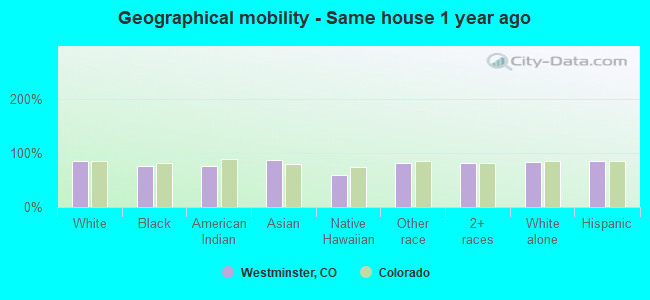
Geographical mobility - Same house 1 year ago (%)
Geographical mobility - Same house 1 year ago (%) - White
Geographical mobility - Same house 1 year ago (%) - Black or African American
Geographical mobility - Same house 1 year ago (%) - Asian
Geographical mobility - Same house 1 year ago (%) - Hispanic or Latino
Geographical mobility - Same house 1 year ago (%) - American Indian and Alaska Native
Geographical mobility - Same house 1 year ago (%) - Multirace
Geographical mobility - Same house 1 year ago (%) - Other Race
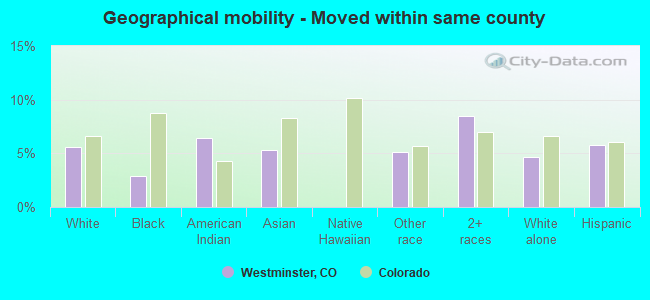
Geographical mobility - Moved within same county (%)
Geographical mobility - Moved within same county (%) - White
Geographical mobility - Moved within same county (%) - Black or African American
Geographical mobility - Moved within same county (%) - Asian
Geographical mobility - Moved within same county (%) - Hispanic or Latino
Geographical mobility - Moved within same county (%) - American Indian and Alaska Native
Geographical mobility - Moved within same county (%) - Multirace
Geographical mobility - Moved within same county (%) - Other Race
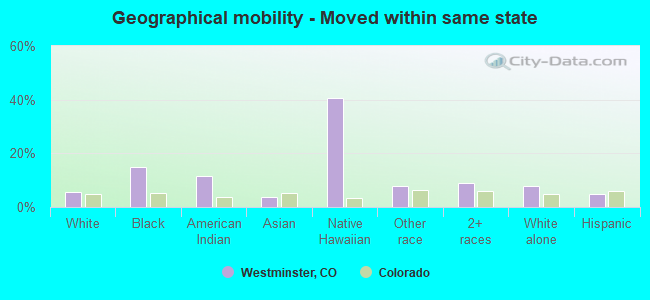
Geographical mobility - Moved from different county within same state (%)
Geographical mobility - Moved from different county within same state (%) - White
Geographical mobility - Moved from different county within same state (%) - Black or African American
Geographical mobility - Moved from different county within same state (%) - Asian
Geographical mobility - Moved from different county within same state (%) - Hispanic or Latino
Geographical mobility - Moved from different county within same state (%) - American Indian and Alaska Native
Geographical mobility - Moved from different county within same state (%) - Multirace
Geographical mobility - Moved from different county within same state (%) - Other Race
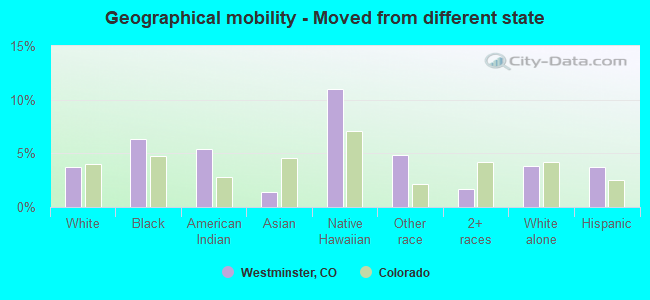
Geographical mobility - Moved from different state (%)
Geographical mobility - Moved from different state (%) - White
Geographical mobility - Moved from different state (%) - Black or African American
Geographical mobility - Moved from different state (%) - Asian
Geographical mobility - Moved from different state (%) - Hispanic or Latino
Geographical mobility - Moved from different state (%) - American Indian and Alaska Native
Geographical mobility - Moved from different state (%) - Multirace
Geographical mobility - Moved from different state (%) - Other Race
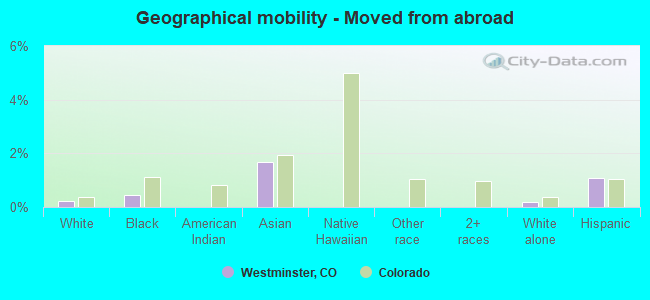
Geographical mobility - Moved from abroad (%)
Geographical mobility - Moved from abroad (%) - White
Geographical mobility - Moved from abroad (%) - Black or African American
Geographical mobility - Moved from abroad (%) - Asian
Geographical mobility - Moved from abroad (%) - Hispanic or Latino
Geographical mobility - Moved from abroad (%) - American Indian and Alaska Native
Geographical mobility - Moved from abroad (%) - Multirace
Geographical mobility - Moved from abroad (%) - Other Race
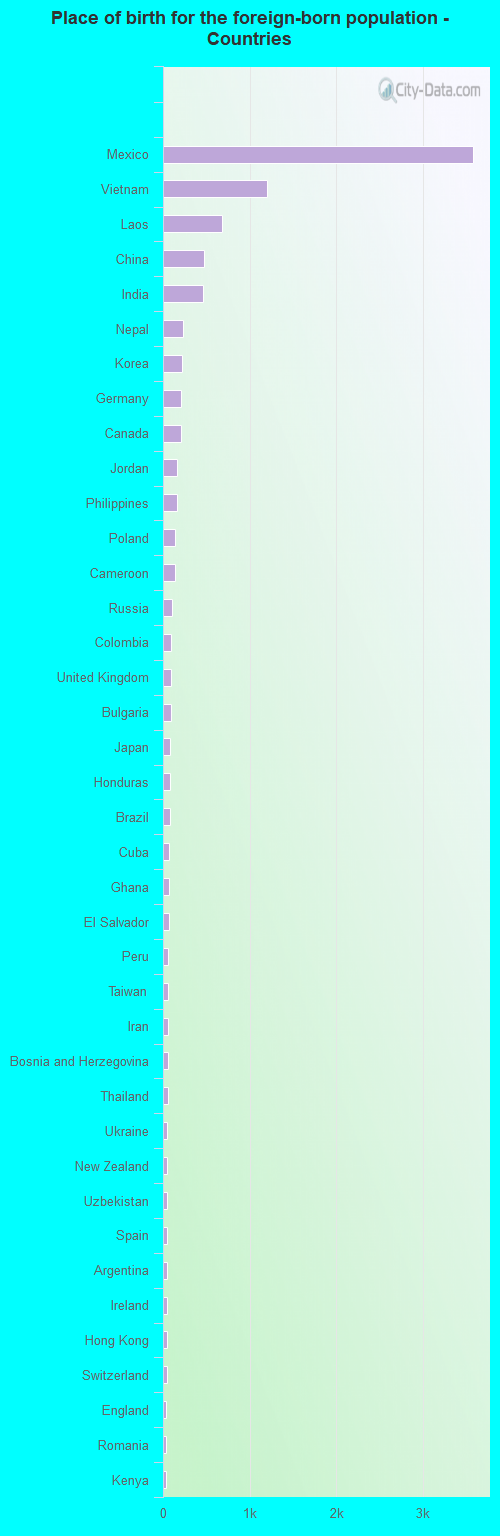
Place of birth for the foreign-born population - Ireland (%)
Place of birth for the foreign-born population - Denmark (%)
Place of birth for the foreign-born population - Norway (%)
Place of birth for the foreign-born population - Sweden (%)
Place of birth for the foreign-born population - United Kingdom (%)
Place of birth for the foreign-born population - England (%)
Place of birth for the foreign-born population - Scotland (%)
Place of birth for the foreign-born population - Other Northern Europe (%)
Place of birth for the foreign-born population - Austria (%)
Place of birth for the foreign-born population - Belgium (%)
Place of birth for the foreign-born population - France (%)
Place of birth for the foreign-born population - Germany (%)
Place of birth for the foreign-born population - Netherlands (%)
Place of birth for the foreign-born population - Switzerland (%)
Place of birth for the foreign-born population - Other Western Europe (%)
Place of birth for the foreign-born population - Greece (%)
Place of birth for the foreign-born population - Italy (%)
Place of birth for the foreign-born population - Portugal (%)
Place of birth for the foreign-born population - Spain (%)
Place of birth for the foreign-born population - Other Southern Europe (%)
Place of birth for the foreign-born population - Albania (%)
Place of birth for the foreign-born population - Belarus (%)
Place of birth for the foreign-born population - Bosnia and Herzegovina (%)
Place of birth for the foreign-born population - Bulgaria (%)
Place of birth for the foreign-born population - Croatia (%)
Place of birth for the foreign-born population - Czechoslovakia (%)
Place of birth for the foreign-born population - Hungary (%)
Place of birth for the foreign-born population - Latvia (%)
Place of birth for the foreign-born population - Lithuania (%)
Place of birth for the foreign-born population - North Macedonia (Macedonia) (%)
Place of birth for the foreign-born population - Moldova (%)
Place of birth for the foreign-born population - Poland (%)
Place of birth for the foreign-born population - Romania (%)
Place of birth for the foreign-born population - Russia (%)
Place of birth for the foreign-born population - Serbia (%)
Place of birth for the foreign-born population - Ukraine (%)
Place of birth for the foreign-born population - Other Eastern Europe (%)
Place of birth for the foreign-born population - China (%)
Place of birth for the foreign-born population - Hong Kong (%)
Place of birth for the foreign-born population - Taiwan (%)
Place of birth for the foreign-born population - Japan (%)
Place of birth for the foreign-born population - Korea (%)
Place of birth for the foreign-born population - Other Eastern Asia (%)
Place of birth for the foreign-born population - Afghanistan (%)
Place of birth for the foreign-born population - Bangladesh (%)
Place of birth for the foreign-born population - India (%)
Place of birth for the foreign-born population - Iran (%)
Place of birth for the foreign-born population - Kazakhstan (%)
Place of birth for the foreign-born population - Nepal (%)
Place of birth for the foreign-born population - Pakistan (%)
Place of birth for the foreign-born population - Sri Lanka (%)
Place of birth for the foreign-born population - Uzbekistan (%)
Place of birth for the foreign-born population - Other South Central Asia (%)
Place of birth for the foreign-born population - Burma (%)
Place of birth for the foreign-born population - Cambodia (%)
Place of birth for the foreign-born population - Indonesia (%)
Place of birth for the foreign-born population - Laos (%)
Place of birth for the foreign-born population - Malaysia (%)
Place of birth for the foreign-born population - Philippines (%)
Place of birth for the foreign-born population - Singapore (%)
Place of birth for the foreign-born population - Thailand (%)
Place of birth for the foreign-born population - Vietnam (%)
Place of birth for the foreign-born population - Other South Eastern Asia (%)
Place of birth for the foreign-born population - Armenia (%)
Place of birth for the foreign-born population - Iraq (%)
Place of birth for the foreign-born population - Israel (%)
Place of birth for the foreign-born population - Jordan (%)
Place of birth for the foreign-born population - Kuwait (%)
Place of birth for the foreign-born population - Lebanon (%)
Place of birth for the foreign-born population - Saudi Arabia (%)
Place of birth for the foreign-born population - Syria (%)
Place of birth for the foreign-born population - Turkey (%)
Place of birth for the foreign-born population - Yemen (%)
Place of birth for the foreign-born population - Other Western Asia (%)
Place of birth for the foreign-born population - Eritrea (%)
Place of birth for the foreign-born population - Ethiopia (%)
Place of birth for the foreign-born population - Kenya (%)
Place of birth for the foreign-born population - Somalia (%)
Place of birth for the foreign-born population - Uganda (%)
Place of birth for the foreign-born population - Zimbabwe (%)
Place of birth for the foreign-born population - Other Eastern Africa (%)
Place of birth for the foreign-born population - Cameroon (%)
Place of birth for the foreign-born population - Congo (%)
Place of birth for the foreign-born population - Democratic Republic of Congo (Zaire) (%)
Place of birth for the foreign-born population - Other Middle Africa (%)
Place of birth for the foreign-born population - Egypt (%)
Place of birth for the foreign-born population - Morocco (%)
Place of birth for the foreign-born population - Sudan (%)
Place of birth for the foreign-born population - Other Northern Africa (%)
Place of birth for the foreign-born population - South Africa (%)
Place of birth for the foreign-born population - Other Southern Africa (%)
Place of birth for the foreign-born population - Cabo Verde (%)
Place of birth for the foreign-born population - Ghana (%)
Place of birth for the foreign-born population - Liberia (%)
Place of birth for the foreign-born population - Nigeria (%)
Place of birth for the foreign-born population - Senegal (%)
Place of birth for the foreign-born population - Sierra Leone (%)
Place of birth for the foreign-born population - Other Western Africa (%)
Place of birth for the foreign-born population - Australia (%)
Place of birth for the foreign-born population - New Zealand (%)
Place of birth for the foreign-born population - Fiji (%)
Place of birth for the foreign-born population - Micronesia (%)
Place of birth for the foreign-born population - Bahamas (%)
Place of birth for the foreign-born population - Barbados (%)
Place of birth for the foreign-born population - Cuba (%)
Place of birth for the foreign-born population - Dominica (%)
Place of birth for the foreign-born population - Dominican Republic (%)
Place of birth for the foreign-born population - Grenada (%)
Place of birth for the foreign-born population - Haiti (%)
Place of birth for the foreign-born population - Jamaica (%)
Place of birth for the foreign-born population - St. Vincent and the Grenadines (%)
Place of birth for the foreign-born population - Trinidad and Tobago (%)
Place of birth for the foreign-born population - West Indies (%)
Place of birth for the foreign-born population - Other Caribbean (%)
Place of birth for the foreign-born population - Belize (%)
Place of birth for the foreign-born population - Costa Rica (%)
Place of birth for the foreign-born population - El Salvador (%)
Place of birth for the foreign-born population - Guatemala (%)
Place of birth for the foreign-born population - Honduras (%)
Place of birth for the foreign-born population - Mexico (%)
Place of birth for the foreign-born population - Nicaragua (%)
Place of birth for the foreign-born population - Panama (%)
Place of birth for the foreign-born population - Other Central America (%)
Place of birth for the foreign-born population - Argentina (%)
Place of birth for the foreign-born population - Bolivia (%)
Place of birth for the foreign-born population - Brazil (%)
Place of birth for the foreign-born population - Chile (%)
Place of birth for the foreign-born population - Colombia (%)
Place of birth for the foreign-born population - Ecuador (%)
Place of birth for the foreign-born population - Guyana (%)
Place of birth for the foreign-born population - Peru (%)
Place of birth for the foreign-born population - Uruguay (%)
Place of birth for the foreign-born population - Venezuela (%)
Place of birth for the foreign-born population - Other South America (%)
Place of birth for the foreign-born population - Canada (%)
Place of birth for the foreign-born population - Other Northern America (%)
Place of birth for the foreign-born population - Other (%)
Latest news about races in Westminster, CO collected exclusively by city-data.com from local newspapers, TV, and radio stations
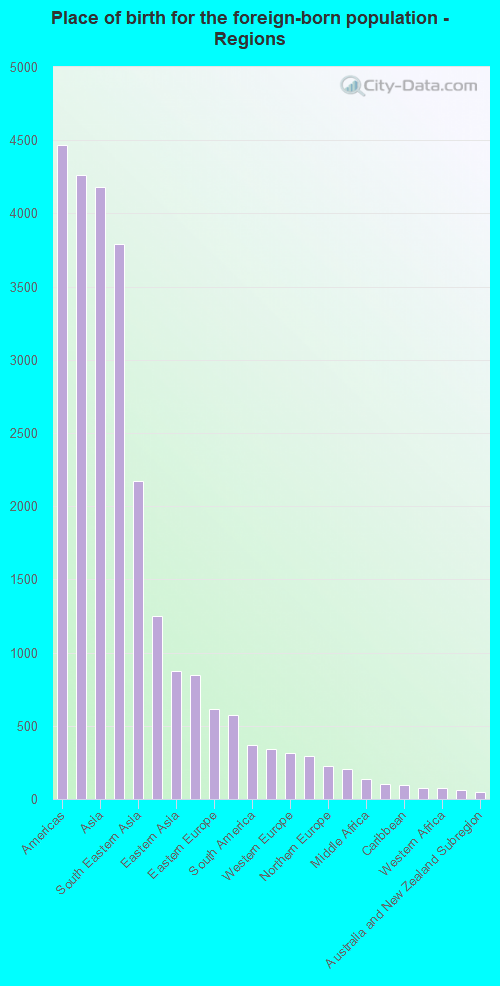
According to 2022 data, the most numerous races in Westminster, CO are White alone (76,058 residents), Hispanic (27,800 residents), and Two or more races (5,023 residents). 85.0% of Westminster residents speak English at home. 8.7% of Westminster, CO residents are foreign-born (3.7% born in Latin America, 3.6% born in Asia, 1.1% born in Europe), which is 4.0% less than the foreign-born rate of 9.0% across the entire state of Colorado.
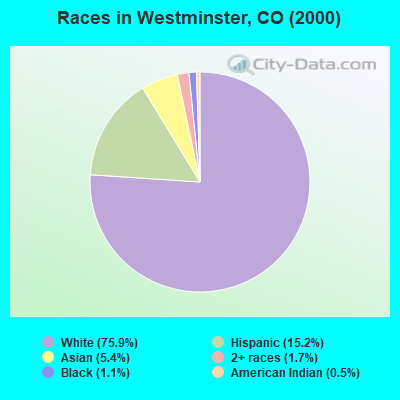
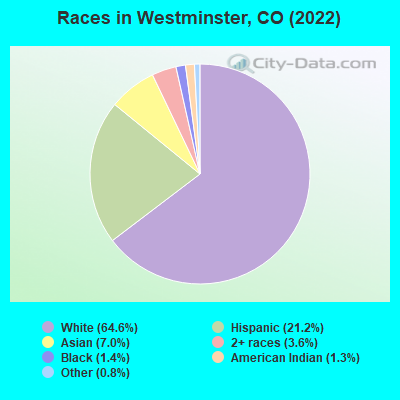
Race distribution in Westminster
2000 2022
76,637 75.9% White alone 15,369 15.2% Hispanic 5,479 5.4% Asian alone 1,716 1.7% Two or more races 1,149 1.1% Black alone 466 0.5% American Indian alone 71 0.07% Other race alone 53 0.05% Native Hawaiian and Other
76,058 63.8% White alone 27,800 23.3% Hispanic 6,838 5.7% Asian alone 5,023 4.2% Two or more races 2,131 1.8% Black alone 373 0.3% American Indian alone 201 0.2% Other race alone 114 0.10% Native Hawaiian and Other
2000 2022
3,202,880 74.5% White alone 735,601 17.1% Hispanic 158,443 3.7% Black alone 93,277 2.2% Asian alone 72,721 1.7% Two or more races 28,982 0.7% American Indian alone 5,512 0.1% Other race alone 3,845 0.09% Native Hawaiian and Other
3,793,270 65.0% White alone 1,314,962 22.5% Hispanic 268,754 4.6% Two or more races 220,756 3.8% Black alone 182,658 3.1% Asian alone 29,798 0.5% Other race alone 23,389 0.4% American Indian alone 6,339 0.1% Native Hawaiian and Other
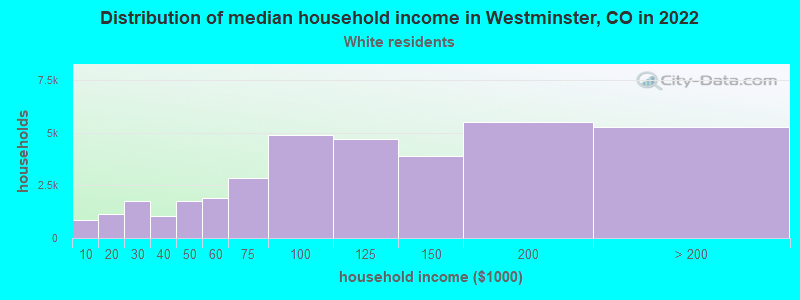
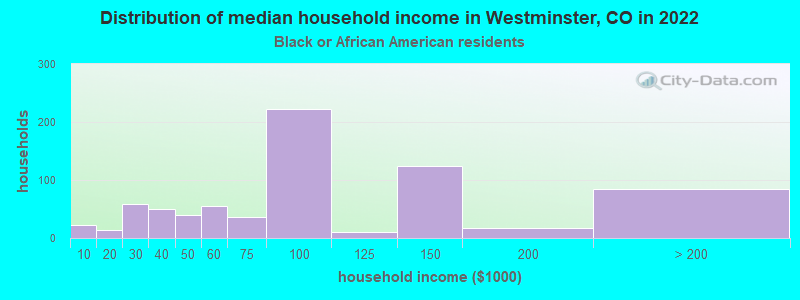
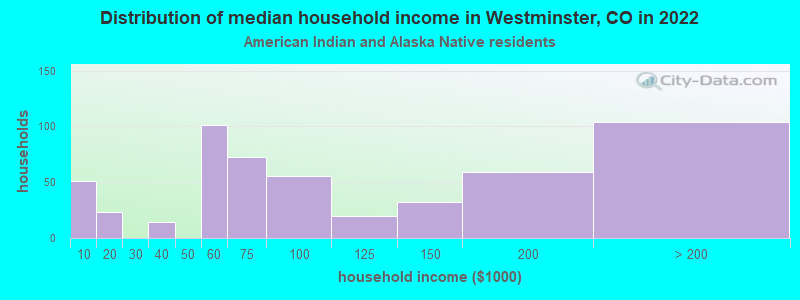
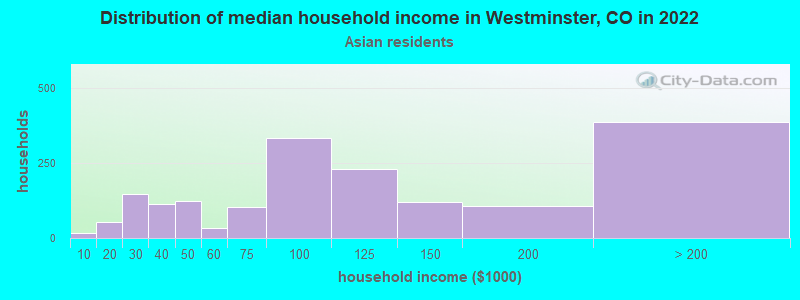
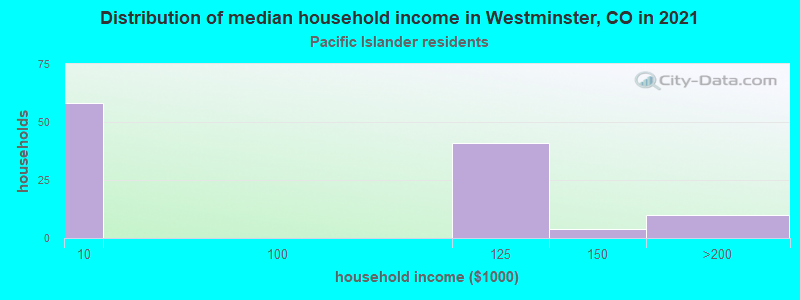
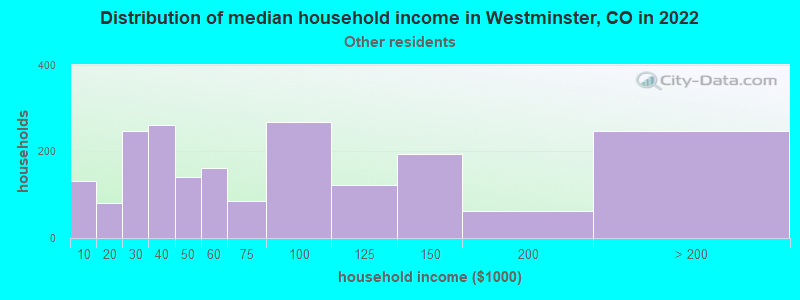
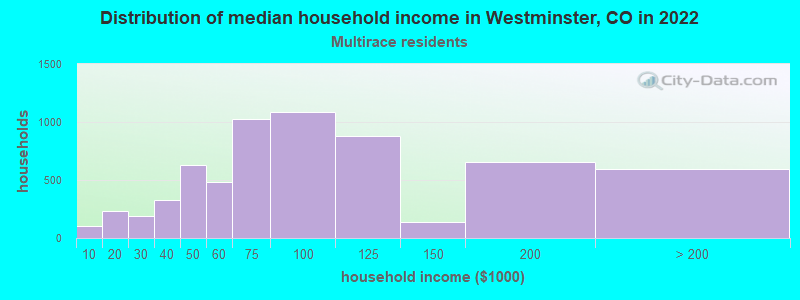
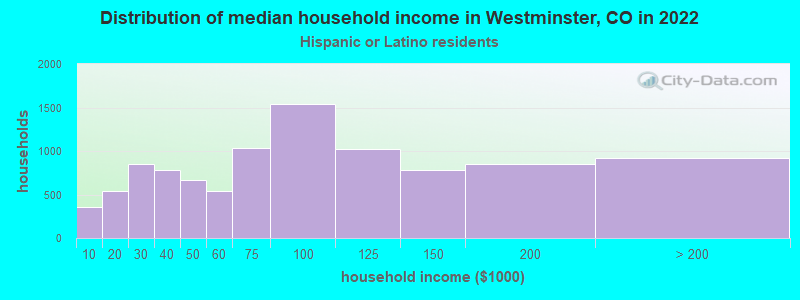
Income and house value in Westminster Median household income in 2022 $98,320 White non-Hispanic householders$66,135 Black householders$93,725 American Indian and Alaska Native householders$173,221 Asian householders$121,983 Native Hawaiian and other Pacific Islander householders$34,873 Some other race householders$109,779 Two or more races householders$95,658 Hispanic or Latino race householdersMedian 2022 house value $570,244 White Non-Hispanic householders$560,955 Black or African American householders$627,301 American Indian or Alaska Native householders $618,345 Asian householders$593,133 Native Hawaiian and other Pacific Islander householders$481,672 Some other race householders$487,975 Two or more races householders$513,186 Hispanic or Latino householders
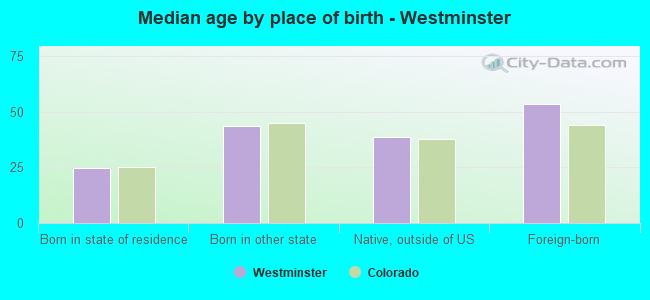
Median age by race in Westminster
38.2 Median age for White residents37.8 39.5 54.4 Median age for Black or African American residents62.4 36.8 26.2 Median age for American Indian / Alaska Native residents38.8 Median age for Asian residents43.0 36.8 46.9 Median age for Native Hawaiian / Pacific Islander residents39.6 51.3 31.2 Median age for Other race residents29.2 30.2 31.4 Median age for Two or more races residents11.5 36.4 38.8 Median age for White alone residents38.0 40.7 30.2 Median age for Hispanic or Latino residents30.3 29.9
Owner/renter occupied households by race in Westminster
House owners and renters - White residents 25,474 66.8% Owner occupied12,687 33.2% Renter occupiedHouse owners and renters - Black or African American residents 133 22.0% Owner occupied473 78.0% Renter occupiedHouse owners and renters - American Indian / Alaska Native residents 125 28.7% Owner occupied309 71.3% Renter occupiedHouse owners and renters - Asian residents 2,002 84.0% Owner occupied382 16.0% Renter occupiedHouse owners and renters - Native Hawaiian / Pacific Islander residents 56 52.0% Owner occupied52 48.0% Renter occupiedHouse owners and renters - Other race residents 515 61.2% Owner occupied326 38.8% Renter occupiedHouse owners and renters - Two or more races residents 3,690 70.7% Owner occupied1,527 29.3% Renter occupiedHouse owners and renters - White alone residents 23,060 67.9% Owner occupied10,923 32.1% Renter occupiedHouse owners and renters - Hispanic or Latino residents 4,333 56.6% Owner occupied3,321 43.4% Renter occupied
Language usage in Westminster
English speakers - Total 85.0% of residents of Westminster speak English at home.
8.1% of residents speak Spanish at home 6,125 68.8% Speak English very well2,780 31.2% Speak English less than very well7.0% of residents speak other language at home 4,976 64.4% Speak English very well2,748 35.6% Speak English less than very well
English speakers - Born in the United States 94.2% of residents of Westminster speak English at home.
4.2% of residents speak Spanish at home 1,932 95.2% Speak English very well97 4.8% Speak English less than very well1.6% of residents speak other language at home 718 92.3% Speak English very well60 7.7% Speak English less than very well
English speakers - Native, born elsewhere 69.0% of residents of Westminster speak English at home.
21.2% of residents speak Spanish at home 350 89.1% Speak English very well43 10.9% Speak English less than very well9.6% of residents speak other language at home 156 88.1% Speak English very well21 11.9% Speak English less than very well
English speakers - Foreign-born 14.2% of residents of Westminster speak English at home.
37.1% of residents speak Spanish at home 1,507 39.6% Speak English very well2,296 60.4% Speak English less than very well49.0% of residents speak other language at home 2,601 51.8% Speak English very well2,419 48.2% Speak English less than very well
White (Caucasian) - Speak only English Native:
95.0% (79,197)Foreign-born:
43.5% (1,245)
White (Caucasian) - Speak another language Native:
5.1% (4,270)Foreign-born:
62.0% (1,777)
Black or African American - Speak only English Native:
96.8% (1,622)Foreign-born:
8.7% (38)
Black or African American - Speak another language Native:
1.8% (30)Foreign-born:
92.8% (405)
American Indian / Alaska Native - Speak only English Native:
82.7% (784)Foreign-born:
19.4% (17)
American Indian / Alaska Native - Speak another language Native:
17.2% (163)Foreign-born:
76.2% (67)
Asian - Speak only English Native:
53.5% (1,368)Foreign-born:
8.4% (360)
Asian - Speak another language Native:
45.2% (1,154)Foreign-born:
90.7% (3,887)
Native Hawaiian / Pacific Islander - Speak only English Native:
86.2% (80)Foreign-born:
78.7% (58)
Native Hawaiian / Pacific Islander - Speak another language Native:
15.8% (15)Foreign-born:
35.9% (26)
Other race - Speak only English Native:
72.3% (1,779)Foreign-born:
20.1% (158)
Other race - Speak another language Native:
26.5% (652)Foreign-born:
85.2% (669)
Two or more races - Speak only English Native:
71.1% (8,577)Foreign-born:
3.9% (114)
Two or more races - Speak another language Native:
37.3% (4,497)Foreign-born:
100.0% (2,907)
White alone - Speak only English Native:
96.8% (70,282)Foreign-born:
46.7% (796)
White alone - Speak another language Native:
3.2% (2,293)Foreign-born:
53.3% (908)
Hispanic or Latino - Speak only English Native:
79.3% (16,186)Foreign-born:
25.6% (709)
Hispanic or Latino - Speak another language Native:
22.2% (4,541)Foreign-born:
79.9% (2,217)
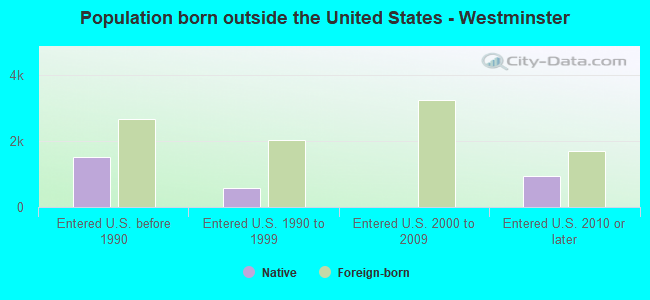
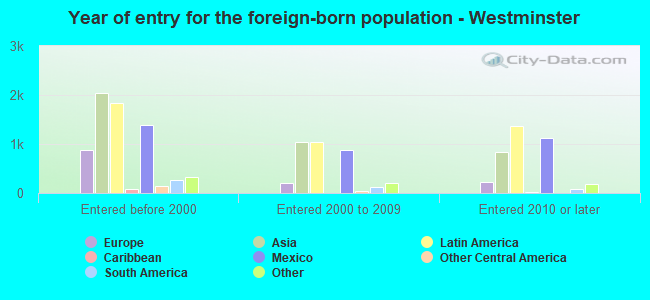
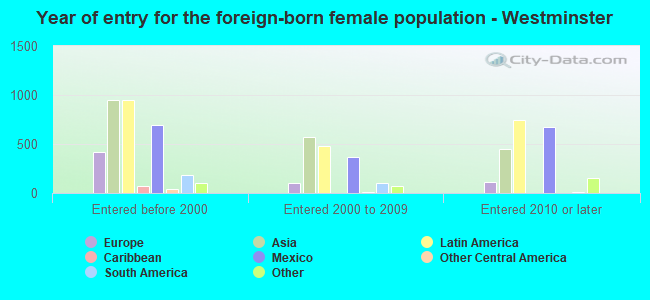
Foreign-born residents in Westminster 10,320 residents are foreign born (3.7% Latin America , 3.6% Asia , 1.1% Europe ).
This city:
8.7%Colorado:
100.0%
Marital status for residents in Westminster Marital status - White (Caucasian) population 15 years and over
Males 33.2% Never married49.6% Now married1.7% Separated2.4% Widowed13.1% DivorcedFemales 29.6% Never married49.5% Now married1.4% Separated5.9% Widowed13.6% DivorcedWomen who gave birth in the past 12 months Now married:
67.5% (369)Unmarried:
32.5% (177)
Women who did not give birth in the past 12 months Now married:
48.4% (9,935)Unmarried:
51.6% (10,579)
Marital status - Black or African American population 15 years and over
Males 40.3% Never married37.1% Now married4.4% Separated0.7% Widowed17.5% DivorcedFemales 36.7% Never married38.2% Now married2.5% Separated4.6% Widowed18.1% DivorcedWomen who gave birth in the past 12 months Now married:
0.0% (0)Unmarried:
100.0% (13)
Women who did not give birth in the past 12 months Now married:
41.5% (177)Unmarried:
58.5% (250)
Marital status - American Indian / Alaska Native population 15 years and over
Males 65.1% Never married23.8% Now married3.1% Separated4.5% Widowed3.5% DivorcedFemales 47.0% Never married20.3% Now married5.0% Separated7.1% Widowed20.5% DivorcedWomen who did not give birth in the past 12 months Now married:
26.5% (84)Unmarried:
73.5% (232)
Marital status - Asian population 15 years and over
Males 30.1% Never married65.8% Now married0.0% Separated0.0% Widowed4.1% DivorcedFemales 30.2% Never married52.0% Now married0.0% Separated10.7% Widowed7.1% DivorcedWomen who gave birth in the past 12 months Now married:
100.0% (102)Unmarried:
0.0% (0)
Women who did not give birth in the past 12 months Now married:
46.6% (1,198)Unmarried:
53.4% (1,374)
Marital status - Native Hawaiian / Pacific Islander population 15 years and over
Males 53.7% Never married46.3% Now married0.0% Separated0.0% Widowed0.0% DivorcedFemales 28.9% Never married71.1% Now married0.0% Separated0.0% Widowed0.0% DivorcedWomen who did not give birth in the past 12 months Now married:
71.1% (24)Unmarried:
28.9% (10)
Marital status - Other race population 15 years and over
Males 41.5% Never married37.7% Now married4.1% Separated5.6% Widowed11.2% DivorcedFemales 26.9% Never married52.5% Now married0.0% Separated5.5% Widowed15.0% DivorcedWomen who gave birth in the past 12 months Now married:
10.9% (10)Unmarried:
89.1% (77)
Women who did not give birth in the past 12 months Now married:
55.5% (375)Unmarried:
44.5% (300)
Marital status - Two or more races population 15 years and over
Males 57.0% Never married29.8% Now married1.1% Separated1.5% Widowed10.7% DivorcedFemales 54.3% Never married30.4% Now married2.5% Separated3.2% Widowed9.5% DivorcedWomen who gave birth in the past 12 months Now married:
54.8% (242)Unmarried:
45.2% (200)
Women who did not give birth in the past 12 months Now married:
28.1% (1,526)Unmarried:
71.9% (3,907)
Marital status - White alone, not Hispanic / Latino population 15 years and over
Males 31.1% Never married50.5% Now married1.4% Separated2.7% Widowed14.3% DivorcedFemales 28.0% Never married49.5% Now married1.3% Separated5.9% Widowed15.3% DivorcedWomen who gave birth in the past 12 months Now married:
67.5% (398)Unmarried:
32.5% (192)
Women who did not give birth in the past 12 months Now married:
48.4% (8,589)Unmarried:
51.6% (9,146)
Marital status - Hispanic or Latino population 15 years and over
Males 45.7% Never married41.8% Now married3.6% Separated1.7% Widowed7.3% DivorcedFemales 39.5% Never married47.0% Now married1.5% Separated6.5% Widowed5.5% DivorcedWomen who gave birth in the past 12 months Now married:
44.2% (245)Unmarried:
55.8% (310)
Women who did not give birth in the past 12 months Now married:
42.3% (2,751)Unmarried:
57.7% (3,752)
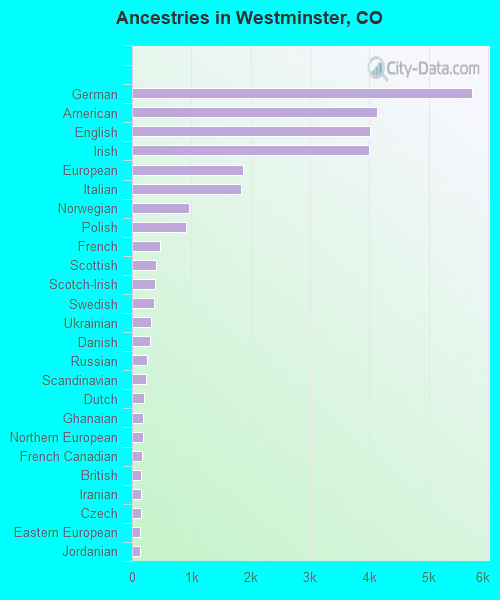
Ancestries in Westminster
5,254 10.5% German3,063 6.1% English2,910 5.8% European2,669 5.3% Irish2,630 5.3% American2,061 4.1% Italian746 1.5% Polish507 1.0% Scottish501 1.0% Swedish486 1.0% Norwegian409 0.8% Northern European301 0.6% Russian256 0.5% British221 0.4% Dutch188 0.4% French182 0.4% Scotch-Irish173 0.3% Czech168 0.3% Scandinavian164 0.3% French Canadian152 0.3% Eastern European142 0.3% Sudanese132 0.3% Lithuanian123 0.2% Bulgarian120 0.2% Swiss119 0.2% Hungarian109 0.2% Ghanaian103 0.2% Armenian97 0.2% Yugoslavian94 0.2% Czechoslovakian87 0.2% Slovak87 0.2% Welsh82 0.2% African81 0.2% Romanian79 0.2% Austrian65 0.1% Ukrainian60 0.1% Danish58 0.1% Portuguese58 0.1% Greek58 0.1% Canadian57 0.1% Ethiopian56 0.1% Brazilian52 0.1% Turkish42 0.08% Iranian36 0.07% Slavic32 0.06% Arab32 0.06% Lebanese32 0.06% Israeli30 0.06% Finnish28 0.06% Croatian25 0.05% Serbian24 0.05% Belgian24 0.05% Jamaican22 0.04% Latvian21 0.04% Slovene21 0.04% German Russian20 0.04% New Zealander16 0.03% Egyptian15 0.03% Celtic15 0.03% Icelander14 0.03% Basque12 0.02% Albanian10 0.02% South African9 0.02% Estonian8 0.02% Alsatian6 0.01% Assyrian6 0.01% Pennsylvania German
Geographical mobility in Westminster Same house 1 year ago 75,663 85.0% White (Caucasian)1,687 76.5% Black or African American833 76.6% American Indian / Alaska Native6,215 87.1% Asian98 58.8% Native Hawaiian / Pacific Islander2,718 81.0% Other race10,473 81.4% Two or more races62,851 83.8% White alone, not Hispanic / Latino22,134 84.9% Hispanic or LatinoMoved within same county 4,994 5.6% White / Caucasian63 2.9% Black or African American70 6.5% American Indian / Alaska Native377 5.3% Asian171 5.1% Other race1,092 8.5% Two or more races3,478 4.6% White alone, not Hispanic / Latino1,507 5.8% Hispanic or LatinoMoved within same state 5,001 5.6% White / Caucasian328 14.9% Black or African American124 11.4% American Indian / Alaska Native269 3.8% Asian67 40.6% Native Hawaiian / Pacific Islander265 7.9% Other race1,147 8.9% Two or more races5,859 7.8% White alone, not Hispanic / Latino1,265 4.9% Hispanic or LatinoMoved from different state 3,287 3.7% White / Caucasian139 6.3% Black or African American59 5.4% American Indian / Alaska Native102 1.4% Asian18 11.0% Native Hawaiian / Pacific Islander162 4.8% Other race212 1.6% Two or more races2,872 3.8% White alone, not Hispanic / Latino969 3.7% Hispanic or LatinoMoved from abroad 193 0.2% White10 0.4% Black or African American120 1.7% Asian129 0.2% White alone, not Hispanic / Latino282 1.1% Hispanic or Latino
Children Nativity (place of birth) in Westminster
Children under 6 years - Living with two parents Both parents native 4,297 100.0% NativeBoth parents foreign-born 402 93.0% Native30 7.0% Foreign-bornOne native, one foreign-born parent 494 100.0% NativeChildren under 6 years - Living with one parent Native parent 1,868 100.0% NativeForeign-born parent 208 100.0% NativeChildren 6 to 17 years - Living with two parents Both parents native 8,413 99.4% Native49 0.6% Foreign-bornBoth parents foreign-born 1,358 86.7% Native208 13.3% Foreign-bornOne native, one foreign-born parent 787 100.0% NativeChildren 6 to 17 years - Living with one parent Native parent 5,093 100.0% NativeForeign-born parent 451 51.0% Native433 49.0% Foreign-born
Place of birth for residents in Westminster
Grandparents responsible for own grandchildren in Westminster
Grandparents (30 to 59 years) White / Caucasian 159 39.7% Responsible for grandchildren242 60.3% Not responsible for grandchildrenBlack or African American 8 39.8% Responsible for grandchildren11 60.2% Not responsible for grandchildrenAsian 51 33.5% Responsible for grandchildren100 66.5% Not responsible for grandchildrenOther race 15 25.9% Responsible for grandchildren42 74.1% Not responsible for grandchildrenTwo or more races 242 100.0% Not responsible for grandchildrenWhite alone, not Hispanic / Latino 50 14.6% Responsible for grandchildren290 85.4% Not responsible for grandchildrenHispanic or Latino 231 46.1% Responsible for grandchildren270 53.9% Not responsible for grandchildrenGrandparents (60 years and over) White / Caucasian 211 28.2% Responsible for grandchildren538 71.8% Not responsible for grandchildrenBlack or African American 16 30.8% Responsible for grandchildren36 69.2% Not responsible for grandchildrenAsian 6 5.5% Responsible for grandchildren112 94.5% Not responsible for grandchildrenOther race 32 100.0% Not responsible for grandchildrenTwo or more races 26 49.2% Responsible for grandchildren26 50.8% Not responsible for grandchildrenWhite alone, not Hispanic / Latino 247 54.2% Responsible for grandchildren209 45.8% Not responsible for grandchildrenHispanic or Latino 115 36.5% Responsible for grandchildren200 63.5% Not responsible for grandchildren