Races in Westmont, California (CA) Detailed Stats
Data:
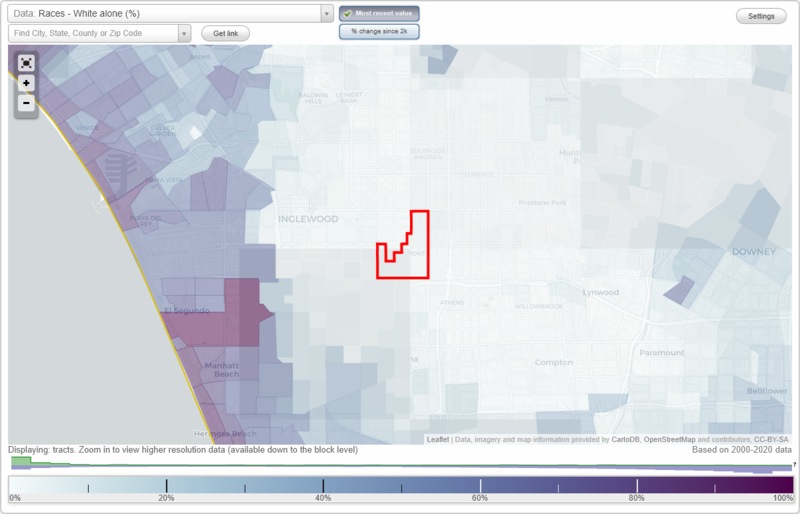
Races - White alone (%)
Races - White alone (% change since 2000)
Races - Black alone (%)
Races - Black alone (% change since 2000)
Races - American Indian alone (%)
Races - American Indian alone (% change since 2000)
Races - Asian alone (%)
Races - Asian alone (% change since 2000)
Races - Hispanic (%)
Races - Hispanic (% change since 2000)
Races - Native Hawaiian and Other Pacific Islander alone (%)
Races - Native Hawaiian and Other Pacific Islander alone (% change since 2000)
Races - Two or more races(%)
Races - Two or more races(% change since 2000)
Races - Other race alone (%)
Races - Other race alone (% change since 2000)
Racial diversity
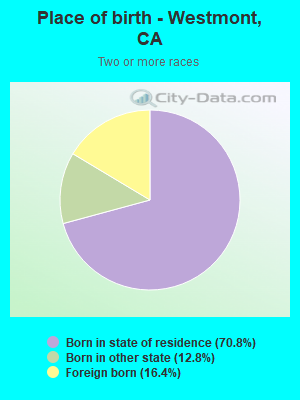
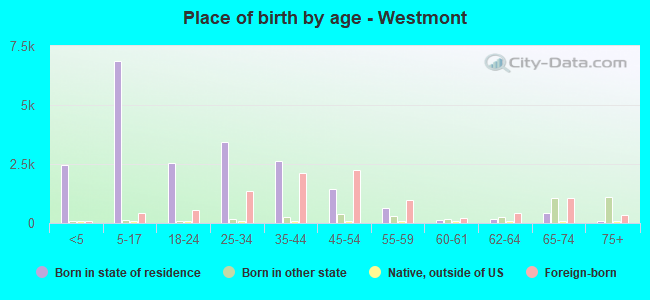
Place of birth - Born in state of residence (%)
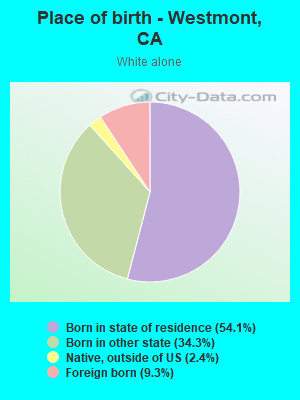
Place of birth - Born in state of residence (%) - White
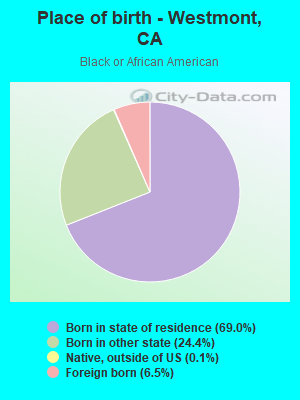
Place of birth - Born in state of residence (%) - Black or African American
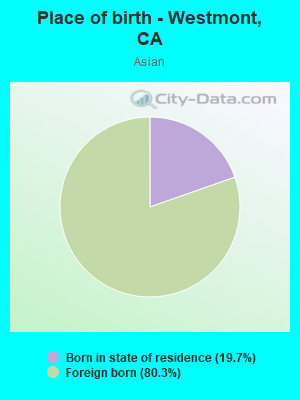
Place of birth - Born in state of residence (%) - Asian
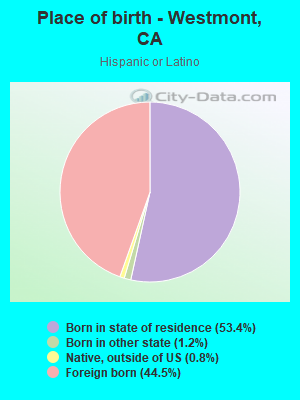
Place of birth - Born in state of residence (%) - Hispanic or Latino
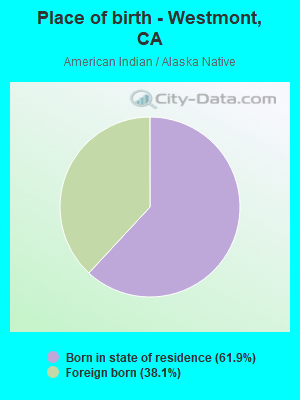
Place of birth - Born in state of residence (%) - American Indian and Alaska Native
Place of birth - Born in state of residence (%) - Multirace
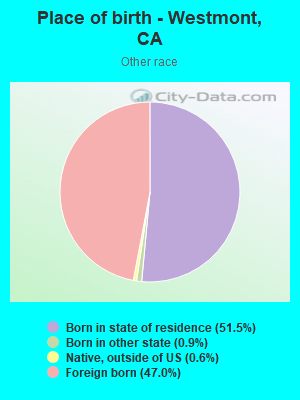
Place of birth - Born in state of residence (%) - Other Race
Place of birth - Born in other state (%)
Place of birth - Born in other state (%) - White
Place of birth - Born in other state (%) - Black or African American
Place of birth - Born in other state (%) - Asian
Place of birth - Born in other state (%) - Hispanic or Latino
Place of birth - Born in other state (%) - American Indian and Alaska Native
Place of birth - Born in other state (%) - Multirace
Place of birth - Born in other state (%) - Other Race
Place of birth - Native, outside of US (%)
Place of birth - Native, outside of US (%) - White
Place of birth - Native, outside of US (%) - Black or African American
Place of birth - Native, outside of US (%) - Asian
Place of birth - Native, outside of US (%) - Hispanic or Latino
Place of birth - Native, outside of US (%) - American Indian and Alaska Native
Place of birth - Native, outside of US (%) - Multirace
Place of birth - Native, outside of US (%) - Other Race
Place of birth - Foreign born (%)
Place of birth - Foreign born (%) - White
Place of birth - Foreign born (%) - Black or African American
Place of birth - Foreign born (%) - Asian
Place of birth - Foreign born (%) - Hispanic or Latino
Place of birth - Foreign born (%) - American Indian and Alaska Native
Place of birth - Foreign born (%) - Multirace
Place of birth - Foreign born (%) - Other Race
Residents speaking English at home (%)
Residents speaking English at home - Born in the United States (%)
Residents speaking English at home - Native, born elsewhere (%)
Residents speaking English at home - Foreign born (%)
Residents speaking Spanish at home (%)
Residents speaking Spanish at home - Born in the United States (%)
Residents speaking Spanish at home - Native, born elsewhere (%)
Residents speaking Spanish at home - Foreign born (%)
Residents speaking other language at home (%)
Residents speaking other language at home - Born in the United States (%)
Residents speaking other language at home - Native, born elsewhere (%)
Residents speaking other language at home - Foreign born (%)
Marital status - Never married (%)
Marital status - Now married (%)
Marital status - Separated (%)
Marital status - Widowed (%)
Marital status - Divorced (%)
Ancestries Reported - Arab (%)
Ancestries Reported - Czech (%)
Ancestries Reported - Danish (%)
Ancestries Reported - Dutch (%)
Ancestries Reported - English (%)
Ancestries Reported - French (%)
Ancestries Reported - French Canadian (%)
Ancestries Reported - German (%)
Ancestries Reported - Greek (%)
Ancestries Reported - Hungarian (%)
Ancestries Reported - Irish (%)
Ancestries Reported - Italian (%)
Ancestries Reported - Lithuanian (%)
Ancestries Reported - Norwegian (%)
Ancestries Reported - Polish (%)
Ancestries Reported - Portuguese (%)
Ancestries Reported - Russian (%)
Ancestries Reported - Scotch-Irish (%)
Ancestries Reported - Scottish (%)
Ancestries Reported - Slovak (%)
Ancestries Reported - Subsaharan African (%)
Ancestries Reported - Swedish (%)
Ancestries Reported - Swiss (%)
Ancestries Reported - Ukrainian (%)
Ancestries Reported - United States (%)
Ancestries Reported - Welsh (%)
Ancestries Reported - West Indian (%)
Ancestries Reported - Other (%)
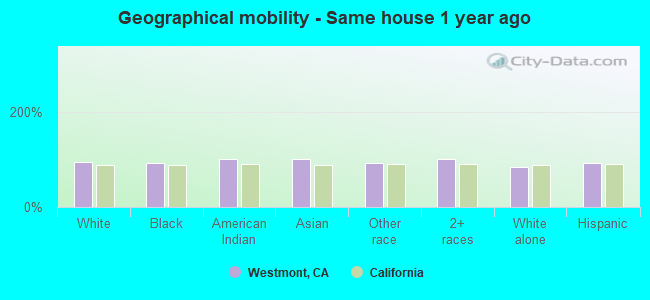
Geographical mobility - Same house 1 year ago (%)
Geographical mobility - Same house 1 year ago (%) - White
Geographical mobility - Same house 1 year ago (%) - Black or African American
Geographical mobility - Same house 1 year ago (%) - Asian
Geographical mobility - Same house 1 year ago (%) - Hispanic or Latino
Geographical mobility - Same house 1 year ago (%) - American Indian and Alaska Native
Geographical mobility - Same house 1 year ago (%) - Multirace
Geographical mobility - Same house 1 year ago (%) - Other Race
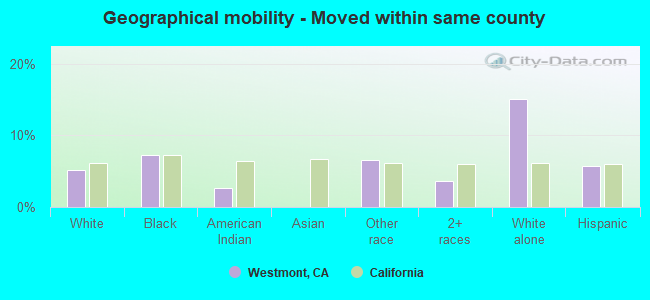
Geographical mobility - Moved within same county (%)
Geographical mobility - Moved within same county (%) - White
Geographical mobility - Moved within same county (%) - Black or African American
Geographical mobility - Moved within same county (%) - Asian
Geographical mobility - Moved within same county (%) - Hispanic or Latino
Geographical mobility - Moved within same county (%) - American Indian and Alaska Native
Geographical mobility - Moved within same county (%) - Multirace
Geographical mobility - Moved within same county (%) - Other Race
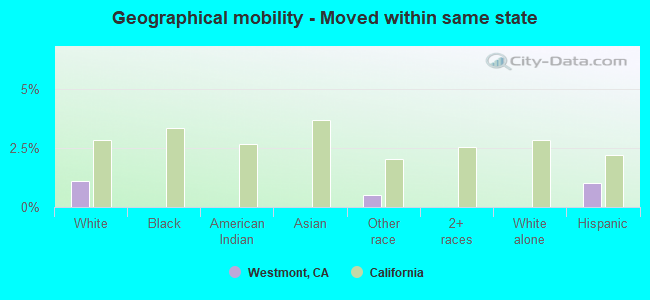
Geographical mobility - Moved from different county within same state (%)
Geographical mobility - Moved from different county within same state (%) - White
Geographical mobility - Moved from different county within same state (%) - Black or African American
Geographical mobility - Moved from different county within same state (%) - Asian
Geographical mobility - Moved from different county within same state (%) - Hispanic or Latino
Geographical mobility - Moved from different county within same state (%) - American Indian and Alaska Native
Geographical mobility - Moved from different county within same state (%) - Multirace
Geographical mobility - Moved from different county within same state (%) - Other Race
Geographical mobility - Moved from different state (%)
Geographical mobility - Moved from different state (%) - White
Geographical mobility - Moved from different state (%) - Black or African American
Geographical mobility - Moved from different state (%) - Asian
Geographical mobility - Moved from different state (%) - Hispanic or Latino
Geographical mobility - Moved from different state (%) - American Indian and Alaska Native
Geographical mobility - Moved from different state (%) - Multirace
Geographical mobility - Moved from different state (%) - Other Race
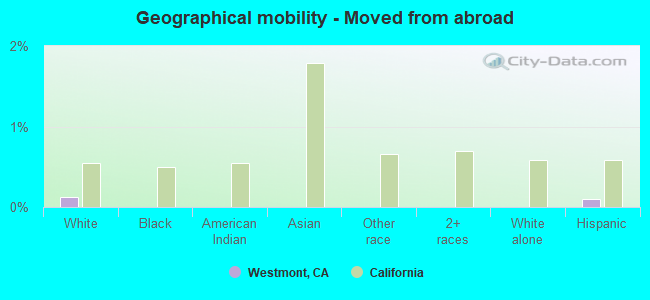
Geographical mobility - Moved from abroad (%)
Geographical mobility - Moved from abroad (%) - White
Geographical mobility - Moved from abroad (%) - Black or African American
Geographical mobility - Moved from abroad (%) - Asian
Geographical mobility - Moved from abroad (%) - Hispanic or Latino
Geographical mobility - Moved from abroad (%) - American Indian and Alaska Native
Geographical mobility - Moved from abroad (%) - Multirace
Geographical mobility - Moved from abroad (%) - Other Race
Place of birth for the foreign-born population - Ireland (%)
Place of birth for the foreign-born population - Denmark (%)
Place of birth for the foreign-born population - Norway (%)
Place of birth for the foreign-born population - Sweden (%)
Place of birth for the foreign-born population - United Kingdom (%)
Place of birth for the foreign-born population - England (%)
Place of birth for the foreign-born population - Scotland (%)
Place of birth for the foreign-born population - Other Northern Europe (%)
Place of birth for the foreign-born population - Austria (%)
Place of birth for the foreign-born population - Belgium (%)
Place of birth for the foreign-born population - France (%)
Place of birth for the foreign-born population - Germany (%)
Place of birth for the foreign-born population - Netherlands (%)
Place of birth for the foreign-born population - Switzerland (%)
Place of birth for the foreign-born population - Other Western Europe (%)
Place of birth for the foreign-born population - Greece (%)
Place of birth for the foreign-born population - Italy (%)
Place of birth for the foreign-born population - Portugal (%)
Place of birth for the foreign-born population - Spain (%)
Place of birth for the foreign-born population - Other Southern Europe (%)
Place of birth for the foreign-born population - Albania (%)
Place of birth for the foreign-born population - Belarus (%)
Place of birth for the foreign-born population - Bosnia and Herzegovina (%)
Place of birth for the foreign-born population - Bulgaria (%)
Place of birth for the foreign-born population - Croatia (%)
Place of birth for the foreign-born population - Czechoslovakia (%)
Place of birth for the foreign-born population - Hungary (%)
Place of birth for the foreign-born population - Latvia (%)
Place of birth for the foreign-born population - Lithuania (%)
Place of birth for the foreign-born population - North Macedonia (Macedonia) (%)
Place of birth for the foreign-born population - Moldova (%)
Place of birth for the foreign-born population - Poland (%)
Place of birth for the foreign-born population - Romania (%)
Place of birth for the foreign-born population - Russia (%)
Place of birth for the foreign-born population - Serbia (%)
Place of birth for the foreign-born population - Ukraine (%)
Place of birth for the foreign-born population - Other Eastern Europe (%)
Place of birth for the foreign-born population - China (%)
Place of birth for the foreign-born population - Hong Kong (%)
Place of birth for the foreign-born population - Taiwan (%)
Place of birth for the foreign-born population - Japan (%)
Place of birth for the foreign-born population - Korea (%)
Place of birth for the foreign-born population - Other Eastern Asia (%)
Place of birth for the foreign-born population - Afghanistan (%)
Place of birth for the foreign-born population - Bangladesh (%)
Place of birth for the foreign-born population - India (%)
Place of birth for the foreign-born population - Iran (%)
Place of birth for the foreign-born population - Kazakhstan (%)
Place of birth for the foreign-born population - Nepal (%)
Place of birth for the foreign-born population - Pakistan (%)
Place of birth for the foreign-born population - Sri Lanka (%)
Place of birth for the foreign-born population - Uzbekistan (%)
Place of birth for the foreign-born population - Other South Central Asia (%)
Place of birth for the foreign-born population - Burma (%)
Place of birth for the foreign-born population - Cambodia (%)
Place of birth for the foreign-born population - Indonesia (%)
Place of birth for the foreign-born population - Laos (%)
Place of birth for the foreign-born population - Malaysia (%)
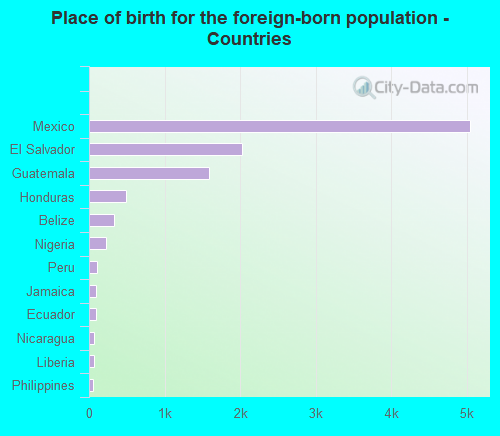
Place of birth for the foreign-born population - Philippines (%)
Place of birth for the foreign-born population - Singapore (%)
Place of birth for the foreign-born population - Thailand (%)
Place of birth for the foreign-born population - Vietnam (%)
Place of birth for the foreign-born population - Other South Eastern Asia (%)
Place of birth for the foreign-born population - Armenia (%)
Place of birth for the foreign-born population - Iraq (%)
Place of birth for the foreign-born population - Israel (%)
Place of birth for the foreign-born population - Jordan (%)
Place of birth for the foreign-born population - Kuwait (%)
Place of birth for the foreign-born population - Lebanon (%)
Place of birth for the foreign-born population - Saudi Arabia (%)
Place of birth for the foreign-born population - Syria (%)
Place of birth for the foreign-born population - Turkey (%)
Place of birth for the foreign-born population - Yemen (%)
Place of birth for the foreign-born population - Other Western Asia (%)
Place of birth for the foreign-born population - Eritrea (%)
Place of birth for the foreign-born population - Ethiopia (%)
Place of birth for the foreign-born population - Kenya (%)
Place of birth for the foreign-born population - Somalia (%)
Place of birth for the foreign-born population - Uganda (%)
Place of birth for the foreign-born population - Zimbabwe (%)
Place of birth for the foreign-born population - Other Eastern Africa (%)
Place of birth for the foreign-born population - Cameroon (%)
Place of birth for the foreign-born population - Congo (%)
Place of birth for the foreign-born population - Democratic Republic of Congo (Zaire) (%)
Place of birth for the foreign-born population - Other Middle Africa (%)
Place of birth for the foreign-born population - Egypt (%)
Place of birth for the foreign-born population - Morocco (%)
Place of birth for the foreign-born population - Sudan (%)
Place of birth for the foreign-born population - Other Northern Africa (%)
Place of birth for the foreign-born population - South Africa (%)
Place of birth for the foreign-born population - Other Southern Africa (%)
Place of birth for the foreign-born population - Cabo Verde (%)
Place of birth for the foreign-born population - Ghana (%)
Place of birth for the foreign-born population - Liberia (%)
Place of birth for the foreign-born population - Nigeria (%)
Place of birth for the foreign-born population - Senegal (%)
Place of birth for the foreign-born population - Sierra Leone (%)
Place of birth for the foreign-born population - Other Western Africa (%)
Place of birth for the foreign-born population - Australia (%)
Place of birth for the foreign-born population - New Zealand (%)
Place of birth for the foreign-born population - Fiji (%)
Place of birth for the foreign-born population - Micronesia (%)
Place of birth for the foreign-born population - Bahamas (%)
Place of birth for the foreign-born population - Barbados (%)
Place of birth for the foreign-born population - Cuba (%)
Place of birth for the foreign-born population - Dominica (%)
Place of birth for the foreign-born population - Dominican Republic (%)
Place of birth for the foreign-born population - Grenada (%)
Place of birth for the foreign-born population - Haiti (%)
Place of birth for the foreign-born population - Jamaica (%)
Place of birth for the foreign-born population - St. Vincent and the Grenadines (%)
Place of birth for the foreign-born population - Trinidad and Tobago (%)
Place of birth for the foreign-born population - West Indies (%)
Place of birth for the foreign-born population - Other Caribbean (%)
Place of birth for the foreign-born population - Belize (%)
Place of birth for the foreign-born population - Costa Rica (%)
Place of birth for the foreign-born population - El Salvador (%)
Place of birth for the foreign-born population - Guatemala (%)
Place of birth for the foreign-born population - Honduras (%)
Place of birth for the foreign-born population - Mexico (%)
Place of birth for the foreign-born population - Nicaragua (%)
Place of birth for the foreign-born population - Panama (%)
Place of birth for the foreign-born population - Other Central America (%)
Place of birth for the foreign-born population - Argentina (%)
Place of birth for the foreign-born population - Bolivia (%)
Place of birth for the foreign-born population - Brazil (%)
Place of birth for the foreign-born population - Chile (%)
Place of birth for the foreign-born population - Colombia (%)
Place of birth for the foreign-born population - Ecuador (%)
Place of birth for the foreign-born population - Guyana (%)
Place of birth for the foreign-born population - Peru (%)
Place of birth for the foreign-born population - Uruguay (%)
Place of birth for the foreign-born population - Venezuela (%)
Place of birth for the foreign-born population - Other South America (%)
Place of birth for the foreign-born population - Canada (%)
Place of birth for the foreign-born population - Other Northern America (%)
Place of birth for the foreign-born population - Other (%)
Latest news about races in Westmont, CA collected exclusively by city-data.com from local newspapers, TV, and radio stations
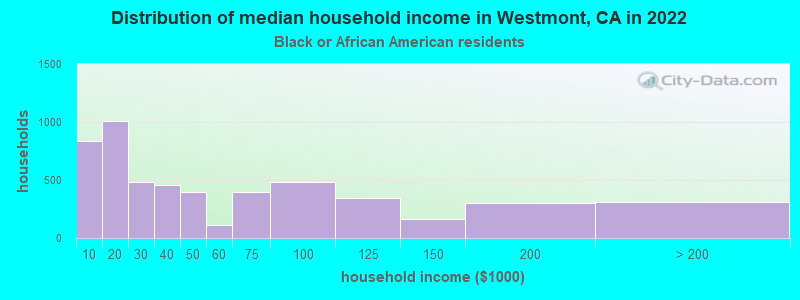
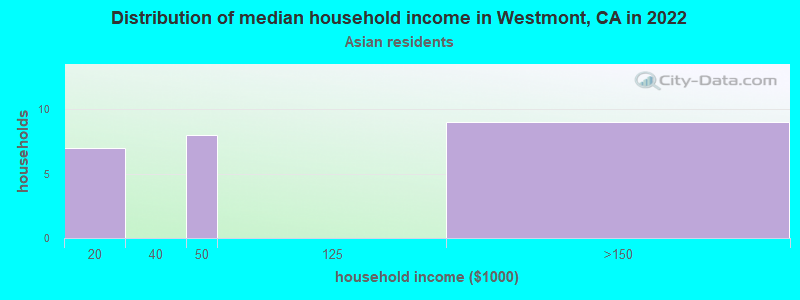
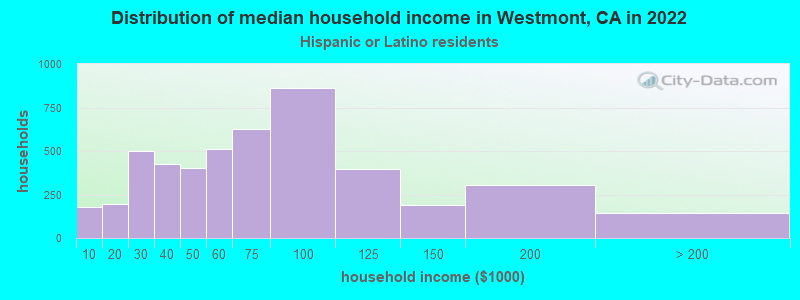
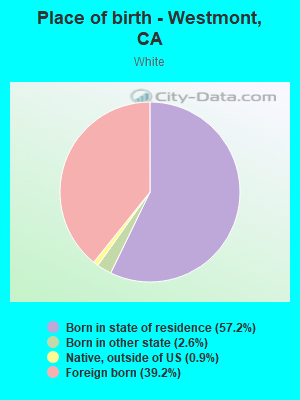
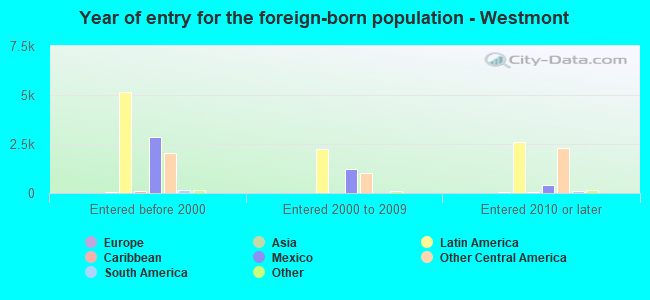
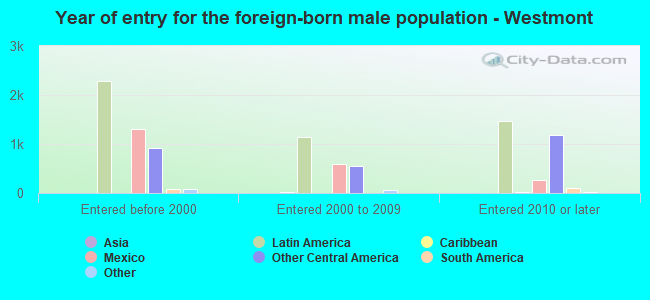
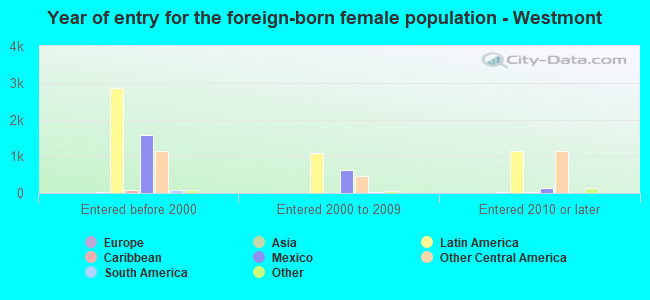
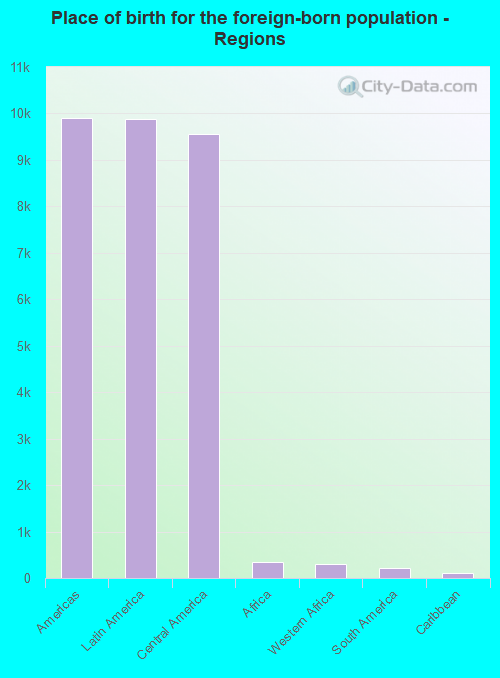
According to 2022 data, the most numerous races in Westmont, CA are Hispanic (20,505 residents), White alone (404 residents), and Asian alone (85 residents). 46.2% of Westmont residents speak English at home. 29.3% of Westmont, CA residents are foreign-born (27.7% born in Latin America), which is 11.4% greater than the foreign-born rate of 26.0% across the entire state of California.
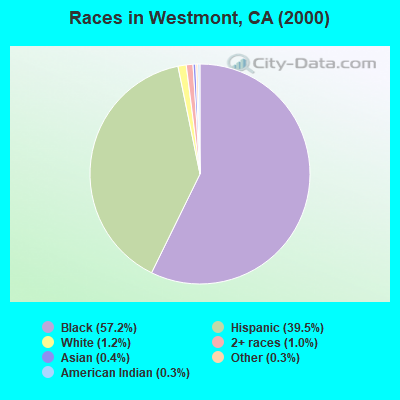
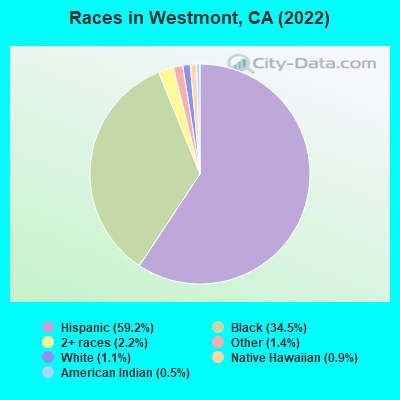
Race distribution in Westmont
2000 2022
15,816,790 46.7% White alone 10,966,556 32.4% Hispanic 3,648,860 10.8% Asian alone 2,181,926 6.4% Black alone 903,115 2.7% Two or more races 178,984 0.5% American Indian alone 103,736 0.3% Native Hawaiian and Other 71,681 0.2% Other race alone
15,732,184 40.3% Hispanic 13,160,426 33.7% White alone 5,957,867 15.3% Asian alone 2,025,218 5.2% Black alone 1,663,222 4.3% Two or more races 251,618 0.6% Other race alone 135,777 0.3% Native Hawaiian and Other 103,030 0.3% American Indian alone
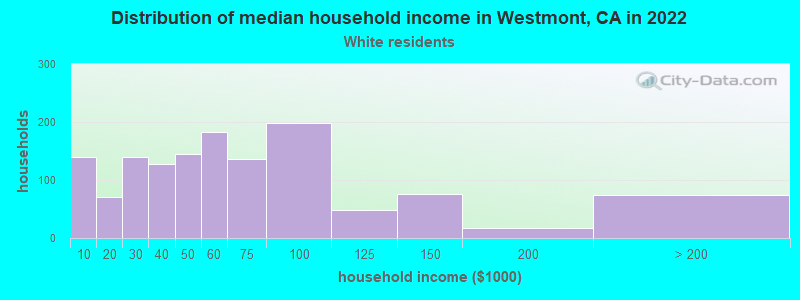
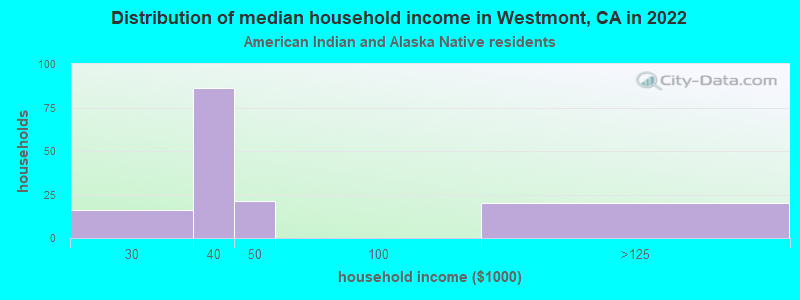
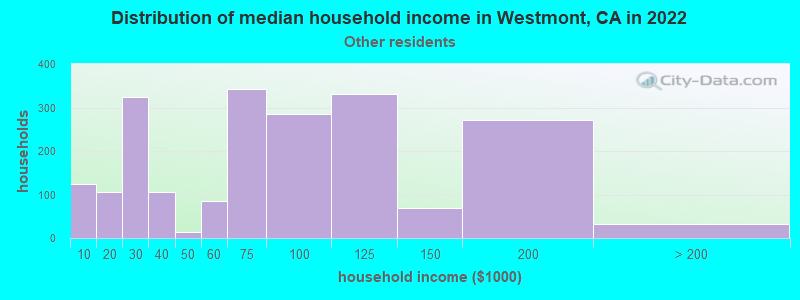
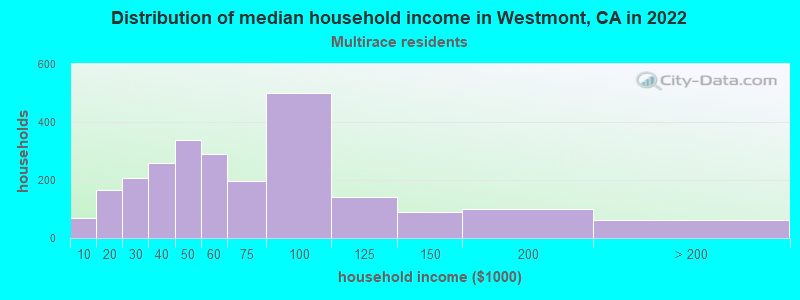
Income and house value in Westmont Median household income in 2022 $21,117 White non-Hispanic householders$41,968 Black householders$85,018 American Indian and Alaska Native householders$112,194 Asian householders$60,220 Native Hawaiian and other Pacific Islander householders$54,682 Some other race householders$40,596 Two or more races householders$61,860 Hispanic or Latino race householdersMedian 2022 house value $452,791 White Non-Hispanic householders$561,850 Black or African American householders$494,903 American Indian or Alaska Native householders $539,894 Asian householders$513,259 Some other race householders$511,459 Two or more races householders$515,779 Hispanic or Latino householders
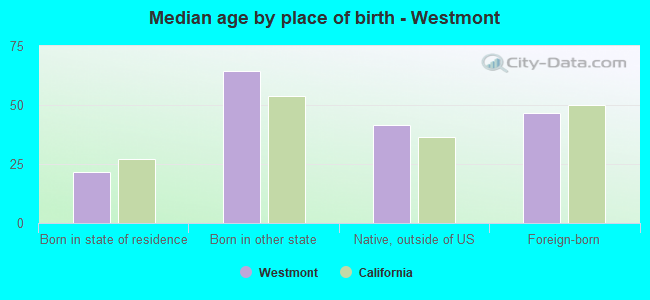
Median age by race in Westmont
31.3 Median age for White residents27.9 34.5 41.0 Median age for Black or African American residents38.2 41.4 33.8 Median age for American Indian / Alaska Native residents16.5 34.8 40.4 Median age for Asian residents40.5 34.9 24.7 Median age for Native Hawaiian / Pacific Islander residents30.1 Median age for Other race residents29.4 31.2 20.8 Median age for Two or more races residents18.0 21.2 39.8 Median age for White alone residents29.9 42.2 29.8 Median age for Hispanic or Latino residents27.8 32.2
Owner/renter occupied households by race in Westmont
House owners and renters - White residents 732 30.1% Owner occupied1,702 69.9% Renter occupiedHouse owners and renters - Black or African American residents 1,705 30.4% Owner occupied3,911 69.6% Renter occupiedHouse owners and renters - American Indian / Alaska Native residents 38 34.3% Owner occupied73 65.7% Renter occupiedHouse owners and renters - Asian residents 20 63.5% Owner occupied12 36.5% Renter occupiedHouse owners and renters - Other race residents 600 29.6% Owner occupied1,428 70.4% Renter occupiedHouse owners and renters - Two or more races residents 76 18.7% Owner occupied329 81.3% Renter occupiedHouse owners and renters - White alone residents 8 6.8% Owner occupied116 93.2% Renter occupiedHouse owners and renters - Hispanic or Latino residents 1,499 30.8% Owner occupied3,370 69.2% Renter occupied
Language usage in Westmont
English speakers - Total 46.2% of residents of Westmont speak English at home.
51.5% of residents speak Spanish at home 9,367 55.8% Speak English very well7,413 44.2% Speak English less than very well1.6% of residents speak other language at home 496 97.6% Speak English very well12 2.4% Speak English less than very well
English speakers - Born in the United States 94.4% of residents of Westmont speak English at home.
4.6% of residents speak Spanish at home 155 83.8% Speak English very well30 16.2% Speak English less than very well0.7% of residents speak other language at home 28 100.0% Speak English very well
English speakers - Native, born elsewhere 34.3% of residents of Westmont speak English at home.
62.2% of residents speak Spanish at home 56 52.3% Speak English very well51 47.7% Speak English less than very well4.1% of residents speak other language at home 7 100.0% Speak English very well
English speakers - Foreign-born 6.7% of residents of Westmont speak English at home.
87.4% of residents speak Spanish at home 2,547 29.1% Speak English very well6,194 70.9% Speak English less than very well3.0% of residents speak other language at home 292 96.1% Speak English very well12 3.9% Speak English less than very well
White (Caucasian) - Speak only English Native:
19.6% (941)Foreign-born:
1.7% (61)
White (Caucasian) - Speak another language Native:
63.5% (3,046)Foreign-born:
93.6% (3,341)
Black or African American - Speak only English Native:
95.4% (11,547)Foreign-born:
52.6% (474)
Black or African American - Speak another language Native:
4.4% (531)Foreign-born:
43.1% (389)
American Indian / Alaska Native - Speak only English Native:
69.7% (130)Foreign-born:
12.0% (19)
American Indian / Alaska Native - Speak another language Native:
29.6% (55)Foreign-born:
88.7% (137)
Asian - Speak another language Native:
96.1% (9)Foreign-born:
83.0% (63)
Other race - Speak only English Native:
13.9% (550)Foreign-born:
2.6% (102)
Other race - Speak another language Native:
83.5% (3,301)Foreign-born:
96.6% (3,861)
Two or more races - Speak another language Native:
39.0% (349)Foreign-born:
100.0% (214)
White alone - Speak only English Native:
91.5% (318)Foreign-born:
96.0% (37)
Hispanic or Latino - Speak only English Native:
15.4% (1,490)Foreign-born:
1.8% (156)
Hispanic or Latino - Speak another language Native:
82.3% (7,976)Foreign-born:
97.3% (8,545)
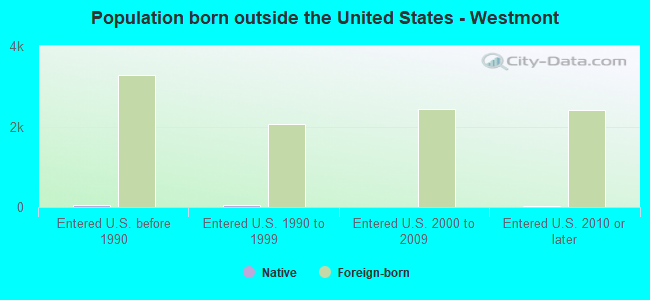
Foreign-born residents in Westmont 10,322 residents are foreign born (27.7% Latin America ).
This city:
29.3%California:
100.0%
Marital status for residents in Westmont Marital status - White (Caucasian) population 15 years and over
Males 48.8% Never married42.2% Now married1.7% Separated2.3% Widowed5.0% DivorcedFemales 50.8% Never married36.4% Now married4.1% Separated2.5% Widowed6.2% DivorcedWomen who gave birth in the past 12 months Now married:
50.4% (52)Unmarried:
49.6% (51)
Women who did not give birth in the past 12 months Now married:
38.7% (958)Unmarried:
61.3% (1,518)
Marital status - Black or African American population 15 years and over
Males 52.4% Never married23.8% Now married3.7% Separated3.4% Widowed16.7% DivorcedFemales 53.1% Never married15.4% Now married6.0% Separated11.0% Widowed14.5% DivorcedWomen who gave birth in the past 12 months Now married:
29.9% (59)Unmarried:
70.1% (139)
Women who did not give birth in the past 12 months Now married:
16.7% (565)Unmarried:
83.3% (2,821)
Marital status - American Indian / Alaska Native population 15 years and over
Males 57.4% Never married30.9% Now married0.0% Separated0.0% Widowed11.8% DivorcedFemales 13.2% Never married65.8% Now married0.0% Separated21.1% Widowed0.0% DivorcedWomen who did not give birth in the past 12 months Now married:
83.3% (73)Unmarried:
16.7% (15)
Marital status - Asian population 15 years and over
Males 55.0% Never married45.0% Now married0.0% Separated0.0% Widowed0.0% DivorcedFemales 2.3% Never married69.8% Now married0.0% Separated0.0% Widowed27.9% DivorcedWomen who gave birth in the past 12 months Now married:
100.0% (8)Unmarried:
0.0% (0)
Women who did not give birth in the past 12 months Now married:
50.0% (10)Unmarried:
50.0% (10)
Marital status - Other race population 15 years and over
Males 45.2% Never married48.9% Now married0.8% Separated2.2% Widowed2.9% DivorcedFemales 48.0% Never married39.8% Now married5.7% Separated3.0% Widowed3.4% DivorcedWomen who gave birth in the past 12 months Now married:
85.9% (85)Unmarried:
14.1% (14)
Women who did not give birth in the past 12 months Now married:
38.0% (901)Unmarried:
62.0% (1,469)
Marital status - Two or more races population 15 years and over
Males 41.6% Never married32.5% Now married0.0% Separated0.0% Widowed26.0% DivorcedFemales 59.4% Never married30.0% Now married0.0% Separated5.0% Widowed5.6% DivorcedWomen who gave birth in the past 12 months Now married:
0.0% (0)Unmarried:
100.0% (32)
Women who did not give birth in the past 12 months Now married:
41.6% (109)Unmarried:
58.4% (153)
Marital status - White alone, not Hispanic / Latino population 15 years and over
Males 74.2% Never married17.7% Now married0.0% Separated0.0% Widowed8.1% DivorcedFemales 66.5% Never married21.7% Now married8.5% Separated2.4% Widowed0.9% DivorcedWomen who gave birth in the past 12 months Now married:
0.0% (0)Unmarried:
100.0% (8)
Women who did not give birth in the past 12 months Now married:
28.2% (40)Unmarried:
71.8% (102)
Marital status - Hispanic or Latino population 15 years and over
Males 47.5% Never married44.5% Now married1.3% Separated2.3% Widowed4.4% DivorcedFemales 48.9% Never married38.2% Now married4.7% Separated2.7% Widowed5.5% DivorcedWomen who gave birth in the past 12 months Now married:
67.8% (145)Unmarried:
32.2% (69)
Women who did not give birth in the past 12 months Now married:
39.4% (2,103)Unmarried:
60.6% (3,229)
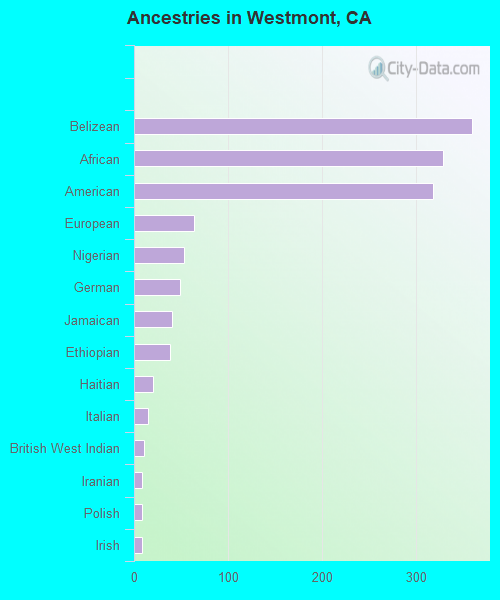
Ancestries in Westmont
533 2.0% African394 1.5% American276 1.0% Belizean140 0.5% Nigerian79 0.3% Jamaican23 0.08% British West Indian19 0.07% English13 0.05% European12 0.04% Iranian6 0.02% Greek3 0.01% Australian
Children Nativity (place of birth) in Westmont
Children under 6 years - Living with two parents Both parents native 273 100.0% NativeBoth parents foreign-born 361 100.0% NativeOne native, one foreign-born parent 451 100.0% NativeChildren under 6 years - Living with one parent Native parent 1,187 99.8% Native2 0.2% Foreign-bornForeign-born parent 540 86.6% Native83 13.4% Foreign-bornChildren 6 to 17 years - Living with two parents Both parents native 773 100.0% NativeBoth parents foreign-born 1,080 89.3% Native130 10.7% Foreign-bornOne native, one foreign-born parent 533 100.0% NativeChildren 6 to 17 years - Living with one parent Native parent 2,505 100.0% NativeForeign-born parent 1,391 54.5% Native1,163 45.5% Foreign-born
Grandparents responsible for own grandchildren in Westmont
Grandparents (30 to 59 years) White / Caucasian 42 21.4% Responsible for grandchildren153 78.6% Not responsible for grandchildrenBlack or African American 153 51.5% Responsible for grandchildren144 48.5% Not responsible for grandchildrenAmerican Indian / Alaska Native 6 100.0% Responsible for grandchildrenOther race 15 7.7% Responsible for grandchildren182 92.3% Not responsible for grandchildrenHispanic or Latino 86 17.5% Responsible for grandchildren404 82.5% Not responsible for grandchildrenGrandparents (60 years and over) White / Caucasian 24 11.6% Responsible for grandchildren187 88.4% Not responsible for grandchildrenBlack or African American 53 20.7% Responsible for grandchildren203 79.3% Not responsible for grandchildrenAmerican Indian / Alaska Native 29 100.0% Not responsible for grandchildrenOther race 21 10.7% Responsible for grandchildren171 89.3% Not responsible for grandchildrenHispanic or Latino 51 10.6% Responsible for grandchildren427 89.4% Not responsible for grandchildren