Races in White Oak, Ohio (OH) Detailed Stats
Data:
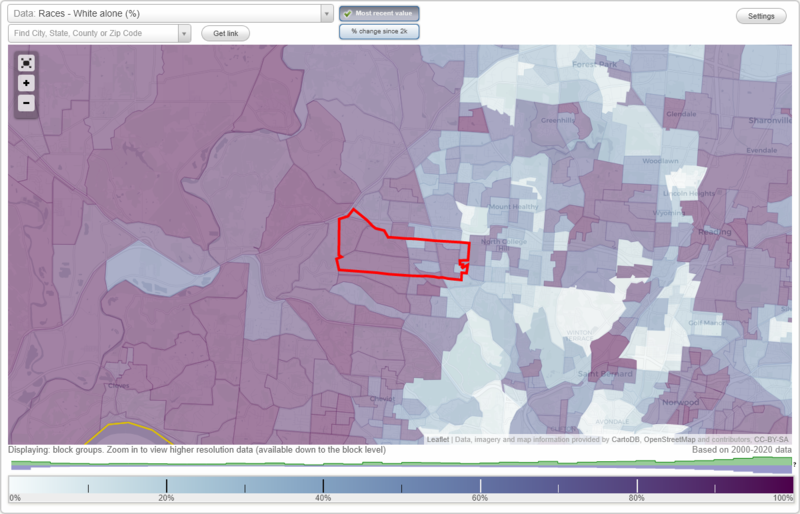
Races - White alone (%)
Races - White alone (% change since 2000)
Races - Black alone (%)
Races - Black alone (% change since 2000)
Races - American Indian alone (%)
Races - American Indian alone (% change since 2000)
Races - Asian alone (%)
Races - Asian alone (% change since 2000)
Races - Hispanic (%)
Races - Hispanic (% change since 2000)
Races - Native Hawaiian and Other Pacific Islander alone (%)
Races - Native Hawaiian and Other Pacific Islander alone (% change since 2000)
Races - Two or more races(%)
Races - Two or more races(% change since 2000)
Races - Other race alone (%)
Races - Other race alone (% change since 2000)
Racial diversity
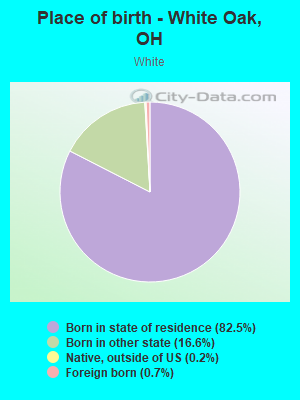
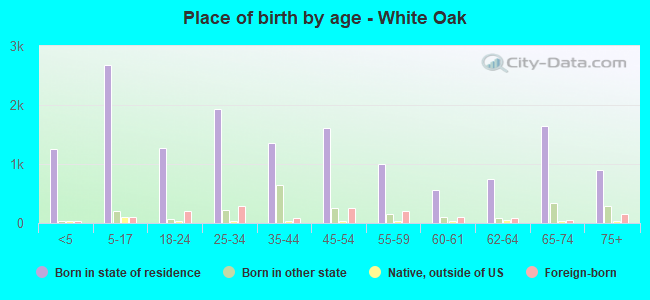
Place of birth - Born in state of residence (%)
Place of birth - Born in state of residence (%) - White
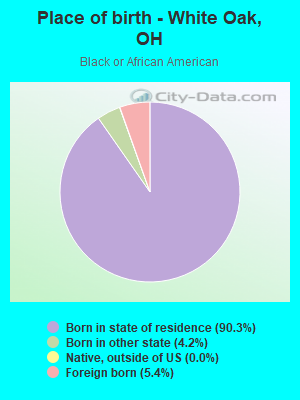
Place of birth - Born in state of residence (%) - Black or African American
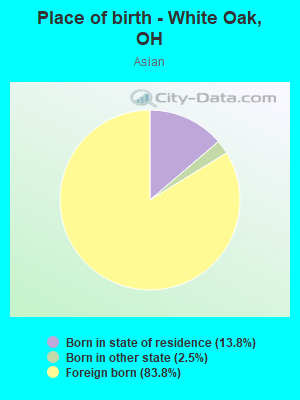
Place of birth - Born in state of residence (%) - Asian
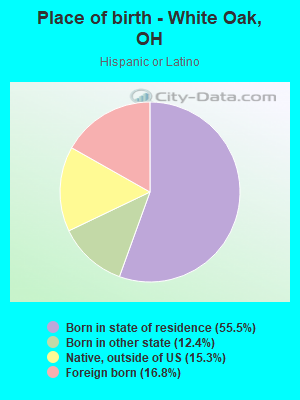
Place of birth - Born in state of residence (%) - Hispanic or Latino
Place of birth - Born in state of residence (%) - American Indian and Alaska Native
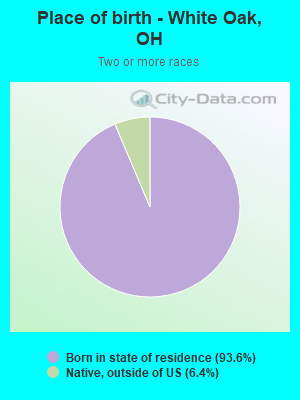
Place of birth - Born in state of residence (%) - Multirace
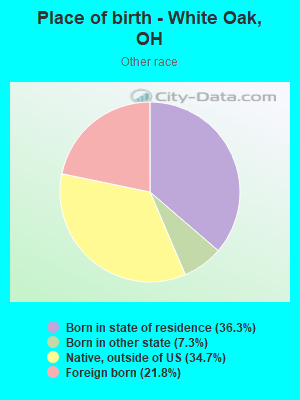
Place of birth - Born in state of residence (%) - Other Race
Place of birth - Born in other state (%)
Place of birth - Born in other state (%) - White
Place of birth - Born in other state (%) - Black or African American
Place of birth - Born in other state (%) - Asian
Place of birth - Born in other state (%) - Hispanic or Latino
Place of birth - Born in other state (%) - American Indian and Alaska Native
Place of birth - Born in other state (%) - Multirace
Place of birth - Born in other state (%) - Other Race
Place of birth - Native, outside of US (%)
Place of birth - Native, outside of US (%) - White
Place of birth - Native, outside of US (%) - Black or African American
Place of birth - Native, outside of US (%) - Asian
Place of birth - Native, outside of US (%) - Hispanic or Latino
Place of birth - Native, outside of US (%) - American Indian and Alaska Native
Place of birth - Native, outside of US (%) - Multirace
Place of birth - Native, outside of US (%) - Other Race
Place of birth - Foreign born (%)
Place of birth - Foreign born (%) - White
Place of birth - Foreign born (%) - Black or African American
Place of birth - Foreign born (%) - Asian
Place of birth - Foreign born (%) - Hispanic or Latino
Place of birth - Foreign born (%) - American Indian and Alaska Native
Place of birth - Foreign born (%) - Multirace
Place of birth - Foreign born (%) - Other Race
Residents speaking English at home (%)
Residents speaking English at home - Born in the United States (%)
Residents speaking English at home - Native, born elsewhere (%)
Residents speaking English at home - Foreign born (%)
Residents speaking Spanish at home (%)
Residents speaking Spanish at home - Born in the United States (%)
Residents speaking Spanish at home - Native, born elsewhere (%)
Residents speaking Spanish at home - Foreign born (%)
Residents speaking other language at home (%)
Residents speaking other language at home - Born in the United States (%)
Residents speaking other language at home - Native, born elsewhere (%)
Residents speaking other language at home - Foreign born (%)
Marital status - Never married (%)
Marital status - Now married (%)
Marital status - Separated (%)
Marital status - Widowed (%)
Marital status - Divorced (%)
Ancestries Reported - Arab (%)
Ancestries Reported - Czech (%)
Ancestries Reported - Danish (%)
Ancestries Reported - Dutch (%)
Ancestries Reported - English (%)
Ancestries Reported - French (%)
Ancestries Reported - French Canadian (%)
Ancestries Reported - German (%)
Ancestries Reported - Greek (%)
Ancestries Reported - Hungarian (%)
Ancestries Reported - Irish (%)
Ancestries Reported - Italian (%)
Ancestries Reported - Lithuanian (%)
Ancestries Reported - Norwegian (%)
Ancestries Reported - Polish (%)
Ancestries Reported - Portuguese (%)
Ancestries Reported - Russian (%)
Ancestries Reported - Scotch-Irish (%)
Ancestries Reported - Scottish (%)
Ancestries Reported - Slovak (%)
Ancestries Reported - Subsaharan African (%)
Ancestries Reported - Swedish (%)
Ancestries Reported - Swiss (%)
Ancestries Reported - Ukrainian (%)
Ancestries Reported - United States (%)
Ancestries Reported - Welsh (%)
Ancestries Reported - West Indian (%)
Ancestries Reported - Other (%)
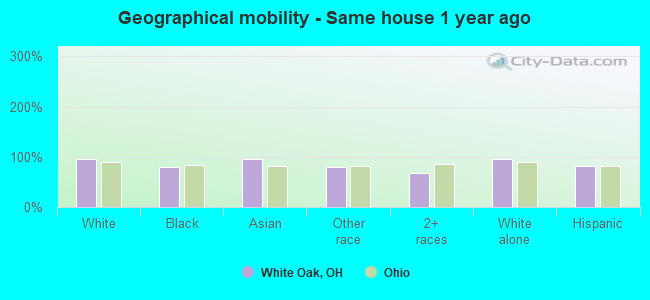
Geographical mobility - Same house 1 year ago (%)
Geographical mobility - Same house 1 year ago (%) - White
Geographical mobility - Same house 1 year ago (%) - Black or African American
Geographical mobility - Same house 1 year ago (%) - Asian
Geographical mobility - Same house 1 year ago (%) - Hispanic or Latino
Geographical mobility - Same house 1 year ago (%) - American Indian and Alaska Native
Geographical mobility - Same house 1 year ago (%) - Multirace
Geographical mobility - Same house 1 year ago (%) - Other Race
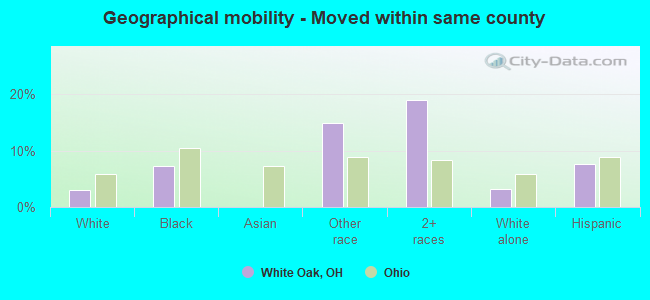
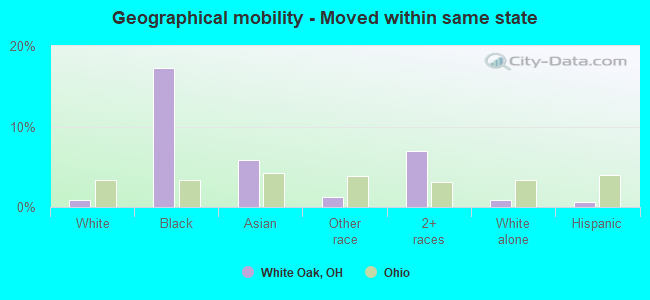
Geographical mobility - Moved within same county (%)
Geographical mobility - Moved within same county (%) - White
Geographical mobility - Moved within same county (%) - Black or African American
Geographical mobility - Moved within same county (%) - Asian
Geographical mobility - Moved within same county (%) - Hispanic or Latino
Geographical mobility - Moved within same county (%) - American Indian and Alaska Native
Geographical mobility - Moved within same county (%) - Multirace
Geographical mobility - Moved within same county (%) - Other Race
Geographical mobility - Moved from different county within same state (%)
Geographical mobility - Moved from different county within same state (%) - White
Geographical mobility - Moved from different county within same state (%) - Black or African American
Geographical mobility - Moved from different county within same state (%) - Asian
Geographical mobility - Moved from different county within same state (%) - Hispanic or Latino
Geographical mobility - Moved from different county within same state (%) - American Indian and Alaska Native
Geographical mobility - Moved from different county within same state (%) - Multirace
Geographical mobility - Moved from different county within same state (%) - Other Race
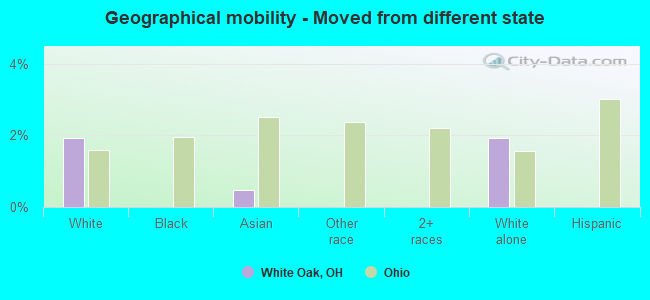
Geographical mobility - Moved from different state (%)
Geographical mobility - Moved from different state (%) - White
Geographical mobility - Moved from different state (%) - Black or African American
Geographical mobility - Moved from different state (%) - Asian
Geographical mobility - Moved from different state (%) - Hispanic or Latino
Geographical mobility - Moved from different state (%) - American Indian and Alaska Native
Geographical mobility - Moved from different state (%) - Multirace
Geographical mobility - Moved from different state (%) - Other Race
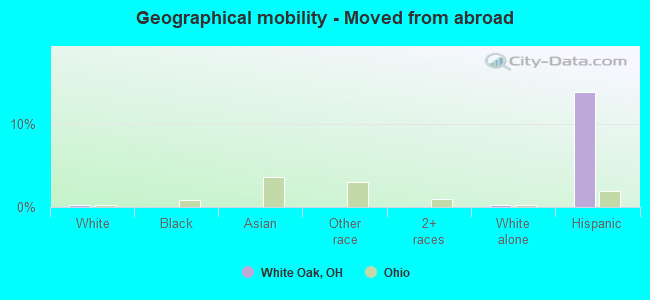
Geographical mobility - Moved from abroad (%)
Geographical mobility - Moved from abroad (%) - White
Geographical mobility - Moved from abroad (%) - Black or African American
Geographical mobility - Moved from abroad (%) - Asian
Geographical mobility - Moved from abroad (%) - Hispanic or Latino
Geographical mobility - Moved from abroad (%) - American Indian and Alaska Native
Geographical mobility - Moved from abroad (%) - Multirace
Geographical mobility - Moved from abroad (%) - Other Race
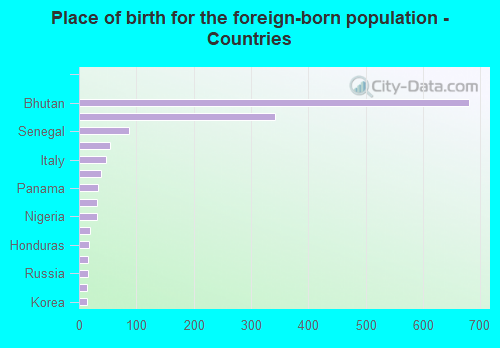
Place of birth for the foreign-born population - Ireland (%)
Place of birth for the foreign-born population - Denmark (%)
Place of birth for the foreign-born population - Norway (%)
Place of birth for the foreign-born population - Sweden (%)
Place of birth for the foreign-born population - United Kingdom (%)
Place of birth for the foreign-born population - England (%)
Place of birth for the foreign-born population - Scotland (%)
Place of birth for the foreign-born population - Other Northern Europe (%)
Place of birth for the foreign-born population - Austria (%)
Place of birth for the foreign-born population - Belgium (%)
Place of birth for the foreign-born population - France (%)
Place of birth for the foreign-born population - Germany (%)
Place of birth for the foreign-born population - Netherlands (%)
Place of birth for the foreign-born population - Switzerland (%)
Place of birth for the foreign-born population - Other Western Europe (%)
Place of birth for the foreign-born population - Greece (%)
Place of birth for the foreign-born population - Italy (%)
Place of birth for the foreign-born population - Portugal (%)
Place of birth for the foreign-born population - Spain (%)
Place of birth for the foreign-born population - Other Southern Europe (%)
Place of birth for the foreign-born population - Albania (%)
Place of birth for the foreign-born population - Belarus (%)
Place of birth for the foreign-born population - Bosnia and Herzegovina (%)
Place of birth for the foreign-born population - Bulgaria (%)
Place of birth for the foreign-born population - Croatia (%)
Place of birth for the foreign-born population - Czechoslovakia (%)
Place of birth for the foreign-born population - Hungary (%)
Place of birth for the foreign-born population - Latvia (%)
Place of birth for the foreign-born population - Lithuania (%)
Place of birth for the foreign-born population - North Macedonia (Macedonia) (%)
Place of birth for the foreign-born population - Moldova (%)
Place of birth for the foreign-born population - Poland (%)
Place of birth for the foreign-born population - Romania (%)
Place of birth for the foreign-born population - Russia (%)
Place of birth for the foreign-born population - Serbia (%)
Place of birth for the foreign-born population - Ukraine (%)
Place of birth for the foreign-born population - Other Eastern Europe (%)
Place of birth for the foreign-born population - China (%)
Place of birth for the foreign-born population - Hong Kong (%)
Place of birth for the foreign-born population - Taiwan (%)
Place of birth for the foreign-born population - Japan (%)
Place of birth for the foreign-born population - Korea (%)
Place of birth for the foreign-born population - Other Eastern Asia (%)
Place of birth for the foreign-born population - Afghanistan (%)
Place of birth for the foreign-born population - Bangladesh (%)
Place of birth for the foreign-born population - India (%)
Place of birth for the foreign-born population - Iran (%)
Place of birth for the foreign-born population - Kazakhstan (%)
Place of birth for the foreign-born population - Nepal (%)
Place of birth for the foreign-born population - Pakistan (%)
Place of birth for the foreign-born population - Sri Lanka (%)
Place of birth for the foreign-born population - Uzbekistan (%)
Place of birth for the foreign-born population - Other South Central Asia (%)
Place of birth for the foreign-born population - Burma (%)
Place of birth for the foreign-born population - Cambodia (%)
Place of birth for the foreign-born population - Indonesia (%)
Place of birth for the foreign-born population - Laos (%)
Place of birth for the foreign-born population - Malaysia (%)
Place of birth for the foreign-born population - Philippines (%)
Place of birth for the foreign-born population - Singapore (%)
Place of birth for the foreign-born population - Thailand (%)
Place of birth for the foreign-born population - Vietnam (%)
Place of birth for the foreign-born population - Other South Eastern Asia (%)
Place of birth for the foreign-born population - Armenia (%)
Place of birth for the foreign-born population - Iraq (%)
Place of birth for the foreign-born population - Israel (%)
Place of birth for the foreign-born population - Jordan (%)
Place of birth for the foreign-born population - Kuwait (%)
Place of birth for the foreign-born population - Lebanon (%)
Place of birth for the foreign-born population - Saudi Arabia (%)
Place of birth for the foreign-born population - Syria (%)
Place of birth for the foreign-born population - Turkey (%)
Place of birth for the foreign-born population - Yemen (%)
Place of birth for the foreign-born population - Other Western Asia (%)
Place of birth for the foreign-born population - Eritrea (%)
Place of birth for the foreign-born population - Ethiopia (%)
Place of birth for the foreign-born population - Kenya (%)
Place of birth for the foreign-born population - Somalia (%)
Place of birth for the foreign-born population - Uganda (%)
Place of birth for the foreign-born population - Zimbabwe (%)
Place of birth for the foreign-born population - Other Eastern Africa (%)
Place of birth for the foreign-born population - Cameroon (%)
Place of birth for the foreign-born population - Congo (%)
Place of birth for the foreign-born population - Democratic Republic of Congo (Zaire) (%)
Place of birth for the foreign-born population - Other Middle Africa (%)
Place of birth for the foreign-born population - Egypt (%)
Place of birth for the foreign-born population - Morocco (%)
Place of birth for the foreign-born population - Sudan (%)
Place of birth for the foreign-born population - Other Northern Africa (%)
Place of birth for the foreign-born population - South Africa (%)
Place of birth for the foreign-born population - Other Southern Africa (%)
Place of birth for the foreign-born population - Cabo Verde (%)
Place of birth for the foreign-born population - Ghana (%)
Place of birth for the foreign-born population - Liberia (%)
Place of birth for the foreign-born population - Nigeria (%)
Place of birth for the foreign-born population - Senegal (%)
Place of birth for the foreign-born population - Sierra Leone (%)
Place of birth for the foreign-born population - Other Western Africa (%)
Place of birth for the foreign-born population - Australia (%)
Place of birth for the foreign-born population - New Zealand (%)
Place of birth for the foreign-born population - Fiji (%)
Place of birth for the foreign-born population - Micronesia (%)
Place of birth for the foreign-born population - Bahamas (%)
Place of birth for the foreign-born population - Barbados (%)
Place of birth for the foreign-born population - Cuba (%)
Place of birth for the foreign-born population - Dominica (%)
Place of birth for the foreign-born population - Dominican Republic (%)
Place of birth for the foreign-born population - Grenada (%)
Place of birth for the foreign-born population - Haiti (%)
Place of birth for the foreign-born population - Jamaica (%)
Place of birth for the foreign-born population - St. Vincent and the Grenadines (%)
Place of birth for the foreign-born population - Trinidad and Tobago (%)
Place of birth for the foreign-born population - West Indies (%)
Place of birth for the foreign-born population - Other Caribbean (%)
Place of birth for the foreign-born population - Belize (%)
Place of birth for the foreign-born population - Costa Rica (%)
Place of birth for the foreign-born population - El Salvador (%)
Place of birth for the foreign-born population - Guatemala (%)
Place of birth for the foreign-born population - Honduras (%)
Place of birth for the foreign-born population - Mexico (%)
Place of birth for the foreign-born population - Nicaragua (%)
Place of birth for the foreign-born population - Panama (%)
Place of birth for the foreign-born population - Other Central America (%)
Place of birth for the foreign-born population - Argentina (%)
Place of birth for the foreign-born population - Bolivia (%)
Place of birth for the foreign-born population - Brazil (%)
Place of birth for the foreign-born population - Chile (%)
Place of birth for the foreign-born population - Colombia (%)
Place of birth for the foreign-born population - Ecuador (%)
Place of birth for the foreign-born population - Guyana (%)
Place of birth for the foreign-born population - Peru (%)
Place of birth for the foreign-born population - Uruguay (%)
Place of birth for the foreign-born population - Venezuela (%)
Place of birth for the foreign-born population - Other South America (%)
Place of birth for the foreign-born population - Canada (%)
Place of birth for the foreign-born population - Other Northern America (%)
Place of birth for the foreign-born population - Other (%)
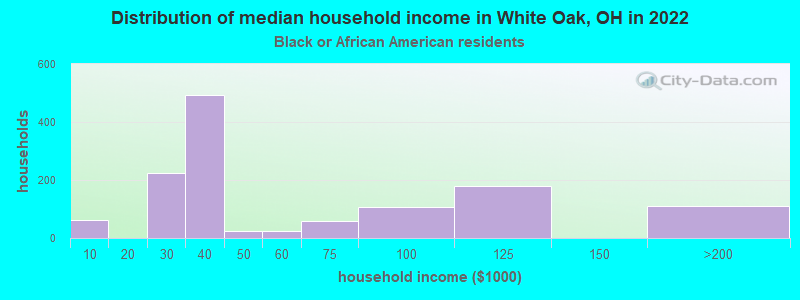
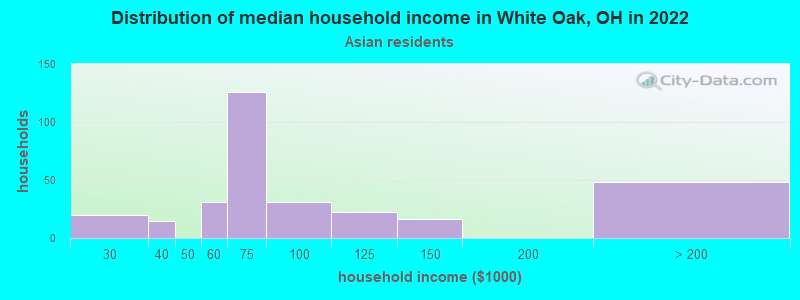
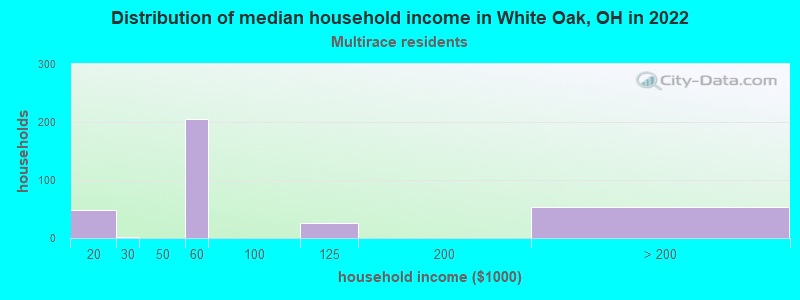
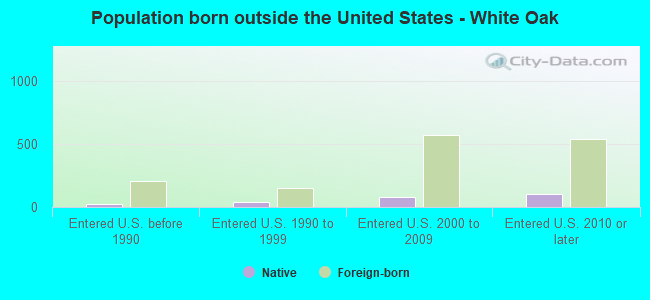
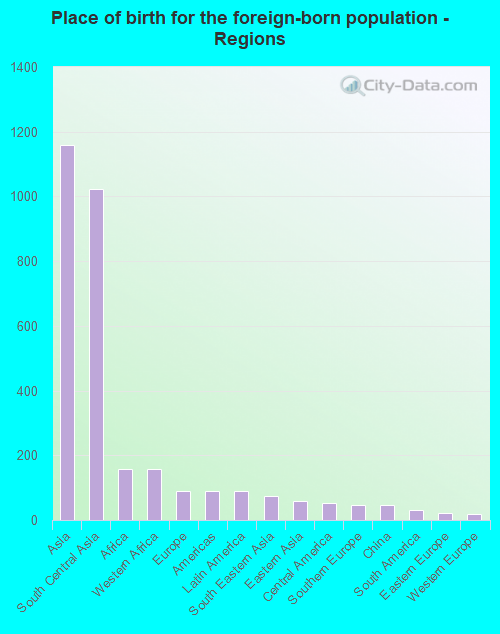
According to 2022 data, the most numerous races in White Oak, OH are White alone (13,121 residents), Black alone (2,603 residents), and Two or more races (1,303 residents). 90.4% of White Oak residents speak English at home. 7.9% of White Oak, OH residents are foreign-born (5.9% born in Asia, 0.8% born in Africa), which is 49.1% greater than the foreign-born rate of 4.0% across the entire state of Ohio.
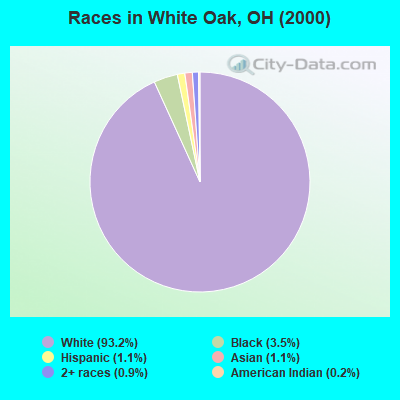
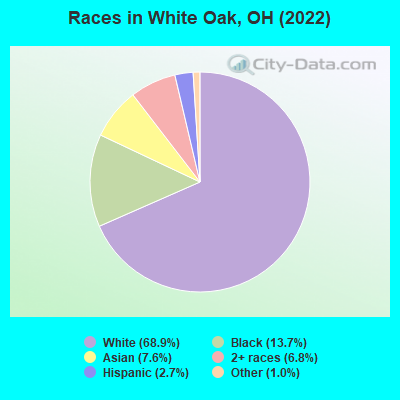
Race distribution in White Oak
2000 2022
9,538,111 84.0% White alone 1,290,662 11.4% Black alone 217,123 1.9% Hispanic 137,770 1.2% Two or more races 131,670 1.2% Asian alone 21,985 0.2% American Indian alone 13,483 0.1% Other race alone 2,336 0.02% Native Hawaiian and Other
8,948,793 76.1% White alone 1,401,403 11.9% Black alone 529,291 4.5% Two or more races 517,232 4.4% Hispanic 293,387 2.5% Asian alone 52,805 0.4% Other race alone 9,785 0.08% American Indian alone 3,362 0.03% Native Hawaiian and Other
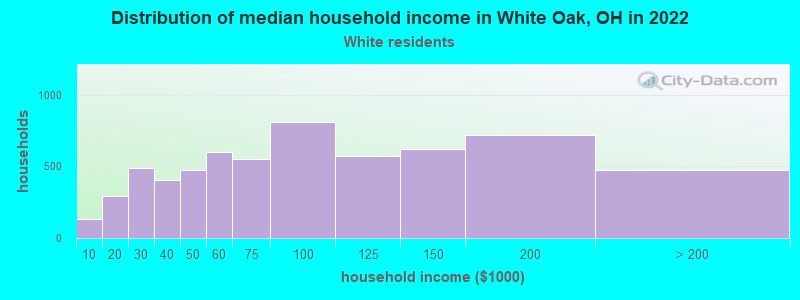
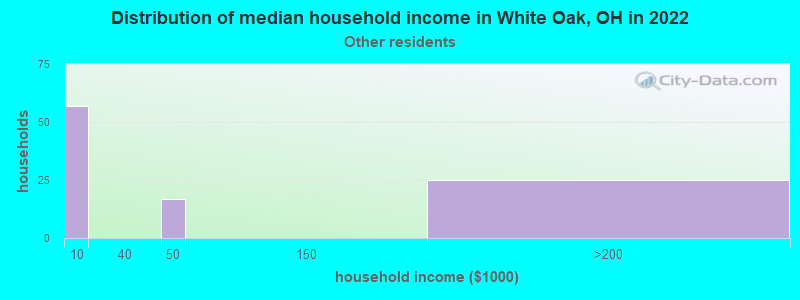
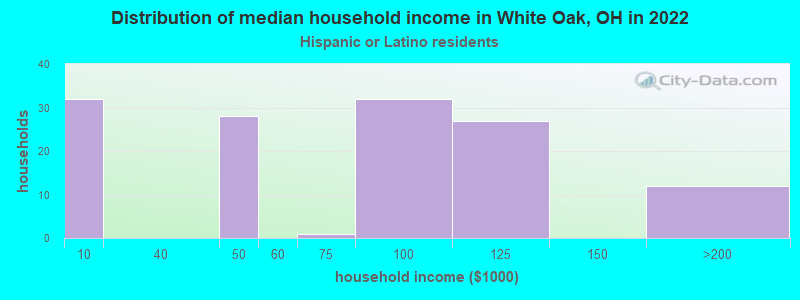
Income and house value in White Oak Median household income in 2022 $79,091 White non-Hispanic householders$34,362 Black householders$70,530 Asian householders$53,011 Two or more races householders$74,314 Hispanic or Latino race householdersMedian 2022 house value $206,109 White Non-Hispanic householders$181,992 Black or African American householders$208,707 American Indian or Alaska Native householders $228,000 Asian householders$208,707 Native Hawaiian and other Pacific Islander householders$219,467 Two or more races householders$208,707 Hispanic or Latino householders
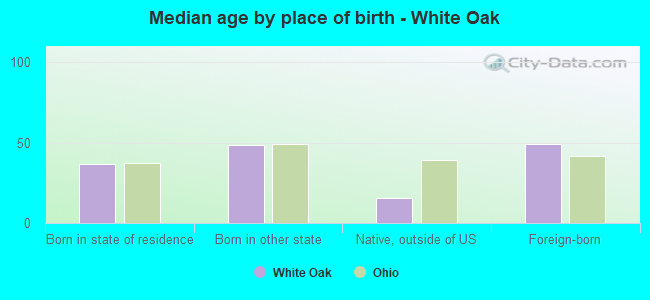
Median age by race in White Oak
47.7 Median age for White residents44.2 50.5 33.8 Median age for Black or African American residents15.0 37.2 -666,666,666.0 Median age for American Indian / Alaska Native residents-622,116,148.9 -871,212,120.3 30.0 Median age for Asian residents35.5 26.0 -800,387,596.1 Median age for Native Hawaiian / Pacific Islander residents-750,242,953.6 -805,394,989.6 9.7 Median age for Other race residents8.0 27.5 9.0 Median age for Two or more races residents15.5 3.5 47.1 Median age for White alone residents43.9 49.8 39.9 Median age for Hispanic or Latino residents14.6 48.6
Owner/renter occupied households by race in White Oak
House owners and renters - White residents 5,051 81.2% Owner occupied1,169 18.8% Renter occupiedHouse owners and renters - Black or African American residents 457 36.7% Owner occupied788 63.3% Renter occupiedHouse owners and renters - Asian residents 241 95.7% Owner occupied11 4.3% Renter occupiedHouse owners and renters - Other race residents 24 22.3% Owner occupied85 77.7% Renter occupiedHouse owners and renters - Two or more races residents 56 19.9% Owner occupied226 80.1% Renter occupiedHouse owners and renters - White alone residents 5,012 80.9% Owner occupied1,185 19.1% Renter occupiedHouse owners and renters - Hispanic or Latino residents 75 46.7% Owner occupied86 53.3% Renter occupied
Language usage in White Oak
English speakers - Total 90.4% of residents of White Oak speak English at home.
2.1% of residents speak Spanish at home 204 55.9% Speak English very well161 44.1% Speak English less than very well7.5% of residents speak other language at home 712 53.6% Speak English very well616 46.4% Speak English less than very well
English speakers - Born in the United States 96.9% of residents of White Oak speak English at home.
1.6% of residents speak Spanish at home 39 100.0% Speak English very well1.1% of residents speak other language at home 27 100.0% Speak English very well
English speakers - Native, born elsewhere 54.8% of residents of White Oak speak English at home.
26.2% of residents speak Spanish at home 13 22.4% Speak English very well45 77.6% Speak English less than very well
English speakers - Foreign-born 8.2% of residents of White Oak speak English at home.
8.0% of residents speak Spanish at home 61 51.3% Speak English very well58 48.7% Speak English less than very well78.5% of residents speak other language at home 645 55.5% Speak English very well517 44.5% Speak English less than very well
White (Caucasian) - Speak only English Native:
99.2% (12,427)Foreign-born:
30.6% (28)
White (Caucasian) - Speak another language Native:
0.8% (106)Foreign-born:
68.2% (63)
Black or African American - Speak only English Native:
100.0% (2,389)Foreign-born:
29.7% (42)
Black or African American - Speak another language Native:
0.0% (1)Foreign-born:
69.6% (98)
Asian - Speak only English Native:
37.2% (35)Foreign-born:
4.1% (53)
Asian - Speak another language Native:
55.2% (52)Foreign-born:
95.1% (1,218)
Other race - Speak another language Native:
55.5% (108)Foreign-born:
100.0% (79)
White alone - Speak only English Native:
99.0% (12,364)Foreign-born:
45.9% (30)
White alone - Speak another language Native:
1.0% (121)Foreign-born:
52.8% (35)
Hispanic or Latino - Speak another language Native:
48.1% (183)Foreign-born:
100.0% (88)
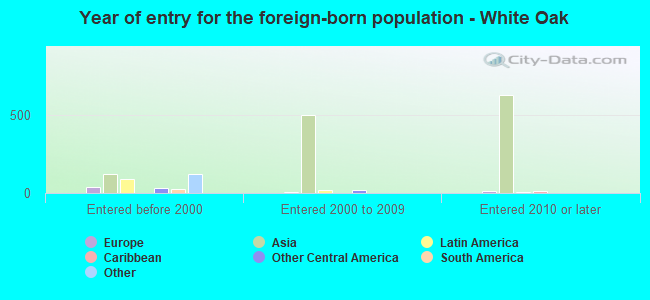
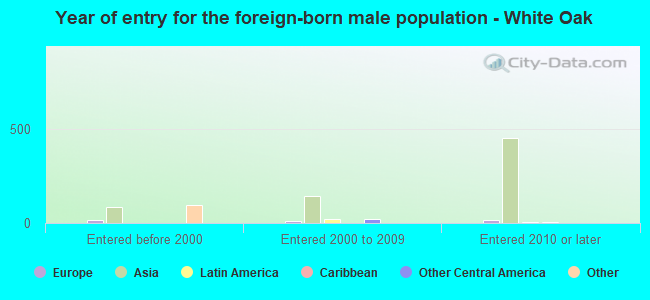
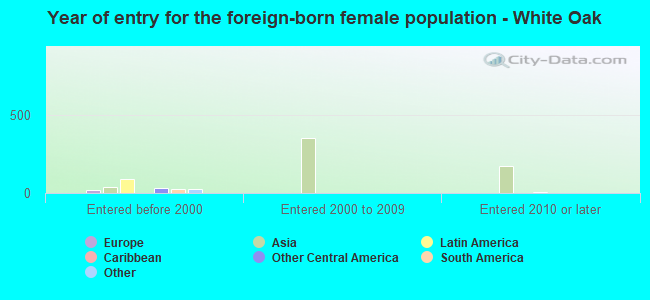
Foreign-born residents in White Oak 1,496 residents are foreign born (5.9% Asia , 0.8% Africa ).
Marital status for residents in White Oak Marital status - White (Caucasian) population 15 years and over
Males 32.9% Never married55.8% Now married0.1% Separated3.9% Widowed7.4% DivorcedFemales 22.1% Never married50.4% Now married0.3% Separated9.4% Widowed17.8% DivorcedWomen who gave birth in the past 12 months Now married:
79.2% (166)Unmarried:
20.8% (44)
Women who did not give birth in the past 12 months Now married:
44.3% (1,053)Unmarried:
55.7% (1,323)
Marital status - Black or African American population 15 years and over
Males 23.8% Never married47.1% Now married3.5% Separated0.0% Widowed25.6% DivorcedFemales 39.0% Never married30.8% Now married0.0% Separated3.2% Widowed27.0% DivorcedWomen who gave birth in the past 12 months Now married:
100.0% (129)Unmarried:
0.0% (0)
Women who did not give birth in the past 12 months Now married:
25.4% (168)Unmarried:
74.6% (493)
Marital status - Asian population 15 years and over
Males 23.7% Never married68.4% Now married0.0% Separated7.9% Widowed0.0% DivorcedFemales 30.4% Never married65.6% Now married0.0% Separated4.0% Widowed0.0% DivorcedWomen who gave birth in the past 12 months Now married:
100.0% (9)Unmarried:
0.0% (0)
Women who did not give birth in the past 12 months Now married:
42.0% (110)Unmarried:
58.0% (152)
Marital status - Other race population 15 years and over
Males 8.3% Never married91.7% Now married0.0% Separated0.0% Widowed0.0% DivorcedFemales 41.2% Never married27.5% Now married0.0% Separated31.4% Widowed0.0% DivorcedWomen who did not give birth in the past 12 months Now married:
22.2% (16)Unmarried:
77.8% (55)
Marital status - Two or more races population 15 years and over
Males 92.6% Never married7.4% Now married0.0% Separated0.0% Widowed0.0% DivorcedFemales 44.3% Never married26.4% Now married0.0% Separated10.9% Widowed18.4% DivorcedWomen who gave birth in the past 12 months Now married:
100.0% (4)Unmarried:
0.0% (0)
Women who did not give birth in the past 12 months Now married:
28.3% (55)Unmarried:
71.7% (140)
Marital status - White alone, not Hispanic / Latino population 15 years and over
Males 33.1% Never married56.2% Now married0.1% Separated3.6% Widowed7.1% DivorcedFemales 22.0% Never married50.2% Now married0.3% Separated9.5% Widowed18.0% DivorcedWomen who gave birth in the past 12 months Now married:
79.2% (168)Unmarried:
20.8% (44)
Women who did not give birth in the past 12 months Now married:
44.3% (1,062)Unmarried:
55.7% (1,334)
Marital status - Hispanic or Latino population 15 years and over
Males 44.2% Never married22.5% Now married0.0% Separated15.8% Widowed17.5% DivorcedFemales 23.8% Never married42.3% Now married0.0% Separated16.9% Widowed16.9% DivorcedWomen who did not give birth in the past 12 months Now married:
30.8% (27)Unmarried:
69.2% (60)
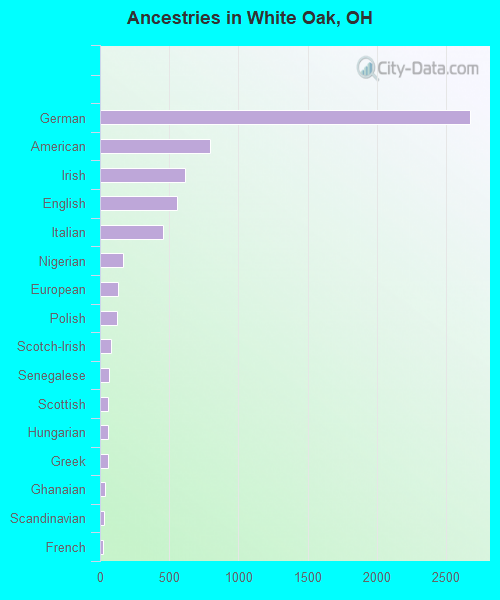
Ancestries in White Oak
2,678 28.0% German796 8.3% American618 6.5% Irish557 5.8% English452 4.7% Italian167 1.7% Nigerian127 1.3% European124 1.3% Polish76 0.8% Scotch-Irish68 0.7% Senegalese61 0.6% Scottish60 0.6% Hungarian58 0.6% Greek37 0.4% Ghanaian29 0.3% Scandinavian25 0.3% French16 0.2% Russian13 0.1% Dutch10 0.1% Alsatian4 0.04% Austrian4 0.04% Czechoslovakian2 0.02% British West Indian
Children Nativity (place of birth) in White Oak
Children under 6 years - Living with two parents Both parents native 1,068 100.0% NativeBoth parents foreign-born 94 100.0% NativeOne native, one foreign-born parent 47 100.0% NativeChildren under 6 years - Living with one parent Native parent 199 100.0% NativeForeign-born parent 25 100.0% NativeChildren 6 to 17 years - Living with two parents Both parents native 902 95.6% Native41 4.4% Foreign-bornBoth parents foreign-born 126 56.1% Native99 43.9% Foreign-bornOne native, one foreign-born parent 98 100.0% NativeChildren 6 to 17 years - Living with one parent Native parent 997 100.0% NativeForeign-born parent 91 43.3% Native119 56.7% Foreign-born
Grandparents responsible for own grandchildren in White Oak
Grandparents (30 to 59 years) White / Caucasian 17 55.8% Responsible for grandchildren13 44.2% Not responsible for grandchildrenBlack or African American 22 93.4% Responsible for grandchildren2 6.6% Not responsible for grandchildrenAsian 90 100.0% Not responsible for grandchildrenWhite alone, not Hispanic / Latino 12 45.4% Responsible for grandchildren14 54.6% Not responsible for grandchildrenGrandparents (60 years and over) White / Caucasian 129 49.8% Responsible for grandchildren130 50.2% Not responsible for grandchildrenBlack or African American 17 100.0% Responsible for grandchildrenAsian 18 100.0% Not responsible for grandchildrenWhite alone, not Hispanic / Latino 129 49.6% Responsible for grandchildren131 50.4% Not responsible for grandchildren