Races in Whitman, Massachusetts (MA) Detailed Stats
Ancestries, Foreign-born residents, place of birth

Recent posts about races in Whitman, Massachusetts on our local forum with over 2,400,000 registered users:
 | Proposed new maps for Massachusetts House and Senate districts focus on strengthening minority communities (51 replies) |
| 2023 Real Estate Observations (5278 replies) |
| towns that offer the most jobs per dollar of house (58 replies) |
| 2022 Real Estate Observations (1122 replies) |
| Home Prices By Town for 2022 (190 replies) |
| 2021 Real Estate Observations (1729 replies) |
2.2% of Whitman, MA residents are foreign-born (1.2% born in Europe, 0.6% born in North America, 0.3% born in Asia), which is 711.3% less than the foreign-born rate of 18.0% across the entire state of Massachusetts.
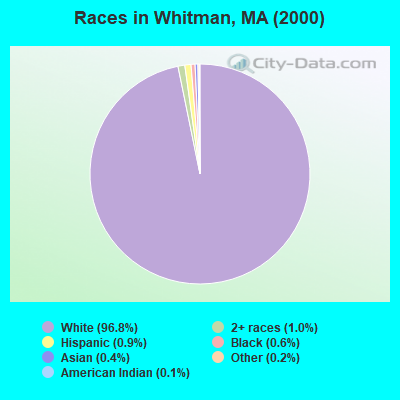
Race distribution in Whitman

- 13,43496.8%White alone
- 1391.0%Two or more races
- 1220.9%Hispanic
- 870.6%Black alone
- 580.4%Asian alone
- 250.2%Other race alone
- 160.1%American Indian alone
- 10.01%Native Hawaiian and Other
Pacific Islander alone
2000
2022
-
- 5,198,35981.9%White alone
- 428,7296.8%Hispanic
- 318,3295.0%Black alone
- 236,7863.7%Asian alone
- 110,3381.7%Two or more races
- 43,5860.7%Other race alone
- 11,2640.2%American Indian alone
- 1,7060.03%Native Hawaiian and Other
Pacific Islander alone

-
- 4,676,62767.0%White alone
- 911,03813.0%Hispanic
- 501,4637.2%Asian alone
- 459,7406.6%Black alone
- 341,8894.9%Two or more races
- 84,4031.2%Other race alone
- 5,8380.08%American Indian alone
- 9760.01%Native Hawaiian and Other
Pacific Islander alone

Income and house value in Whitman
- Median household income in 2022
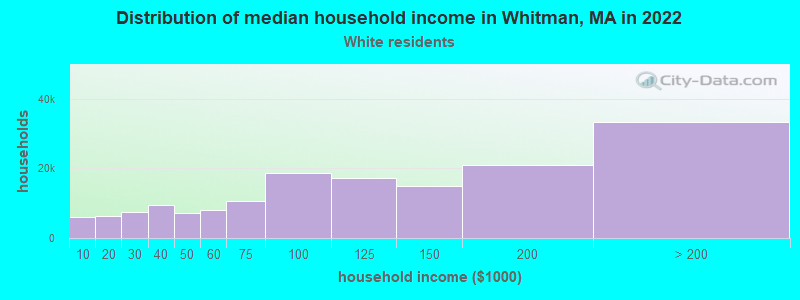
- $103,369White non-Hispanic householders
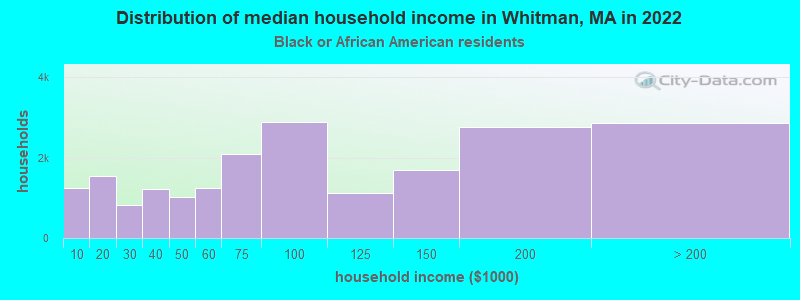
- $115,360Black householders
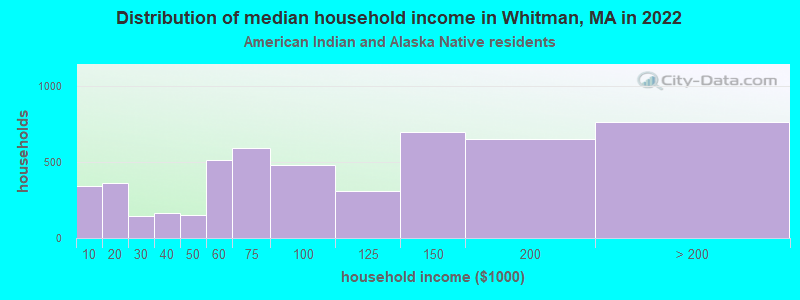
- $116,129American Indian and Alaska Native householders
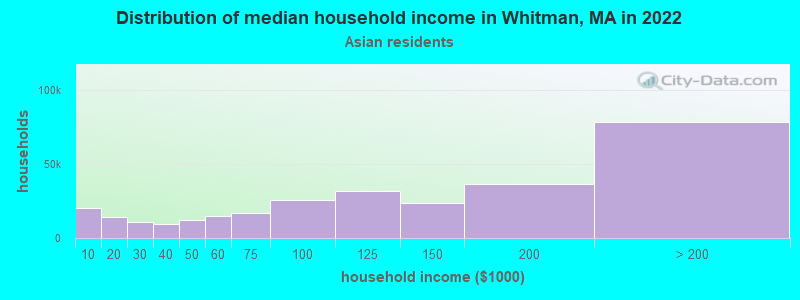
- $136,204Asian householders
- $92,351Some other race householders
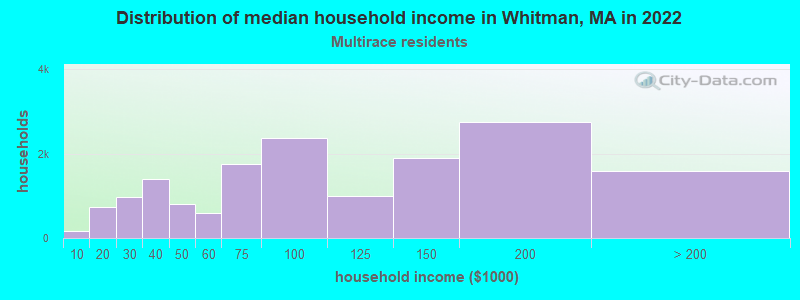
- $103,448Two or more races householders
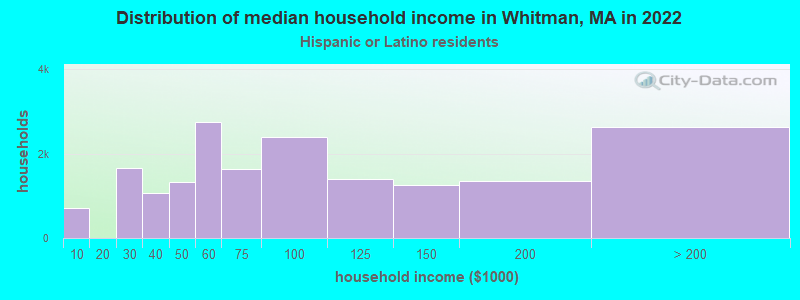
- $197,070Hispanic or Latino race householders
- Median 2022 house value
- $488,935White Non-Hispanic householders
- $350,351Black or African American householders
- $499,523Asian householders
- $856,415Some other race householders
- $441,910Two or more races householders
- $482,706Hispanic or Latino householders
Household income for White non-Hispanic householders
Household income for Black householders
Household income for American Indian and Alaska Native householders
Household income for Asian householders
Household income for Two or more races householders
Household income for Hispanic or Latino race householders
Foreign-born residents in Whitman
308 residents are foreign born (1.2% Europe, 0.6% North America, 0.3% Asia).
| This city: | 2.2% |
| Massachusetts: | 12.2% |
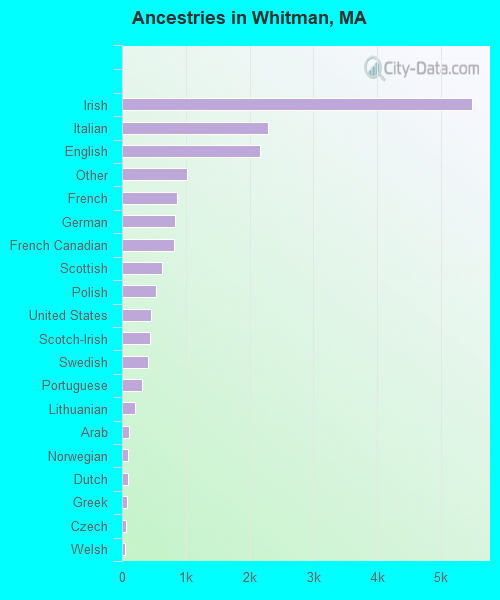
Ancestries in Whitman

- 5,48132.1%Irish
- 2,29313.4%Italian
- 2,17012.7%English
- 1,0166.0%Other
- 8585.0%French
- 8304.9%German
- 8154.8%French Canadian
- 6213.6%Scottish
- 5323.1%Polish
- 4592.7%United States
- 4372.6%Scotch-Irish
- 4062.4%Swedish
- 3171.9%Portuguese
- 2001.2%Lithuanian
- 1090.6%Arab
- 960.6%Norwegian
- 930.5%Dutch
- 750.4%Greek
- 550.3%Czech
- 500.3%Welsh
- 400.2%Subsaharan African
- 370.2%Danish
- 170.10%Russian
- 170.10%West Indian
- 160.09%Hungarian
- 120.07%Slovak
Zip codes: 02382.