Races in Wichita Falls, Texas (TX) Detailed Stats
Data:
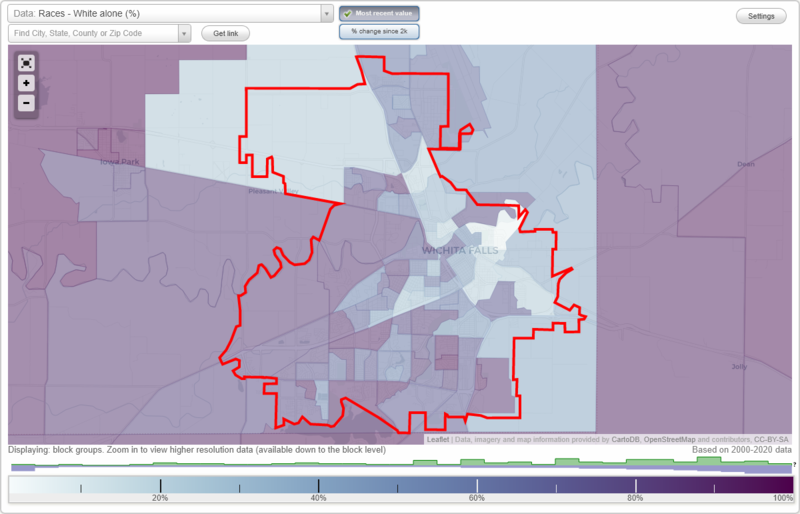
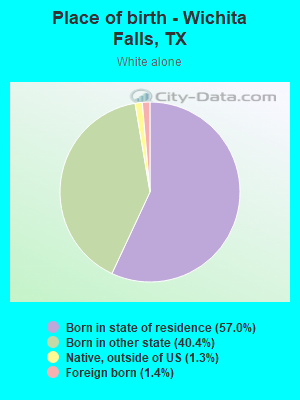
Races - White alone (%)
Races - White alone (% change since 2000)
Races - Black alone (%)
Races - Black alone (% change since 2000)
Races - American Indian alone (%)
Races - American Indian alone (% change since 2000)
Races - Asian alone (%)
Races - Asian alone (% change since 2000)
Races - Hispanic (%)
Races - Hispanic (% change since 2000)
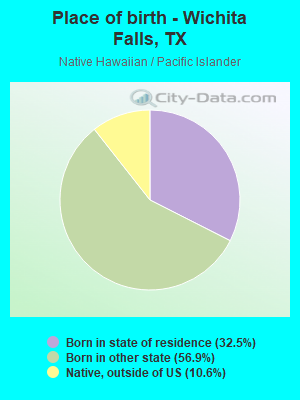
Races - Native Hawaiian and Other Pacific Islander alone (%)
Races - Native Hawaiian and Other Pacific Islander alone (% change since 2000)
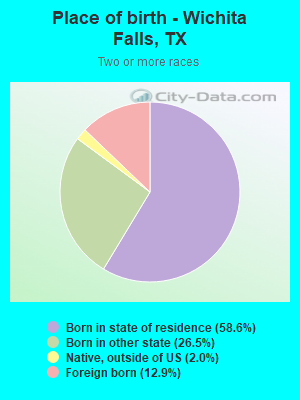
Races - Two or more races(%)
Races - Two or more races(% change since 2000)
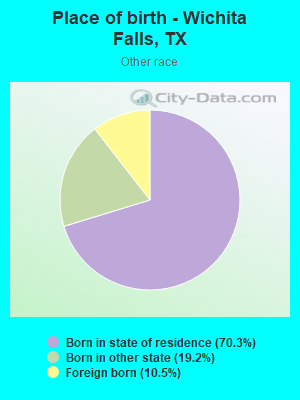
Races - Other race alone (%)
Races - Other race alone (% change since 2000)
Racial diversity
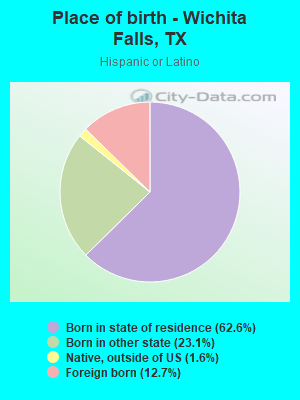
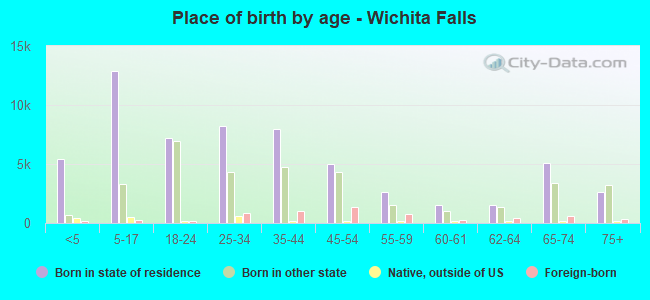
Place of birth - Born in state of residence (%)
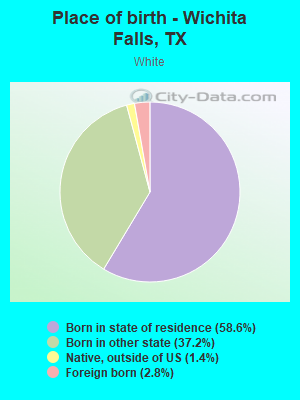
Place of birth - Born in state of residence (%) - White
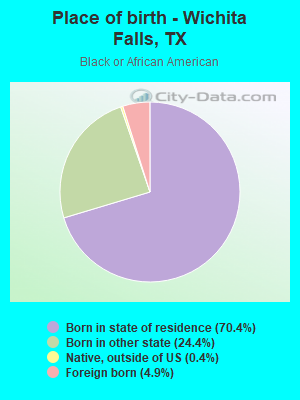
Place of birth - Born in state of residence (%) - Black or African American
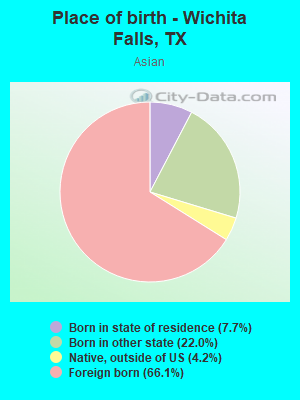
Place of birth - Born in state of residence (%) - Asian
Place of birth - Born in state of residence (%) - Hispanic or Latino
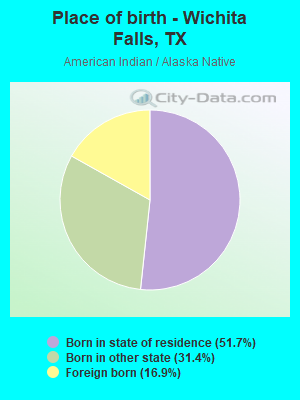
Place of birth - Born in state of residence (%) - American Indian and Alaska Native
Place of birth - Born in state of residence (%) - Multirace
Place of birth - Born in state of residence (%) - Other Race
Place of birth - Born in other state (%)
Place of birth - Born in other state (%) - White
Place of birth - Born in other state (%) - Black or African American
Place of birth - Born in other state (%) - Asian
Place of birth - Born in other state (%) - Hispanic or Latino
Place of birth - Born in other state (%) - American Indian and Alaska Native
Place of birth - Born in other state (%) - Multirace
Place of birth - Born in other state (%) - Other Race
Place of birth - Native, outside of US (%)
Place of birth - Native, outside of US (%) - White
Place of birth - Native, outside of US (%) - Black or African American
Place of birth - Native, outside of US (%) - Asian
Place of birth - Native, outside of US (%) - Hispanic or Latino
Place of birth - Native, outside of US (%) - American Indian and Alaska Native
Place of birth - Native, outside of US (%) - Multirace
Place of birth - Native, outside of US (%) - Other Race
Place of birth - Foreign born (%)
Place of birth - Foreign born (%) - White
Place of birth - Foreign born (%) - Black or African American
Place of birth - Foreign born (%) - Asian
Place of birth - Foreign born (%) - Hispanic or Latino
Place of birth - Foreign born (%) - American Indian and Alaska Native
Place of birth - Foreign born (%) - Multirace
Place of birth - Foreign born (%) - Other Race
Residents speaking English at home (%)
Residents speaking English at home - Born in the United States (%)
Residents speaking English at home - Native, born elsewhere (%)
Residents speaking English at home - Foreign born (%)
Residents speaking Spanish at home (%)
Residents speaking Spanish at home - Born in the United States (%)
Residents speaking Spanish at home - Native, born elsewhere (%)
Residents speaking Spanish at home - Foreign born (%)
Residents speaking other language at home (%)
Residents speaking other language at home - Born in the United States (%)
Residents speaking other language at home - Native, born elsewhere (%)
Residents speaking other language at home - Foreign born (%)
Marital status - Never married (%)
Marital status - Now married (%)
Marital status - Separated (%)
Marital status - Widowed (%)
Marital status - Divorced (%)
Ancestries Reported - Arab (%)
Ancestries Reported - Czech (%)
Ancestries Reported - Danish (%)
Ancestries Reported - Dutch (%)
Ancestries Reported - English (%)
Ancestries Reported - French (%)
Ancestries Reported - French Canadian (%)
Ancestries Reported - German (%)
Ancestries Reported - Greek (%)
Ancestries Reported - Hungarian (%)
Ancestries Reported - Irish (%)
Ancestries Reported - Italian (%)
Ancestries Reported - Lithuanian (%)
Ancestries Reported - Norwegian (%)
Ancestries Reported - Polish (%)
Ancestries Reported - Portuguese (%)
Ancestries Reported - Russian (%)
Ancestries Reported - Scotch-Irish (%)
Ancestries Reported - Scottish (%)
Ancestries Reported - Slovak (%)
Ancestries Reported - Subsaharan African (%)
Ancestries Reported - Swedish (%)
Ancestries Reported - Swiss (%)
Ancestries Reported - Ukrainian (%)
Ancestries Reported - United States (%)
Ancestries Reported - Welsh (%)
Ancestries Reported - West Indian (%)
Ancestries Reported - Other (%)
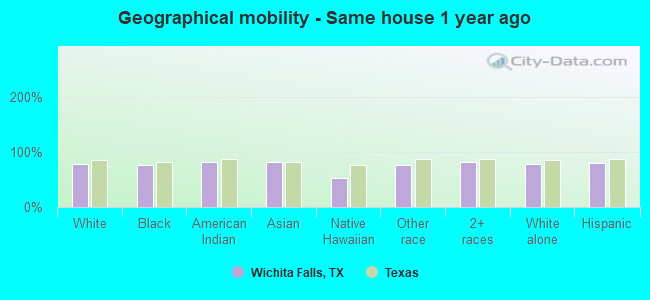
Geographical mobility - Same house 1 year ago (%)
Geographical mobility - Same house 1 year ago (%) - White
Geographical mobility - Same house 1 year ago (%) - Black or African American
Geographical mobility - Same house 1 year ago (%) - Asian
Geographical mobility - Same house 1 year ago (%) - Hispanic or Latino
Geographical mobility - Same house 1 year ago (%) - American Indian and Alaska Native
Geographical mobility - Same house 1 year ago (%) - Multirace
Geographical mobility - Same house 1 year ago (%) - Other Race
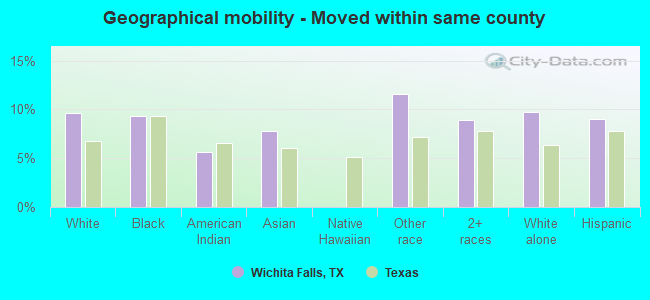
Geographical mobility - Moved within same county (%)
Geographical mobility - Moved within same county (%) - White
Geographical mobility - Moved within same county (%) - Black or African American
Geographical mobility - Moved within same county (%) - Asian
Geographical mobility - Moved within same county (%) - Hispanic or Latino
Geographical mobility - Moved within same county (%) - American Indian and Alaska Native
Geographical mobility - Moved within same county (%) - Multirace
Geographical mobility - Moved within same county (%) - Other Race
Geographical mobility - Moved from different county within same state (%)
Geographical mobility - Moved from different county within same state (%) - White
Geographical mobility - Moved from different county within same state (%) - Black or African American
Geographical mobility - Moved from different county within same state (%) - Asian
Geographical mobility - Moved from different county within same state (%) - Hispanic or Latino
Geographical mobility - Moved from different county within same state (%) - American Indian and Alaska Native
Geographical mobility - Moved from different county within same state (%) - Multirace
Geographical mobility - Moved from different county within same state (%) - Other Race
Geographical mobility - Moved from different state (%)
Geographical mobility - Moved from different state (%) - White
Geographical mobility - Moved from different state (%) - Black or African American
Geographical mobility - Moved from different state (%) - Asian
Geographical mobility - Moved from different state (%) - Hispanic or Latino
Geographical mobility - Moved from different state (%) - American Indian and Alaska Native
Geographical mobility - Moved from different state (%) - Multirace
Geographical mobility - Moved from different state (%) - Other Race
Geographical mobility - Moved from abroad (%)
Geographical mobility - Moved from abroad (%) - White
Geographical mobility - Moved from abroad (%) - Black or African American
Geographical mobility - Moved from abroad (%) - Asian
Geographical mobility - Moved from abroad (%) - Hispanic or Latino
Geographical mobility - Moved from abroad (%) - American Indian and Alaska Native
Geographical mobility - Moved from abroad (%) - Multirace
Geographical mobility - Moved from abroad (%) - Other Race
Place of birth for the foreign-born population - Ireland (%)
Place of birth for the foreign-born population - Denmark (%)
Place of birth for the foreign-born population - Norway (%)
Place of birth for the foreign-born population - Sweden (%)
Place of birth for the foreign-born population - United Kingdom (%)
Place of birth for the foreign-born population - England (%)
Place of birth for the foreign-born population - Scotland (%)
Place of birth for the foreign-born population - Other Northern Europe (%)
Place of birth for the foreign-born population - Austria (%)
Place of birth for the foreign-born population - Belgium (%)
Place of birth for the foreign-born population - France (%)
Place of birth for the foreign-born population - Germany (%)
Place of birth for the foreign-born population - Netherlands (%)
Place of birth for the foreign-born population - Switzerland (%)
Place of birth for the foreign-born population - Other Western Europe (%)
Place of birth for the foreign-born population - Greece (%)
Place of birth for the foreign-born population - Italy (%)
Place of birth for the foreign-born population - Portugal (%)
Place of birth for the foreign-born population - Spain (%)
Place of birth for the foreign-born population - Other Southern Europe (%)
Place of birth for the foreign-born population - Albania (%)
Place of birth for the foreign-born population - Belarus (%)
Place of birth for the foreign-born population - Bosnia and Herzegovina (%)
Place of birth for the foreign-born population - Bulgaria (%)
Place of birth for the foreign-born population - Croatia (%)
Place of birth for the foreign-born population - Czechoslovakia (%)
Place of birth for the foreign-born population - Hungary (%)
Place of birth for the foreign-born population - Latvia (%)
Place of birth for the foreign-born population - Lithuania (%)
Place of birth for the foreign-born population - North Macedonia (Macedonia) (%)
Place of birth for the foreign-born population - Moldova (%)
Place of birth for the foreign-born population - Poland (%)
Place of birth for the foreign-born population - Romania (%)
Place of birth for the foreign-born population - Russia (%)
Place of birth for the foreign-born population - Serbia (%)
Place of birth for the foreign-born population - Ukraine (%)
Place of birth for the foreign-born population - Other Eastern Europe (%)
Place of birth for the foreign-born population - China (%)
Place of birth for the foreign-born population - Hong Kong (%)
Place of birth for the foreign-born population - Taiwan (%)
Place of birth for the foreign-born population - Japan (%)
Place of birth for the foreign-born population - Korea (%)
Place of birth for the foreign-born population - Other Eastern Asia (%)
Place of birth for the foreign-born population - Afghanistan (%)
Place of birth for the foreign-born population - Bangladesh (%)
Place of birth for the foreign-born population - India (%)
Place of birth for the foreign-born population - Iran (%)
Place of birth for the foreign-born population - Kazakhstan (%)
Place of birth for the foreign-born population - Nepal (%)
Place of birth for the foreign-born population - Pakistan (%)
Place of birth for the foreign-born population - Sri Lanka (%)
Place of birth for the foreign-born population - Uzbekistan (%)
Place of birth for the foreign-born population - Other South Central Asia (%)
Place of birth for the foreign-born population - Burma (%)
Place of birth for the foreign-born population - Cambodia (%)
Place of birth for the foreign-born population - Indonesia (%)
Place of birth for the foreign-born population - Laos (%)
Place of birth for the foreign-born population - Malaysia (%)
Place of birth for the foreign-born population - Philippines (%)
Place of birth for the foreign-born population - Singapore (%)
Place of birth for the foreign-born population - Thailand (%)
Place of birth for the foreign-born population - Vietnam (%)
Place of birth for the foreign-born population - Other South Eastern Asia (%)
Place of birth for the foreign-born population - Armenia (%)
Place of birth for the foreign-born population - Iraq (%)
Place of birth for the foreign-born population - Israel (%)
Place of birth for the foreign-born population - Jordan (%)
Place of birth for the foreign-born population - Kuwait (%)
Place of birth for the foreign-born population - Lebanon (%)
Place of birth for the foreign-born population - Saudi Arabia (%)
Place of birth for the foreign-born population - Syria (%)
Place of birth for the foreign-born population - Turkey (%)
Place of birth for the foreign-born population - Yemen (%)
Place of birth for the foreign-born population - Other Western Asia (%)
Place of birth for the foreign-born population - Eritrea (%)
Place of birth for the foreign-born population - Ethiopia (%)
Place of birth for the foreign-born population - Kenya (%)
Place of birth for the foreign-born population - Somalia (%)
Place of birth for the foreign-born population - Uganda (%)
Place of birth for the foreign-born population - Zimbabwe (%)
Place of birth for the foreign-born population - Other Eastern Africa (%)
Place of birth for the foreign-born population - Cameroon (%)
Place of birth for the foreign-born population - Congo (%)
Place of birth for the foreign-born population - Democratic Republic of Congo (Zaire) (%)
Place of birth for the foreign-born population - Other Middle Africa (%)
Place of birth for the foreign-born population - Egypt (%)
Place of birth for the foreign-born population - Morocco (%)
Place of birth for the foreign-born population - Sudan (%)
Place of birth for the foreign-born population - Other Northern Africa (%)
Place of birth for the foreign-born population - South Africa (%)
Place of birth for the foreign-born population - Other Southern Africa (%)
Place of birth for the foreign-born population - Cabo Verde (%)
Place of birth for the foreign-born population - Ghana (%)
Place of birth for the foreign-born population - Liberia (%)
Place of birth for the foreign-born population - Nigeria (%)
Place of birth for the foreign-born population - Senegal (%)
Place of birth for the foreign-born population - Sierra Leone (%)
Place of birth for the foreign-born population - Other Western Africa (%)
Place of birth for the foreign-born population - Australia (%)
Place of birth for the foreign-born population - New Zealand (%)
Place of birth for the foreign-born population - Fiji (%)
Place of birth for the foreign-born population - Micronesia (%)
Place of birth for the foreign-born population - Bahamas (%)
Place of birth for the foreign-born population - Barbados (%)
Place of birth for the foreign-born population - Cuba (%)
Place of birth for the foreign-born population - Dominica (%)
Place of birth for the foreign-born population - Dominican Republic (%)
Place of birth for the foreign-born population - Grenada (%)
Place of birth for the foreign-born population - Haiti (%)
Place of birth for the foreign-born population - Jamaica (%)
Place of birth for the foreign-born population - St. Vincent and the Grenadines (%)
Place of birth for the foreign-born population - Trinidad and Tobago (%)
Place of birth for the foreign-born population - West Indies (%)
Place of birth for the foreign-born population - Other Caribbean (%)
Place of birth for the foreign-born population - Belize (%)
Place of birth for the foreign-born population - Costa Rica (%)
Place of birth for the foreign-born population - El Salvador (%)
Place of birth for the foreign-born population - Guatemala (%)
Place of birth for the foreign-born population - Honduras (%)
Place of birth for the foreign-born population - Mexico (%)
Place of birth for the foreign-born population - Nicaragua (%)
Place of birth for the foreign-born population - Panama (%)
Place of birth for the foreign-born population - Other Central America (%)
Place of birth for the foreign-born population - Argentina (%)
Place of birth for the foreign-born population - Bolivia (%)
Place of birth for the foreign-born population - Brazil (%)
Place of birth for the foreign-born population - Chile (%)
Place of birth for the foreign-born population - Colombia (%)
Place of birth for the foreign-born population - Ecuador (%)
Place of birth for the foreign-born population - Guyana (%)
Place of birth for the foreign-born population - Peru (%)
Place of birth for the foreign-born population - Uruguay (%)
Place of birth for the foreign-born population - Venezuela (%)
Place of birth for the foreign-born population - Other South America (%)
Place of birth for the foreign-born population - Canada (%)
Place of birth for the foreign-born population - Other Northern America (%)
Place of birth for the foreign-born population - Other (%)
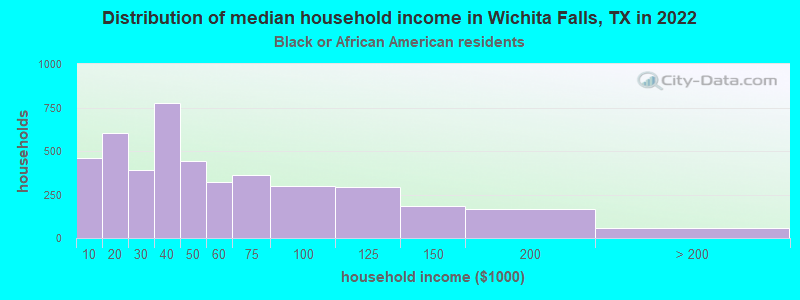
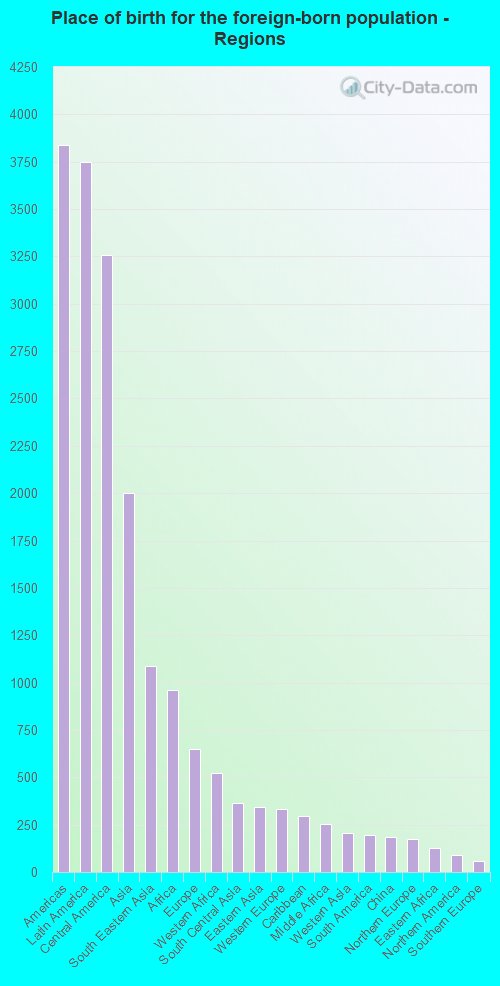
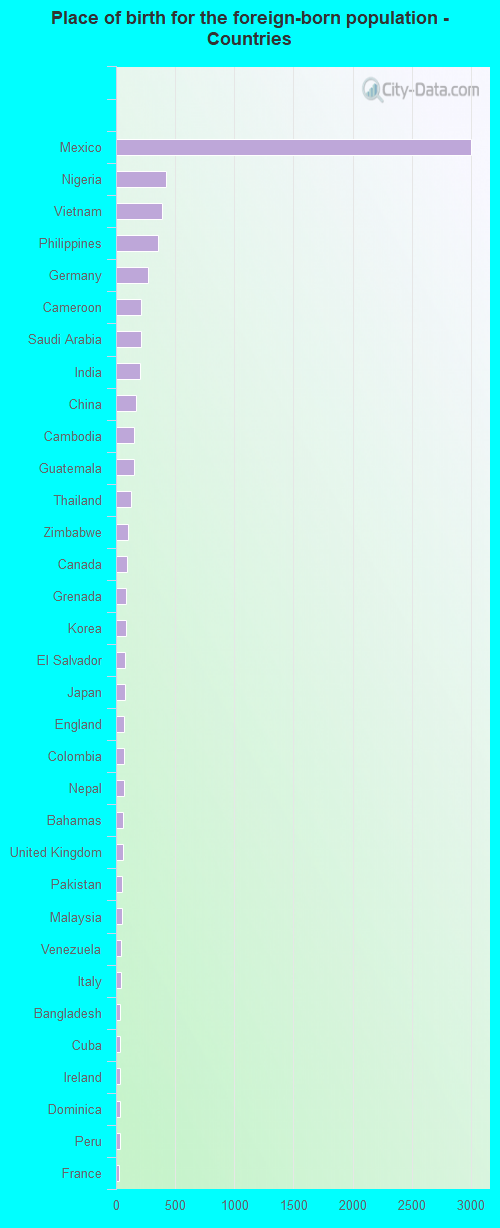
According to 2022 data, the most numerous races in Wichita Falls, TX are Hispanic (22,960 residents), White alone (60,554 residents), and Black alone (10,879 residents). 85.9% of Wichita Falls residents speak English at home. 7.3% of Wichita Falls, TX residents are foreign-born (3.5% born in Latin America, 1.9% born in Asia, 0.9% born in Africa), which is 133.5% less than the foreign-born rate of 17.0% across the entire state of Texas.
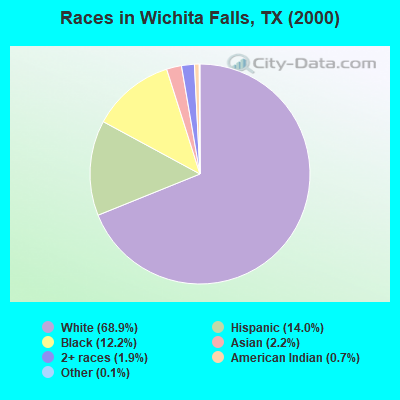
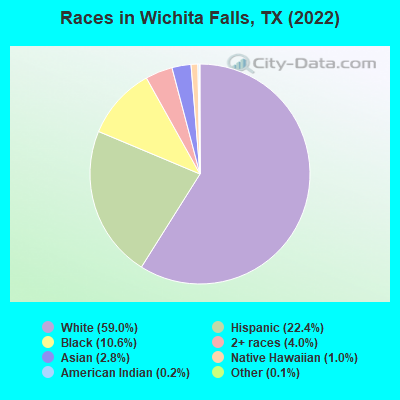
Race distribution in Wichita Falls
2000 2022
71,782 68.9% White alone 14,570 14.0% Hispanic 12,705 12.2% Black alone 2,256 2.2% Asian alone 1,970 1.9% Two or more races 696 0.7% American Indian alone 128 0.1% Other race alone 90 0.09% Native Hawaiian and Other
60,554 59.0% White alone 22,960 22.4% Hispanic 10,879 10.6% Black alone 4,096 4.0% Two or more races 2,829 2.8% Asian alone 1,012 1.0% Native Hawaiian and Other 215 0.2% American Indian alone 114 0.1% Other race alone
2000 2022
10,933,313 52.4% White alone 6,669,666 32.0% Hispanic 2,364,255 11.3% Black alone 554,445 2.7% Asian alone 230,567 1.1% Two or more races 68,859 0.3% American Indian alone 19,958 0.10% Other race alone 10,757 0.05% Native Hawaiian and Other
12,070,642 40.2% Hispanic 11,683,430 38.9% White alone 3,508,706 11.7% Black alone 1,608,173 5.4% Asian alone 956,560 3.2% Two or more races 125,763 0.4% Other race alone 47,023 0.2% American Indian alone 29,275 0.10% Native Hawaiian and Other
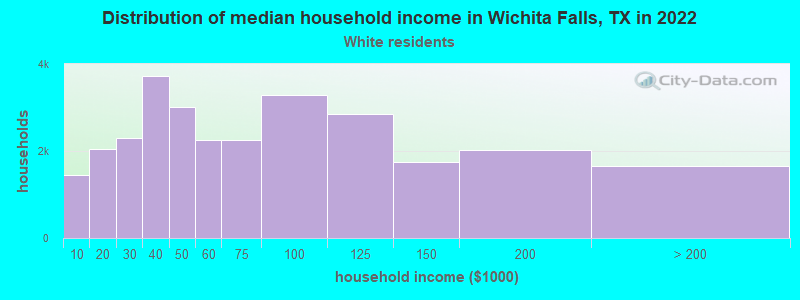
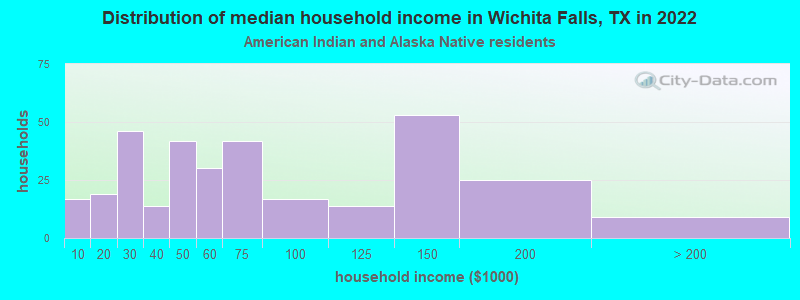
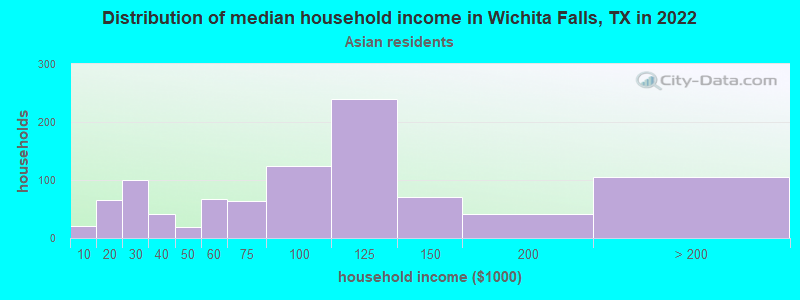
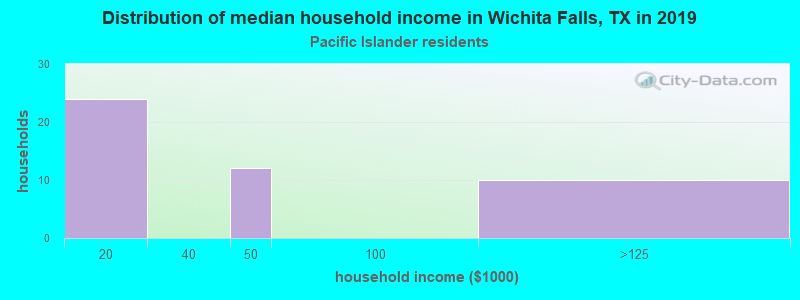
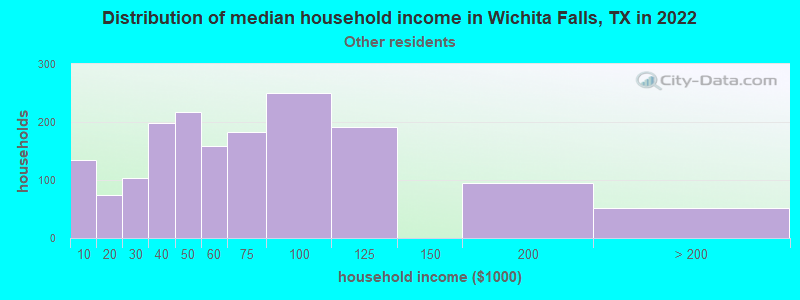
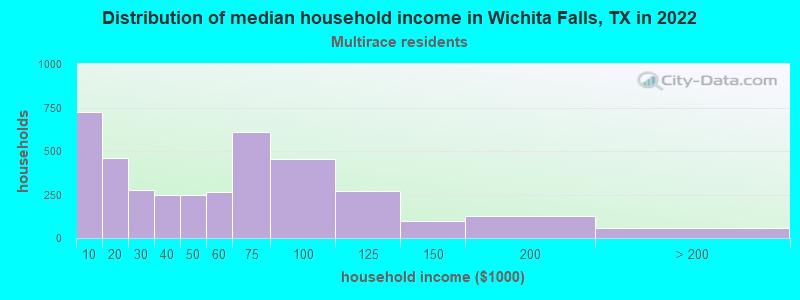
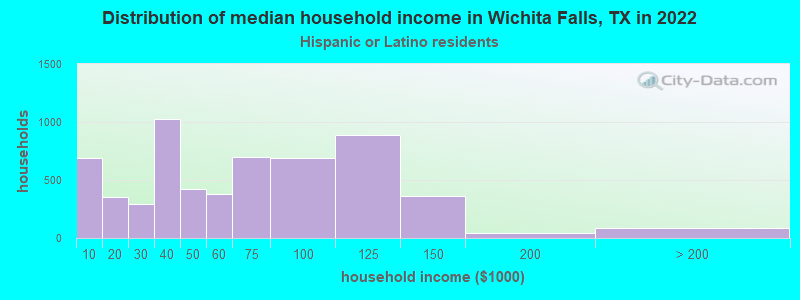
Income and house value in Wichita Falls Median household income in 2022 $58,708 White non-Hispanic householders$37,325 Black householders$55,407 American Indian and Alaska Native householders$86,213 Asian householders$65,180 Native Hawaiian and other Pacific Islander householders$69,600 Some other race householders$55,709 Two or more races householders$54,611 Hispanic or Latino race householdersMedian 2022 house value $167,237 White Non-Hispanic householders$95,843 Black or African American householders$131,785 American Indian or Alaska Native householders $139,364 Asian householders$78,728 Some other race householders$122,738 Two or more races householders$87,530 Hispanic or Latino householders
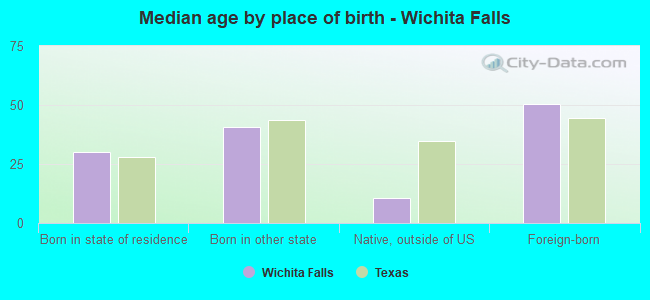
Median age by race in Wichita Falls
36.4 Median age for White residents33.9 39.1 37.2 Median age for Black or African American residents33.0 38.4 33.1 Median age for American Indian / Alaska Native residents33.0 45.9 44.1 Median age for Asian residents44.2 44.1 25.7 Median age for Native Hawaiian / Pacific Islander residents19.9 29.3 32.0 Median age for Other race residents31.8 36.3 21.6 Median age for Two or more races residents25.6 19.4 39.7 Median age for White alone residents37.9 40.8 26.3 Median age for Hispanic or Latino residents26.4 25.9
Owner/renter occupied households by race in Wichita Falls
House owners and renters - White residents 16,460 57.5% Owner occupied12,158 42.5% Renter occupiedHouse owners and renters - Black or African American residents 1,574 35.0% Owner occupied2,926 65.0% Renter occupiedHouse owners and renters - American Indian / Alaska Native residents 235 68.6% Owner occupied108 31.4% Renter occupiedHouse owners and renters - Asian residents 607 83.6% Owner occupied119 16.4% Renter occupiedHouse owners and renters - Native Hawaiian / Pacific Islander residents 25 30.5% Owner occupied56 69.5% Renter occupiedHouse owners and renters - Other race residents 658 60.1% Owner occupied437 39.9% Renter occupiedHouse owners and renters - Two or more races residents 1,245 55.5% Owner occupied1,000 44.5% Renter occupiedHouse owners and renters - White alone residents 14,728 58.9% Owner occupied10,270 41.1% Renter occupiedHouse owners and renters - Hispanic or Latino residents 3,201 54.1% Owner occupied2,716 45.9% Renter occupied
Language usage in Wichita Falls
English speakers - Total 85.9% of residents of Wichita Falls speak English at home.
11.2% of residents speak Spanish at home 8,437 78.7% Speak English very well2,290 21.3% Speak English less than very well3.0% of residents speak other language at home 1,989 70.0% Speak English very well851 30.0% Speak English less than very well
English speakers - Born in the United States 93.7% of residents of Wichita Falls speak English at home.
4.3% of residents speak Spanish at home 1,218 83.0% Speak English very well249 17.0% Speak English less than very well2.0% of residents speak other language at home 598 87.3% Speak English very well87 12.7% Speak English less than very well
English speakers - Native, born elsewhere 82.5% of residents of Wichita Falls speak English at home.
12.5% of residents speak Spanish at home 77 49.4% Speak English very well79 50.6% Speak English less than very well5.0% of residents speak other language at home 63 100.0% Speak English very well
English speakers - Foreign-born 22.4% of residents of Wichita Falls speak English at home.
44.5% of residents speak Spanish at home 1,026 37.7% Speak English very well1,695 62.3% Speak English less than very well33.1% of residents speak other language at home 1,263 62.3% Speak English very well764 37.7% Speak English less than very well
White (Caucasian) - Speak only English Native:
92.3% (62,656)Foreign-born:
16.3% (331)
White (Caucasian) - Speak another language Native:
7.7% (5,208)Foreign-born:
83.7% (1,705)
Black or African American - Speak only English Native:
98.6% (10,810)Foreign-born:
43.4% (509)
Black or African American - Speak another language Native:
1.4% (154)Foreign-born:
54.8% (642)
American Indian / Alaska Native - Speak only English Native:
57.3% (549)Foreign-born:
49.6% (64)
American Indian / Alaska Native - Speak another language Native:
40.4% (388)Foreign-born:
57.1% (74)
Asian - Speak only English Native:
64.7% (620)Foreign-born:
28.4% (531)
Asian - Speak another language Native:
35.3% (339)Foreign-born:
71.6% (1,339)
Other race - Speak only English Native:
56.5% (1,747)Foreign-born:
6.1% (24)
Other race - Speak another language Native:
43.5% (1,343)Foreign-born:
93.9% (369)
Two or more races - Speak only English Native:
75.1% (5,027)Foreign-born:
10.0% (120)
Two or more races - Speak another language Native:
24.9% (1,668)Foreign-born:
90.0% (1,086)
White alone - Speak only English Native:
99.1% (56,061)Foreign-born:
37.4% (307)
White alone - Speak another language Native:
0.9% (494)Foreign-born:
62.6% (513)
Hispanic or Latino - Speak only English Native:
57.8% (10,456)Foreign-born:
7.1% (206)
Hispanic or Latino - Speak another language Native:
42.2% (7,628)Foreign-born:
92.9% (2,704)
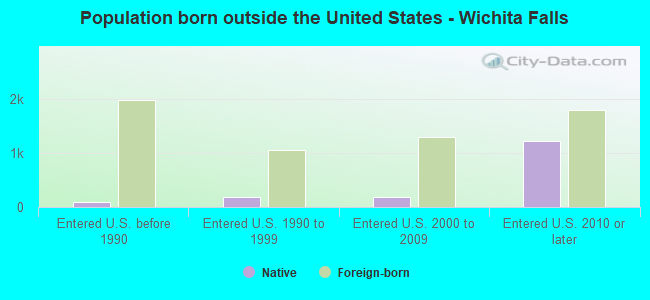
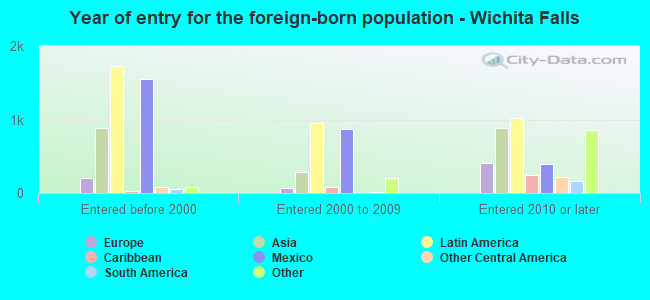
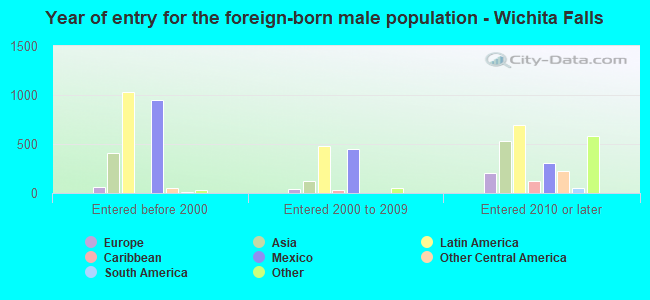
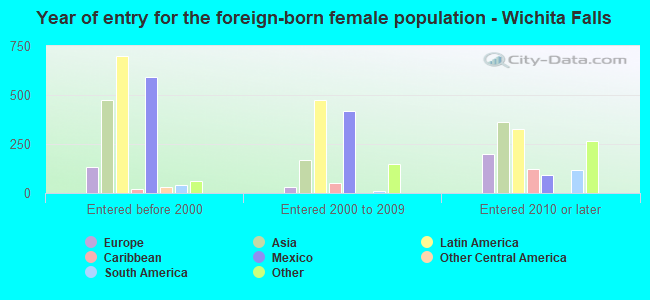
Foreign-born residents in Wichita Falls 7,483 residents are foreign born (3.5% Latin America , 1.9% Asia , 0.9% Africa ).
This city:
7.3%Texas:
17.1%
Marital status for residents in Wichita Falls Marital status - White (Caucasian) population 15 years and over
Males 44.0% Never married41.6% Now married1.6% Separated3.7% Widowed9.0% DivorcedFemales 25.6% Never married45.7% Now married2.9% Separated9.0% Widowed16.8% DivorcedWomen who gave birth in the past 12 months Now married:
63.9% (273)Unmarried:
36.1% (154)
Women who did not give birth in the past 12 months Now married:
39.8% (6,470)Unmarried:
60.2% (9,777)
Marital status - Black or African American population 15 years and over
Males 60.9% Never married27.6% Now married1.3% Separated1.8% Widowed8.3% DivorcedFemales 47.2% Never married21.4% Now married6.6% Separated5.9% Widowed18.9% DivorcedWomen who gave birth in the past 12 months Now married:
86.4% (38)Unmarried:
13.6% (6)
Women who did not give birth in the past 12 months Now married:
27.8% (845)Unmarried:
72.2% (2,197)
Marital status - American Indian / Alaska Native population 15 years and over
Males 40.4% Never married45.9% Now married0.0% Separated1.1% Widowed12.6% DivorcedFemales 41.3% Never married31.0% Now married5.7% Separated7.7% Widowed14.3% DivorcedWomen who did not give birth in the past 12 months Now married:
36.4% (109)Unmarried:
63.6% (191)
Marital status - Asian population 15 years and over
Males 44.7% Never married50.8% Now married0.0% Separated1.4% Widowed3.2% DivorcedFemales 27.2% Never married60.5% Now married1.0% Separated5.5% Widowed5.8% DivorcedWomen who did not give birth in the past 12 months Now married:
56.5% (432)Unmarried:
43.5% (333)
Marital status - Native Hawaiian / Pacific Islander population 15 years and over
Males 66.1% Never married20.3% Now married0.0% Separated13.6% Widowed0.0% DivorcedFemales 55.6% Never married38.1% Now married0.0% Separated0.0% Widowed6.3% DivorcedWomen who gave birth in the past 12 months Now married:
64.9% (29)Unmarried:
35.1% (16)
Women who did not give birth in the past 12 months Now married:
0.0% (0)Unmarried:
100.0% (13)
Marital status - Other race population 15 years and over
Males 51.3% Never married37.3% Now married0.5% Separated1.8% Widowed9.2% DivorcedFemales 35.9% Never married42.3% Now married2.5% Separated2.4% Widowed16.9% DivorcedWomen who gave birth in the past 12 months Now married:
48.7% (51)Unmarried:
51.3% (54)
Women who did not give birth in the past 12 months Now married:
47.2% (516)Unmarried:
52.8% (577)
Marital status - Two or more races population 15 years and over
Males 37.4% Never married42.9% Now married0.0% Separated8.3% Widowed11.3% DivorcedFemales 33.4% Never married42.3% Now married0.5% Separated6.1% Widowed17.7% DivorcedWomen who gave birth in the past 12 months Now married:
100.0% (71)Unmarried:
0.0% (0)
Women who did not give birth in the past 12 months Now married:
30.2% (575)Unmarried:
69.8% (1,329)
Marital status - White alone, not Hispanic / Latino population 15 years and over
Males 40.5% Never married45.1% Now married1.9% Separated3.0% Widowed9.5% DivorcedFemales 24.7% Never married48.2% Now married0.5% Separated9.3% Widowed17.3% DivorcedWomen who gave birth in the past 12 months Now married:
72.2% (273)Unmarried:
27.8% (105)
Women who did not give birth in the past 12 months Now married:
37.7% (4,854)Unmarried:
62.3% (8,009)
Marital status - Hispanic or Latino population 15 years and over
Males 53.4% Never married31.4% Now married0.0% Separated7.4% Widowed7.7% DivorcedFemales 30.6% Never married36.9% Now married11.4% Separated6.1% Widowed15.0% DivorcedWomen who gave birth in the past 12 months Now married:
24.5% (26)Unmarried:
75.5% (80)
Women who did not give birth in the past 12 months Now married:
43.4% (2,280)Unmarried:
56.6% (2,977)
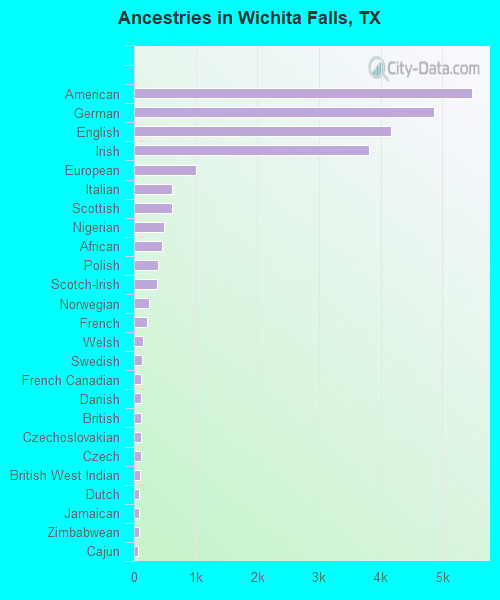
Ancestries in Wichita Falls
5,484 10.8% American4,870 9.6% German4,175 8.2% English3,819 7.5% Irish1,009 2.0% European611 1.2% Italian609 1.2% Scottish482 0.9% Nigerian450 0.9% African392 0.8% Polish381 0.7% Scotch-Irish250 0.5% Norwegian206 0.4% French143 0.3% Welsh137 0.3% Swedish121 0.2% French Canadian117 0.2% Danish113 0.2% British111 0.2% Czechoslovakian106 0.2% Czech103 0.2% British West Indian87 0.2% Dutch77 0.2% Jamaican77 0.2% Zimbabwean72 0.1% Cajun60 0.1% Portuguese49 0.10% Scandinavian48 0.09% Lebanese48 0.09% Greek29 0.06% Slavic26 0.05% Bahamian24 0.05% Canadian24 0.05% Lithuanian23 0.05% West Indian23 0.05% Ghanaian20 0.04% Eastern European17 0.03% Serbian16 0.03% Swiss15 0.03% Assyrian13 0.03% Northern European13 0.03% Austrian12 0.02% Russian12 0.02% Brazilian12 0.02% Belgian10 0.02% Finnish10 0.02% Romanian10 0.02% Yugoslavian8 0.02% Croatian7 0.01% Iranian6 0.01% Slovak5 0.01% Somali4 0.01% Dutch West Indian
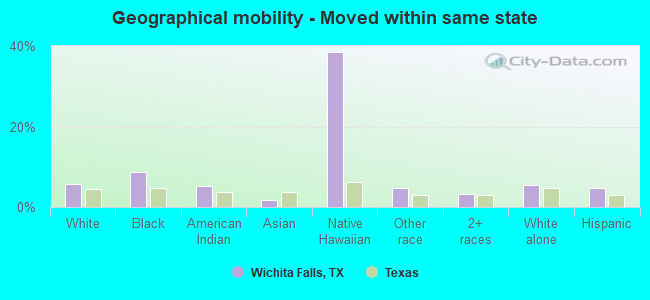
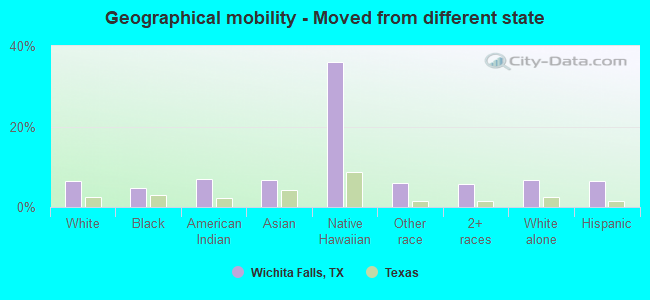
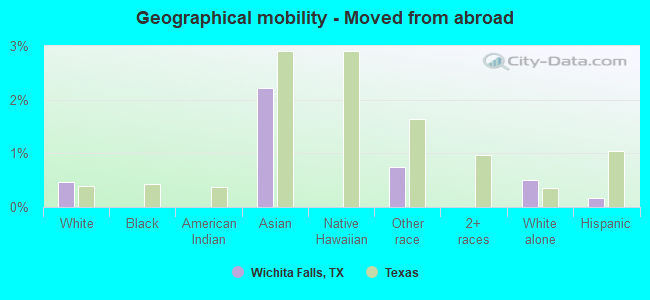
Geographical mobility in Wichita Falls Same house 1 year ago 57,115 77.6% White (Caucasian)8,574 77.2% Black or African American939 82.8% American Indian / Alaska Native2,469 81.4% Asian94 53.8% Native Hawaiian / Pacific Islander3,618 77.0% Other race7,586 82.0% Two or more races46,663 77.6% White alone, not Hispanic / Latino18,222 79.7% Hispanic or LatinoMoved within same county 7,094 9.6% White / Caucasian1,040 9.4% Black or African American64 5.7% American Indian / Alaska Native235 7.7% Asian542 11.5% Other race825 8.9% Two or more races5,876 9.8% White alone, not Hispanic / Latino2,056 9.0% Hispanic or LatinoMoved within same state 4,271 5.8% White / Caucasian962 8.7% Black or African American60 5.3% American Indian / Alaska Native57 1.9% Asian67 38.5% Native Hawaiian / Pacific Islander226 4.8% Other race300 3.2% Two or more races3,325 5.5% White alone, not Hispanic / Latino1,086 4.7% Hispanic or LatinoMoved from different state 4,767 6.5% White / Caucasian531 4.8% Black or African American78 6.8% American Indian / Alaska Native205 6.8% Asian63 36.1% Native Hawaiian / Pacific Islander277 5.9% Other race538 5.8% Two or more races3,998 6.6% White alone, not Hispanic / Latino1,468 6.4% Hispanic or LatinoMoved from abroad 343 0.5% White67 2.2% Asian35 0.8% Other race305 0.5% White alone, not Hispanic / Latino38 0.2% Hispanic or Latino
Children Nativity (place of birth) in Wichita Falls
Children under 6 years - Living with two parents Both parents native 3,255 99.8% Native5 0.2% Foreign-bornBoth parents foreign-born 425 91.8% Native38 8.2% Foreign-bornOne native, one foreign-born parent 613 98.4% Native10 1.6% Foreign-bornChildren under 6 years - Living with one parent Native parent 2,621 100.0% NativeForeign-born parent 64 85.7% Native11 14.3% Foreign-bornChildren 6 to 17 years - Living with two parents Both parents native 6,616 99.9% Native5 0.1% Foreign-bornBoth parents foreign-born 703 83.9% Native135 16.1% Foreign-bornOne native, one foreign-born parent 868 94.7% Native49 5.3% Foreign-bornChildren 6 to 17 years - Living with one parent Native parent 5,749 100.0% NativeForeign-born parent 538 62.2% Native326 37.8% Foreign-born
Grandparents responsible for own grandchildren in Wichita Falls
Grandparents (30 to 59 years) White / Caucasian 531 85.1% Responsible for grandchildren93 14.9% Not responsible for grandchildrenBlack or African American 53 100.0% Responsible for grandchildrenAmerican Indian / Alaska Native 10 100.0% Not responsible for grandchildrenAsian 9 100.0% Not responsible for grandchildrenOther race 2 100.0% Responsible for grandchildrenTwo or more races 12 100.0% Not responsible for grandchildrenWhite alone, not Hispanic / Latino 286 87.0% Responsible for grandchildren43 13.0% Not responsible for grandchildrenHispanic or Latino 181 73.5% Responsible for grandchildren65 26.5% Not responsible for grandchildrenGrandparents (60 years and over) White / Caucasian 204 56.0% Responsible for grandchildren160 44.0% Not responsible for grandchildrenBlack or African American 50 49.5% Responsible for grandchildren51 50.5% Not responsible for grandchildrenAmerican Indian / Alaska Native 3 100.0% Responsible for grandchildrenAsian 52 100.0% Not responsible for grandchildrenOther race 30 52.3% Responsible for grandchildren27 47.7% Not responsible for grandchildrenTwo or more races 7 14.1% Responsible for grandchildren40 85.9% Not responsible for grandchildrenWhite alone, not Hispanic / Latino 109 41.7% Responsible for grandchildren153 58.3% Not responsible for grandchildrenHispanic or Latino 94 60.4% Responsible for grandchildren62 39.6% Not responsible for grandchildren