Races in Wilder, Idaho (ID) Detailed Stats
Data:
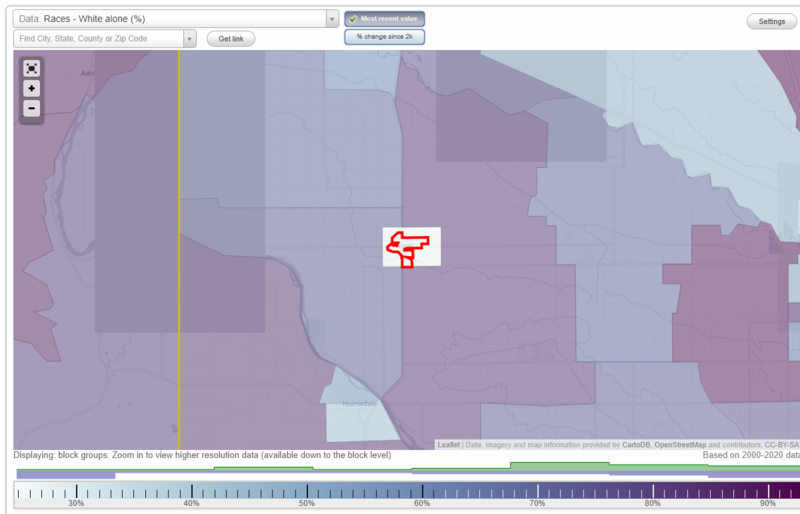
Races - White alone (%)
Races - White alone (% change since 2000)
Races - Black alone (%)
Races - Black alone (% change since 2000)
Races - American Indian alone (%)
Races - American Indian alone (% change since 2000)
Races - Asian alone (%)
Races - Asian alone (% change since 2000)
Races - Hispanic (%)
Races - Hispanic (% change since 2000)
Races - Native Hawaiian and Other Pacific Islander alone (%)
Races - Native Hawaiian and Other Pacific Islander alone (% change since 2000)
Races - Two or more races(%)
Races - Two or more races(% change since 2000)
Races - Other race alone (%)
Races - Other race alone (% change since 2000)
Racial diversity
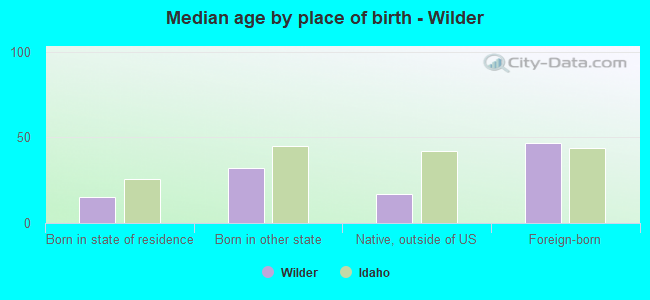
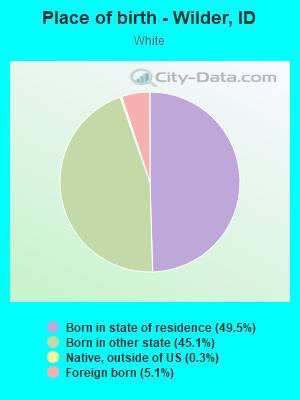
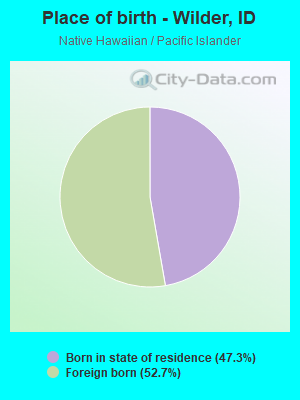
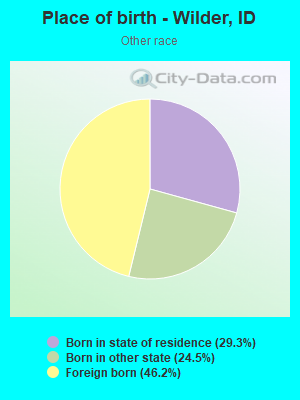
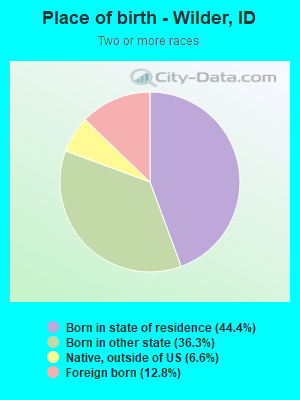
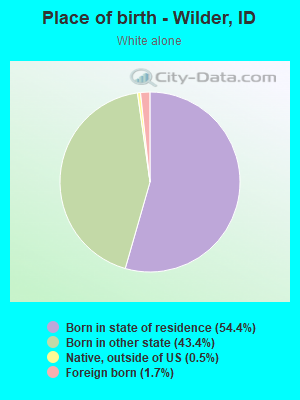
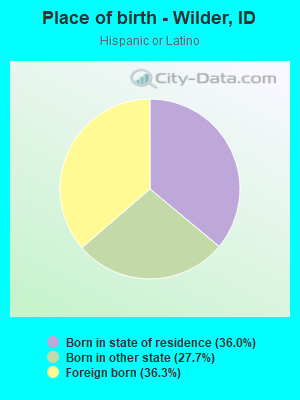
Place of birth - Born in state of residence (%)
Place of birth - Born in state of residence (%) - White
Place of birth - Born in state of residence (%) - Black or African American
Place of birth - Born in state of residence (%) - Asian
Place of birth - Born in state of residence (%) - Hispanic or Latino
Place of birth - Born in state of residence (%) - American Indian and Alaska Native
Place of birth - Born in state of residence (%) - Multirace
Place of birth - Born in state of residence (%) - Other Race
Place of birth - Born in other state (%)
Place of birth - Born in other state (%) - White
Place of birth - Born in other state (%) - Black or African American
Place of birth - Born in other state (%) - Asian
Place of birth - Born in other state (%) - Hispanic or Latino
Place of birth - Born in other state (%) - American Indian and Alaska Native
Place of birth - Born in other state (%) - Multirace
Place of birth - Born in other state (%) - Other Race
Place of birth - Native, outside of US (%)
Place of birth - Native, outside of US (%) - White
Place of birth - Native, outside of US (%) - Black or African American
Place of birth - Native, outside of US (%) - Asian
Place of birth - Native, outside of US (%) - Hispanic or Latino
Place of birth - Native, outside of US (%) - American Indian and Alaska Native
Place of birth - Native, outside of US (%) - Multirace
Place of birth - Native, outside of US (%) - Other Race
Place of birth - Foreign born (%)
Place of birth - Foreign born (%) - White
Place of birth - Foreign born (%) - Black or African American
Place of birth - Foreign born (%) - Asian
Place of birth - Foreign born (%) - Hispanic or Latino
Place of birth - Foreign born (%) - American Indian and Alaska Native
Place of birth - Foreign born (%) - Multirace
Place of birth - Foreign born (%) - Other Race
Residents speaking English at home (%)
Residents speaking English at home - Born in the United States (%)
Residents speaking English at home - Native, born elsewhere (%)
Residents speaking English at home - Foreign born (%)
Residents speaking Spanish at home (%)
Residents speaking Spanish at home - Born in the United States (%)
Residents speaking Spanish at home - Native, born elsewhere (%)
Residents speaking Spanish at home - Foreign born (%)
Residents speaking other language at home (%)
Residents speaking other language at home - Born in the United States (%)
Residents speaking other language at home - Native, born elsewhere (%)
Residents speaking other language at home - Foreign born (%)
Marital status - Never married (%)
Marital status - Now married (%)
Marital status - Separated (%)
Marital status - Widowed (%)
Marital status - Divorced (%)
Ancestries Reported - Arab (%)
Ancestries Reported - Czech (%)
Ancestries Reported - Danish (%)
Ancestries Reported - Dutch (%)
Ancestries Reported - English (%)
Ancestries Reported - French (%)
Ancestries Reported - French Canadian (%)
Ancestries Reported - German (%)
Ancestries Reported - Greek (%)
Ancestries Reported - Hungarian (%)
Ancestries Reported - Irish (%)
Ancestries Reported - Italian (%)
Ancestries Reported - Lithuanian (%)
Ancestries Reported - Norwegian (%)
Ancestries Reported - Polish (%)
Ancestries Reported - Portuguese (%)
Ancestries Reported - Russian (%)
Ancestries Reported - Scotch-Irish (%)
Ancestries Reported - Scottish (%)
Ancestries Reported - Slovak (%)
Ancestries Reported - Subsaharan African (%)
Ancestries Reported - Swedish (%)
Ancestries Reported - Swiss (%)
Ancestries Reported - Ukrainian (%)
Ancestries Reported - United States (%)
Ancestries Reported - Welsh (%)
Ancestries Reported - West Indian (%)
Ancestries Reported - Other (%)
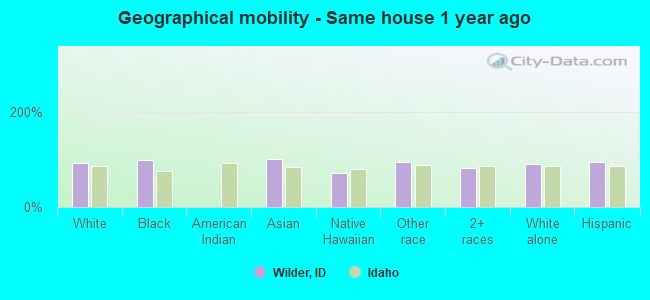
Geographical mobility - Same house 1 year ago (%)
Geographical mobility - Same house 1 year ago (%) - White
Geographical mobility - Same house 1 year ago (%) - Black or African American
Geographical mobility - Same house 1 year ago (%) - Asian
Geographical mobility - Same house 1 year ago (%) - Hispanic or Latino
Geographical mobility - Same house 1 year ago (%) - American Indian and Alaska Native
Geographical mobility - Same house 1 year ago (%) - Multirace
Geographical mobility - Same house 1 year ago (%) - Other Race
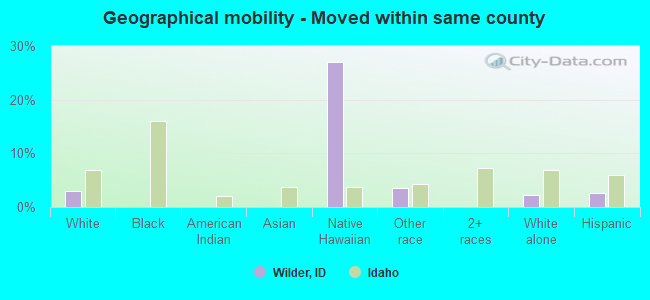
Geographical mobility - Moved within same county (%)
Geographical mobility - Moved within same county (%) - White
Geographical mobility - Moved within same county (%) - Black or African American
Geographical mobility - Moved within same county (%) - Asian
Geographical mobility - Moved within same county (%) - Hispanic or Latino
Geographical mobility - Moved within same county (%) - American Indian and Alaska Native
Geographical mobility - Moved within same county (%) - Multirace
Geographical mobility - Moved within same county (%) - Other Race
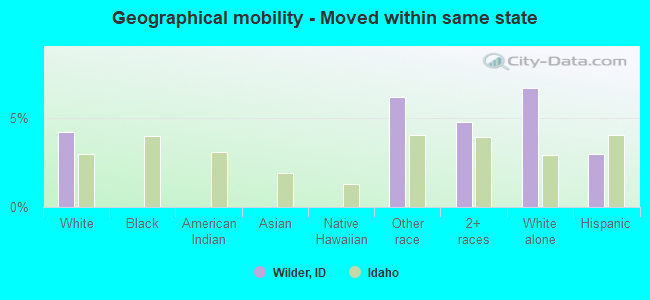
Geographical mobility - Moved from different county within same state (%)
Geographical mobility - Moved from different county within same state (%) - White
Geographical mobility - Moved from different county within same state (%) - Black or African American
Geographical mobility - Moved from different county within same state (%) - Asian
Geographical mobility - Moved from different county within same state (%) - Hispanic or Latino
Geographical mobility - Moved from different county within same state (%) - American Indian and Alaska Native
Geographical mobility - Moved from different county within same state (%) - Multirace
Geographical mobility - Moved from different county within same state (%) - Other Race
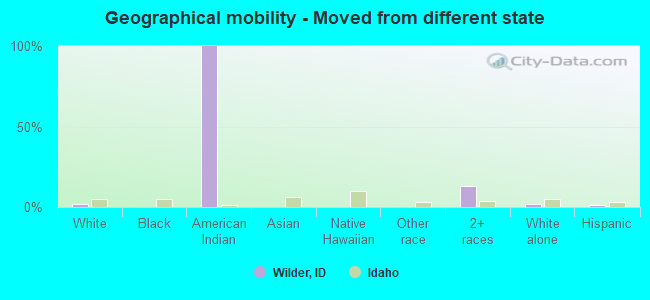
Geographical mobility - Moved from different state (%)
Geographical mobility - Moved from different state (%) - White
Geographical mobility - Moved from different state (%) - Black or African American
Geographical mobility - Moved from different state (%) - Asian
Geographical mobility - Moved from different state (%) - Hispanic or Latino
Geographical mobility - Moved from different state (%) - American Indian and Alaska Native
Geographical mobility - Moved from different state (%) - Multirace
Geographical mobility - Moved from different state (%) - Other Race
Geographical mobility - Moved from abroad (%)
Geographical mobility - Moved from abroad (%) - White
Geographical mobility - Moved from abroad (%) - Black or African American
Geographical mobility - Moved from abroad (%) - Asian
Geographical mobility - Moved from abroad (%) - Hispanic or Latino
Geographical mobility - Moved from abroad (%) - American Indian and Alaska Native
Geographical mobility - Moved from abroad (%) - Multirace
Geographical mobility - Moved from abroad (%) - Other Race
Place of birth for the foreign-born population - Ireland (%)
Place of birth for the foreign-born population - Denmark (%)
Place of birth for the foreign-born population - Norway (%)
Place of birth for the foreign-born population - Sweden (%)
Place of birth for the foreign-born population - United Kingdom (%)
Place of birth for the foreign-born population - England (%)
Place of birth for the foreign-born population - Scotland (%)
Place of birth for the foreign-born population - Other Northern Europe (%)
Place of birth for the foreign-born population - Austria (%)
Place of birth for the foreign-born population - Belgium (%)
Place of birth for the foreign-born population - France (%)
Place of birth for the foreign-born population - Germany (%)
Place of birth for the foreign-born population - Netherlands (%)
Place of birth for the foreign-born population - Switzerland (%)
Place of birth for the foreign-born population - Other Western Europe (%)
Place of birth for the foreign-born population - Greece (%)
Place of birth for the foreign-born population - Italy (%)
Place of birth for the foreign-born population - Portugal (%)
Place of birth for the foreign-born population - Spain (%)
Place of birth for the foreign-born population - Other Southern Europe (%)
Place of birth for the foreign-born population - Albania (%)
Place of birth for the foreign-born population - Belarus (%)
Place of birth for the foreign-born population - Bosnia and Herzegovina (%)
Place of birth for the foreign-born population - Bulgaria (%)
Place of birth for the foreign-born population - Croatia (%)
Place of birth for the foreign-born population - Czechoslovakia (%)
Place of birth for the foreign-born population - Hungary (%)
Place of birth for the foreign-born population - Latvia (%)
Place of birth for the foreign-born population - Lithuania (%)
Place of birth for the foreign-born population - North Macedonia (Macedonia) (%)
Place of birth for the foreign-born population - Moldova (%)
Place of birth for the foreign-born population - Poland (%)
Place of birth for the foreign-born population - Romania (%)
Place of birth for the foreign-born population - Russia (%)
Place of birth for the foreign-born population - Serbia (%)
Place of birth for the foreign-born population - Ukraine (%)
Place of birth for the foreign-born population - Other Eastern Europe (%)
Place of birth for the foreign-born population - China (%)
Place of birth for the foreign-born population - Hong Kong (%)
Place of birth for the foreign-born population - Taiwan (%)
Place of birth for the foreign-born population - Japan (%)
Place of birth for the foreign-born population - Korea (%)
Place of birth for the foreign-born population - Other Eastern Asia (%)
Place of birth for the foreign-born population - Afghanistan (%)
Place of birth for the foreign-born population - Bangladesh (%)
Place of birth for the foreign-born population - India (%)
Place of birth for the foreign-born population - Iran (%)
Place of birth for the foreign-born population - Kazakhstan (%)
Place of birth for the foreign-born population - Nepal (%)
Place of birth for the foreign-born population - Pakistan (%)
Place of birth for the foreign-born population - Sri Lanka (%)
Place of birth for the foreign-born population - Uzbekistan (%)
Place of birth for the foreign-born population - Other South Central Asia (%)
Place of birth for the foreign-born population - Burma (%)
Place of birth for the foreign-born population - Cambodia (%)
Place of birth for the foreign-born population - Indonesia (%)
Place of birth for the foreign-born population - Laos (%)
Place of birth for the foreign-born population - Malaysia (%)
Place of birth for the foreign-born population - Philippines (%)
Place of birth for the foreign-born population - Singapore (%)
Place of birth for the foreign-born population - Thailand (%)
Place of birth for the foreign-born population - Vietnam (%)
Place of birth for the foreign-born population - Other South Eastern Asia (%)
Place of birth for the foreign-born population - Armenia (%)
Place of birth for the foreign-born population - Iraq (%)
Place of birth for the foreign-born population - Israel (%)
Place of birth for the foreign-born population - Jordan (%)
Place of birth for the foreign-born population - Kuwait (%)
Place of birth for the foreign-born population - Lebanon (%)
Place of birth for the foreign-born population - Saudi Arabia (%)
Place of birth for the foreign-born population - Syria (%)
Place of birth for the foreign-born population - Turkey (%)
Place of birth for the foreign-born population - Yemen (%)
Place of birth for the foreign-born population - Other Western Asia (%)
Place of birth for the foreign-born population - Eritrea (%)
Place of birth for the foreign-born population - Ethiopia (%)
Place of birth for the foreign-born population - Kenya (%)
Place of birth for the foreign-born population - Somalia (%)
Place of birth for the foreign-born population - Uganda (%)
Place of birth for the foreign-born population - Zimbabwe (%)
Place of birth for the foreign-born population - Other Eastern Africa (%)
Place of birth for the foreign-born population - Cameroon (%)
Place of birth for the foreign-born population - Congo (%)
Place of birth for the foreign-born population - Democratic Republic of Congo (Zaire) (%)
Place of birth for the foreign-born population - Other Middle Africa (%)
Place of birth for the foreign-born population - Egypt (%)
Place of birth for the foreign-born population - Morocco (%)
Place of birth for the foreign-born population - Sudan (%)
Place of birth for the foreign-born population - Other Northern Africa (%)
Place of birth for the foreign-born population - South Africa (%)
Place of birth for the foreign-born population - Other Southern Africa (%)
Place of birth for the foreign-born population - Cabo Verde (%)
Place of birth for the foreign-born population - Ghana (%)
Place of birth for the foreign-born population - Liberia (%)
Place of birth for the foreign-born population - Nigeria (%)
Place of birth for the foreign-born population - Senegal (%)
Place of birth for the foreign-born population - Sierra Leone (%)
Place of birth for the foreign-born population - Other Western Africa (%)
Place of birth for the foreign-born population - Australia (%)
Place of birth for the foreign-born population - New Zealand (%)
Place of birth for the foreign-born population - Fiji (%)
Place of birth for the foreign-born population - Micronesia (%)
Place of birth for the foreign-born population - Bahamas (%)
Place of birth for the foreign-born population - Barbados (%)
Place of birth for the foreign-born population - Cuba (%)
Place of birth for the foreign-born population - Dominica (%)
Place of birth for the foreign-born population - Dominican Republic (%)
Place of birth for the foreign-born population - Grenada (%)
Place of birth for the foreign-born population - Haiti (%)
Place of birth for the foreign-born population - Jamaica (%)
Place of birth for the foreign-born population - St. Vincent and the Grenadines (%)
Place of birth for the foreign-born population - Trinidad and Tobago (%)
Place of birth for the foreign-born population - West Indies (%)
Place of birth for the foreign-born population - Other Caribbean (%)
Place of birth for the foreign-born population - Belize (%)
Place of birth for the foreign-born population - Costa Rica (%)
Place of birth for the foreign-born population - El Salvador (%)
Place of birth for the foreign-born population - Guatemala (%)
Place of birth for the foreign-born population - Honduras (%)
Place of birth for the foreign-born population - Mexico (%)
Place of birth for the foreign-born population - Nicaragua (%)
Place of birth for the foreign-born population - Panama (%)
Place of birth for the foreign-born population - Other Central America (%)
Place of birth for the foreign-born population - Argentina (%)
Place of birth for the foreign-born population - Bolivia (%)
Place of birth for the foreign-born population - Brazil (%)
Place of birth for the foreign-born population - Chile (%)
Place of birth for the foreign-born population - Colombia (%)
Place of birth for the foreign-born population - Ecuador (%)
Place of birth for the foreign-born population - Guyana (%)
Place of birth for the foreign-born population - Peru (%)
Place of birth for the foreign-born population - Uruguay (%)
Place of birth for the foreign-born population - Venezuela (%)
Place of birth for the foreign-born population - Other South America (%)
Place of birth for the foreign-born population - Canada (%)
Place of birth for the foreign-born population - Other Northern America (%)
Place of birth for the foreign-born population - Other (%)
Latest news about races in Wilder, ID collected exclusively by city-data.com from local newspapers, TV, and radio stations
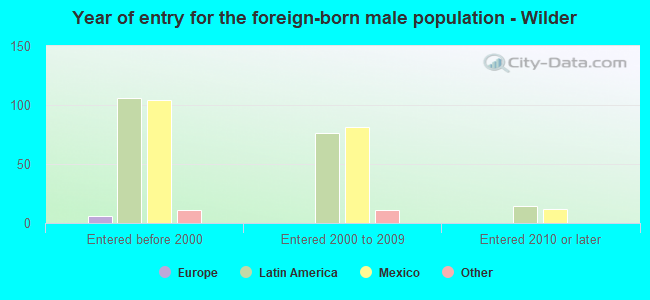
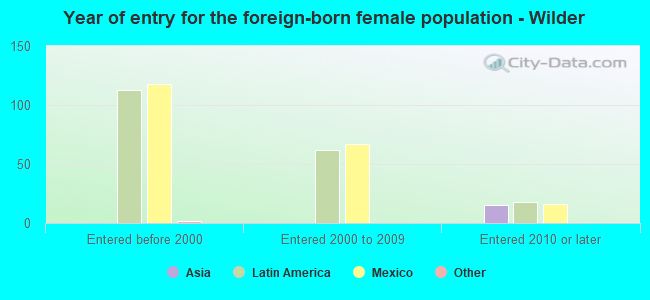
According to 2022 data, the most numerous races in Wilder, ID are White alone (512 residents), Hispanic (1,163 residents), and Two or more races (66 residents). 43.3% of Wilder residents speak English at home. 23.9% of Wilder, ID residents are foreign-born (22.8% born in Latin America), which is 79.0% greater than the foreign-born rate of 5.0% across the entire state of Idaho.
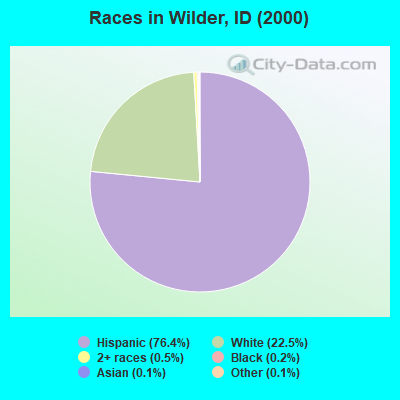
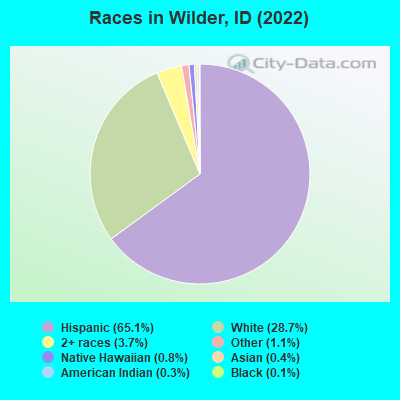
Race distribution in Wilder
2000 2022
1,139,291 88.0% White alone 101,690 7.9% Hispanic 18,261 1.4% Two or more races 15,789 1.2% American Indian alone 11,641 0.9% Asian alone 4,889 0.4% Black alone 1,192 0.09% Other race alone 1,200 0.09% Native Hawaiian and Other
1,531,219 79.0% White alone 261,921 13.5% Hispanic 81,112 4.2% Two or more races 25,174 1.3% Asian alone 15,825 0.8% American Indian alone 11,868 0.6% Black alone 8,752 0.5% Other race alone 3,162 0.2% Native Hawaiian and Other
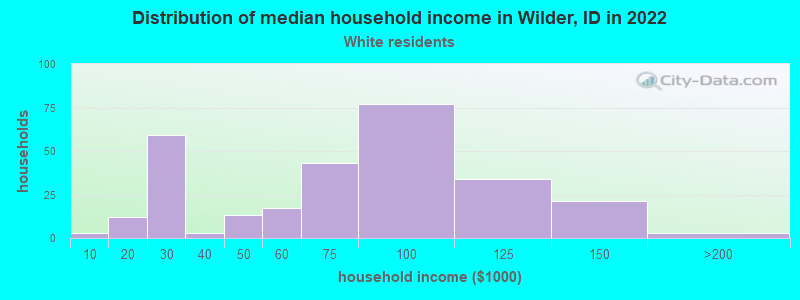
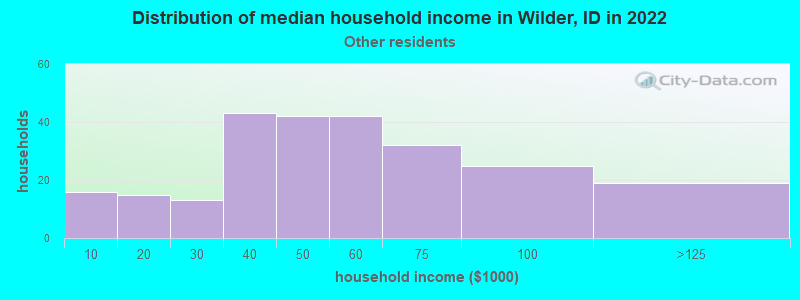
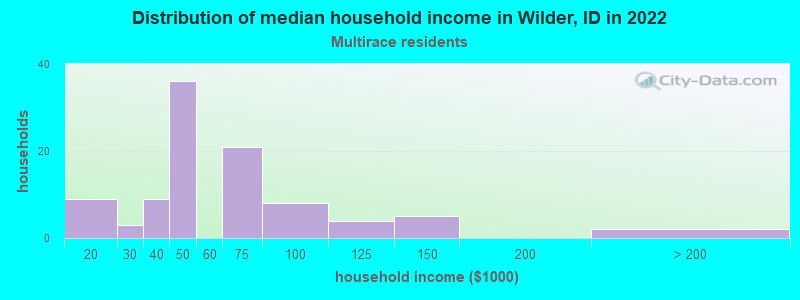
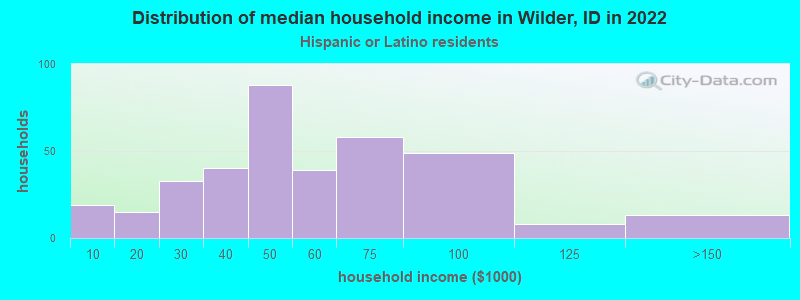
Income and house value in Wilder Median household income in 2022 $79,158 White non-Hispanic householders$43,155 Some other race householders$46,096 Two or more races householders$43,795 Hispanic or Latino race householdersMedian 2022 house value $226,511 White Non-Hispanic householders$233,578 Some other race householders$300,366 Two or more races householders$223,684 Hispanic or Latino householders
Median age by race in Wilder
35.0 Median age for White residents40.9 34.9 -872,675,249.5 Median age for Black or African American residents-805,220,882.7 -1,075,837,741.4 -485,036,119.2 Median age for American Indian / Alaska Native residents-575,980,391.6 -408,821,034.4 -600,496,277.3 Median age for Asian residents-648,648,648.0 -840,294,839.5 18.0 Median age for Native Hawaiian / Pacific Islander residents16.2 -679,245,282.3 32.5 Median age for Other race residents34.0 30.4 24.2 Median age for Two or more races residents25.1 23.5 43.7 Median age for White alone residents44.5 39.1 28.7 Median age for Hispanic or Latino residents29.2 27.9
Owner/renter occupied households by race in Wilder
House owners and renters - White residents 198 68.2% Owner occupied93 31.8% Renter occupiedHouse owners and renters - Native Hawaiian / Pacific Islander residents 4 100.0% Renter occupiedHouse owners and renters - Other race residents 144 72.0% Owner occupied56 28.0% Renter occupiedHouse owners and renters - Two or more races residents 28 36.9% Owner occupied48 63.1% Renter occupiedHouse owners and renters - White alone residents 173 83.5% Owner occupied34 16.5% Renter occupiedHouse owners and renters - Hispanic or Latino residents 196 60.5% Owner occupied128 39.5% Renter occupied
Language usage in Wilder
English speakers - Total 43.3% of residents of Wilder speak English at home.
55.1% of residents speak Spanish at home 503 54.2% Speak English very well425 45.8% Speak English less than very well2.5% of residents speak other language at home 42 100.0% Speak English very well
English speakers - Born in the United States 53.7% of residents of Wilder speak English at home.
55.1% of residents speak Spanish at home 247 79.4% Speak English very well64 20.6% Speak English less than very well1.1% of residents speak other language at home 6 100.0% Speak English very well
English speakers - Native, born elsewhere 40.0% of residents of Wilder speak English at home.
80.0% of residents speak other language at home 8 100.0% Speak English very well
English speakers - Foreign-born 3.8% of residents of Wilder speak English at home.
86.9% of residents speak Spanish at home 75 19.5% Speak English very well309 80.5% Speak English less than very well5.4% of residents speak other language at home 24 100.0% Speak English very well
White (Caucasian) - Speak only English Native:
78.7% (525)Foreign-born:
25.9% (10)
White (Caucasian) - Speak another language Native:
16.5% (110)Foreign-born:
74.4% (28)
Other race - Speak another language Native:
80.7% (281)Foreign-born:
95.7% (298)
Two or more races - Speak another language Native:
58.0% (119)Foreign-born:
92.9% (34)
White alone - Speak only English Native:
97.3% (465)Foreign-born:
47.7% (4)
White alone - Speak another language Native:
2.7% (13)Foreign-born:
53.2% (5)
Hispanic or Latino - Speak only English Native:
25.8% (173)Foreign-born:
3.6% (15)
Hispanic or Latino - Speak another language Native:
76.5% (513)Foreign-born:
91.3% (388)
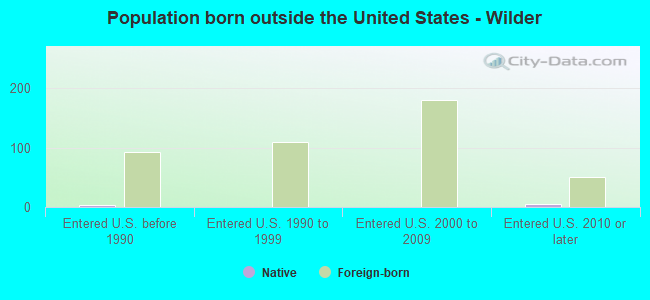
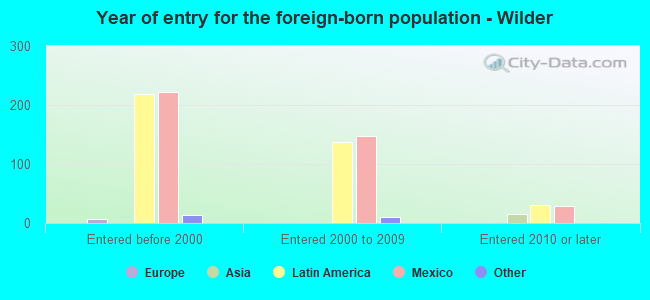
Foreign-born residents in Wilder 426 residents are foreign born (22.8% Latin America ).
This city:
23.9%Idaho:
5.7%
Marital status for residents in Wilder Marital status - White (Caucasian) population 15 years and over
Males 14.5% Never married70.7% Now married0.0% Separated0.0% Widowed14.8% DivorcedFemales 8.1% Never married67.6% Now married3.7% Separated3.7% Widowed16.9% DivorcedWomen who gave birth in the past 12 months Now married:
81.2% (27)Unmarried:
18.8% (6)
Women who did not give birth in the past 12 months Now married:
84.1% (138)Unmarried:
15.9% (26)
Marital status - Native Hawaiian / Pacific Islander population 15 years and over
Males 57.1% Never married42.9% Now married0.0% Separated0.0% Widowed0.0% DivorcedFemales 0.0% Never married100.0% Now married0.0% Separated0.0% Widowed0.0% DivorcedWomen who did not give birth in the past 12 months Now married:
100.0% (4)Unmarried:
0.0% (0)
Marital status - Other race population 15 years and over
Males 32.8% Never married54.2% Now married2.8% Separated3.2% Widowed7.1% DivorcedFemales 26.8% Never married70.0% Now married2.3% Separated0.0% Widowed0.9% DivorcedWomen who gave birth in the past 12 months Now married:
100.0% (12)Unmarried:
0.0% (0)
Women who did not give birth in the past 12 months Now married:
59.2% (67)Unmarried:
40.8% (46)
Marital status - Two or more races population 15 years and over
Males 47.2% Never married34.0% Now married0.0% Separated9.4% Widowed9.4% DivorcedFemales 31.3% Never married46.9% Now married0.0% Separated1.6% Widowed20.3% DivorcedWomen who did not give birth in the past 12 months Now married:
39.4% (21)Unmarried:
60.6% (32)
Marital status - White alone, not Hispanic / Latino population 15 years and over
Males 15.5% Never married67.5% Now married0.0% Separated0.0% Widowed17.0% DivorcedFemales 3.4% Never married55.7% Now married6.2% Separated6.2% Widowed28.4% DivorcedWomen who gave birth in the past 12 months Now married:
100.0% (23)Unmarried:
0.0% (0)
Women who did not give birth in the past 12 months Now married:
76.4% (46)Unmarried:
23.6% (14)
Marital status - Hispanic or Latino population 15 years and over
Males 30.8% Never married57.0% Now married2.0% Separated2.3% Widowed8.0% DivorcedFemales 23.7% Never married74.5% Now married1.3% Separated0.0% Widowed0.5% DivorcedWomen who gave birth in the past 12 months Now married:
75.0% (19)Unmarried:
25.0% (6)
Women who did not give birth in the past 12 months Now married:
69.7% (189)Unmarried:
30.3% (82)
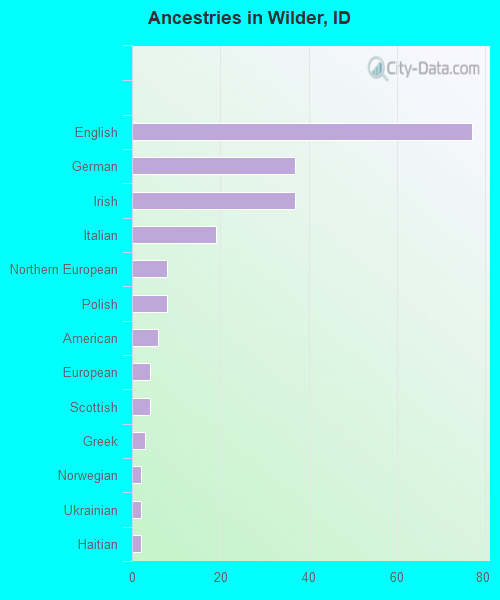
Ancestries in Wilder
77 6.6% English37 3.2% German37 3.2% Irish19 1.6% Italian8 0.7% Northern European8 0.7% Polish6 0.5% American4 0.3% European4 0.3% Scottish3 0.3% Greek2 0.2% Norwegian2 0.2% Ukrainian2 0.2% Haitian
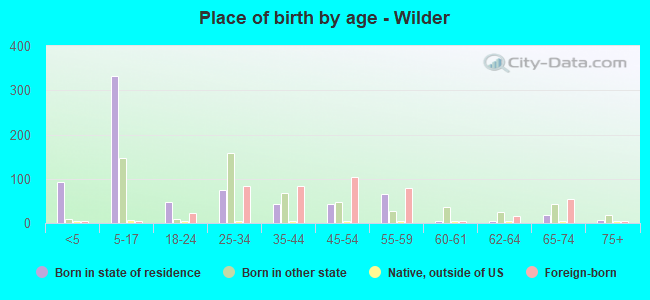
Children Nativity (place of birth) in Wilder
Children under 6 years - Living with two parents Both parents native 56 100.0% NativeBoth parents foreign-born 8 100.0% NativeOne native, one foreign-born parent 15 100.0% NativeChildren under 6 years - Living with one parent Native parent 27 100.0% NativeForeign-born parent 2 100.0% NativeChildren 6 to 17 years - Living with two parents Both parents native 83 100.0% NativeBoth parents foreign-born 246 100.0% NativeOne native, one foreign-born parent 53 100.0% NativeChildren 6 to 17 years - Living with one parent Native parent 37 100.0% NativeForeign-born parent 32 50.1% Native32 49.9% Foreign-born
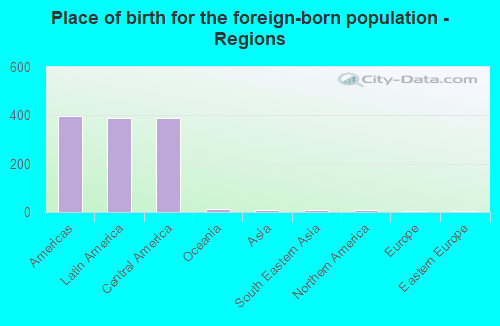
Place of birth for residents in Wilder 396 Americas389 Latin America389 Central America14 Oceania9 Asia9 South Eastern Asia7 Northern America6 Europe6 Eastern Europe
Grandparents responsible for own grandchildren in Wilder
Grandparents (30 to 59 years) White / Caucasian 8 37.8% Responsible for grandchildren13 62.2% Not responsible for grandchildrenTwo or more races 10 100.0% Responsible for grandchildrenWhite alone, not Hispanic / Latino 8 75.7% Responsible for grandchildren2 24.3% Not responsible for grandchildrenHispanic or Latino 19 100.0% Not responsible for grandchildren
Grandparents (60 years and over) Hispanic or Latino 3 100.0% Not responsible for grandchildren