Races in Willowbrook, California (CA) Detailed Stats
Data:
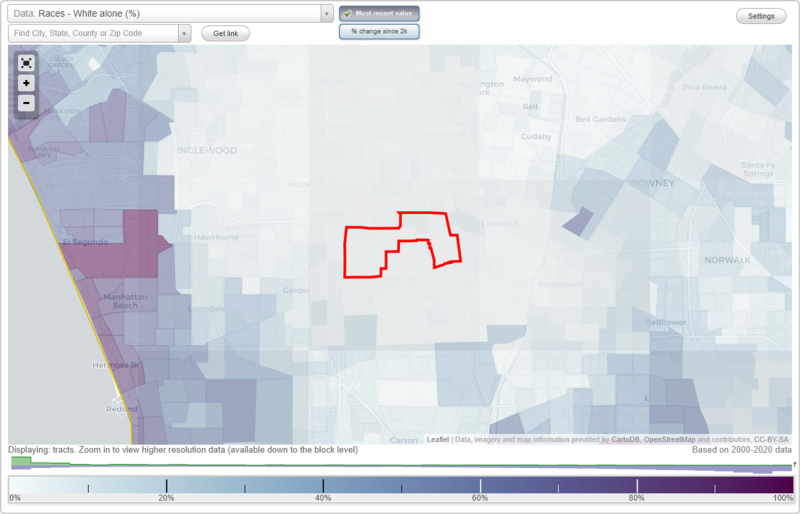
Races - White alone (%)
Races - White alone (% change since 2000)
Races - Black alone (%)
Races - Black alone (% change since 2000)
Races - American Indian alone (%)
Races - American Indian alone (% change since 2000)
Races - Asian alone (%)
Races - Asian alone (% change since 2000)
Races - Hispanic (%)
Races - Hispanic (% change since 2000)
Races - Native Hawaiian and Other Pacific Islander alone (%)
Races - Native Hawaiian and Other Pacific Islander alone (% change since 2000)
Races - Two or more races(%)
Races - Two or more races(% change since 2000)
Races - Other race alone (%)
Races - Other race alone (% change since 2000)
Racial diversity
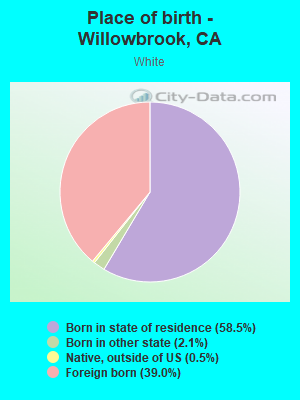
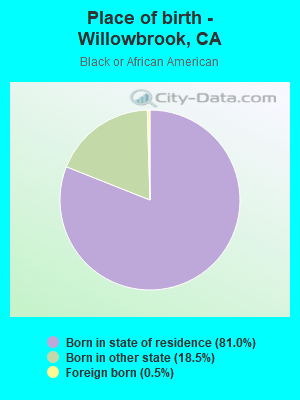
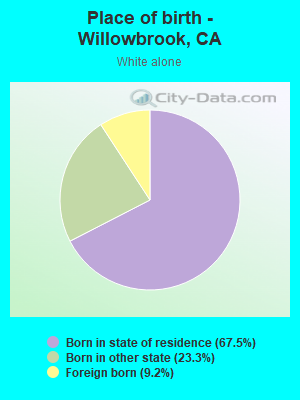
Place of birth - Born in state of residence (%)
Place of birth - Born in state of residence (%) - White
Place of birth - Born in state of residence (%) - Black or African American
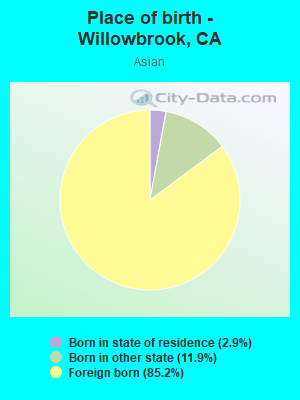
Place of birth - Born in state of residence (%) - Asian
Place of birth - Born in state of residence (%) - Hispanic or Latino
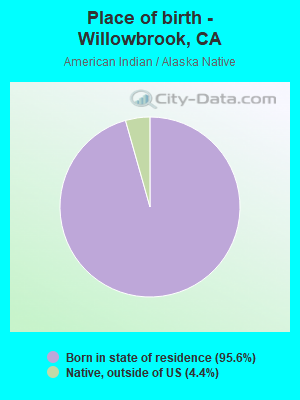
Place of birth - Born in state of residence (%) - American Indian and Alaska Native
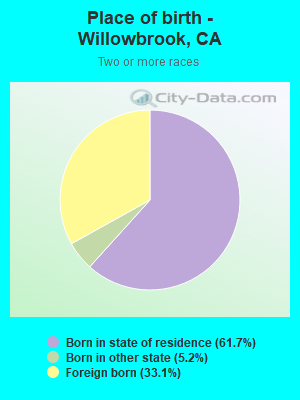
Place of birth - Born in state of residence (%) - Multirace
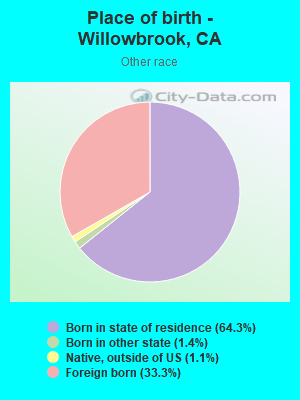
Place of birth - Born in state of residence (%) - Other Race
Place of birth - Born in other state (%)
Place of birth - Born in other state (%) - White
Place of birth - Born in other state (%) - Black or African American
Place of birth - Born in other state (%) - Asian
Place of birth - Born in other state (%) - Hispanic or Latino
Place of birth - Born in other state (%) - American Indian and Alaska Native
Place of birth - Born in other state (%) - Multirace
Place of birth - Born in other state (%) - Other Race
Place of birth - Native, outside of US (%)
Place of birth - Native, outside of US (%) - White
Place of birth - Native, outside of US (%) - Black or African American
Place of birth - Native, outside of US (%) - Asian
Place of birth - Native, outside of US (%) - Hispanic or Latino
Place of birth - Native, outside of US (%) - American Indian and Alaska Native
Place of birth - Native, outside of US (%) - Multirace
Place of birth - Native, outside of US (%) - Other Race
Place of birth - Foreign born (%)
Place of birth - Foreign born (%) - White
Place of birth - Foreign born (%) - Black or African American
Place of birth - Foreign born (%) - Asian
Place of birth - Foreign born (%) - Hispanic or Latino
Place of birth - Foreign born (%) - American Indian and Alaska Native
Place of birth - Foreign born (%) - Multirace
Place of birth - Foreign born (%) - Other Race
Residents speaking English at home (%)
Residents speaking English at home - Born in the United States (%)
Residents speaking English at home - Native, born elsewhere (%)
Residents speaking English at home - Foreign born (%)
Residents speaking Spanish at home (%)
Residents speaking Spanish at home - Born in the United States (%)
Residents speaking Spanish at home - Native, born elsewhere (%)
Residents speaking Spanish at home - Foreign born (%)
Residents speaking other language at home (%)
Residents speaking other language at home - Born in the United States (%)
Residents speaking other language at home - Native, born elsewhere (%)
Residents speaking other language at home - Foreign born (%)
Marital status - Never married (%)
Marital status - Now married (%)
Marital status - Separated (%)
Marital status - Widowed (%)
Marital status - Divorced (%)
Ancestries Reported - Arab (%)
Ancestries Reported - Czech (%)
Ancestries Reported - Danish (%)
Ancestries Reported - Dutch (%)
Ancestries Reported - English (%)
Ancestries Reported - French (%)
Ancestries Reported - French Canadian (%)
Ancestries Reported - German (%)
Ancestries Reported - Greek (%)
Ancestries Reported - Hungarian (%)
Ancestries Reported - Irish (%)
Ancestries Reported - Italian (%)
Ancestries Reported - Lithuanian (%)
Ancestries Reported - Norwegian (%)
Ancestries Reported - Polish (%)
Ancestries Reported - Portuguese (%)
Ancestries Reported - Russian (%)
Ancestries Reported - Scotch-Irish (%)
Ancestries Reported - Scottish (%)
Ancestries Reported - Slovak (%)
Ancestries Reported - Subsaharan African (%)
Ancestries Reported - Swedish (%)
Ancestries Reported - Swiss (%)
Ancestries Reported - Ukrainian (%)
Ancestries Reported - United States (%)
Ancestries Reported - Welsh (%)
Ancestries Reported - West Indian (%)
Ancestries Reported - Other (%)
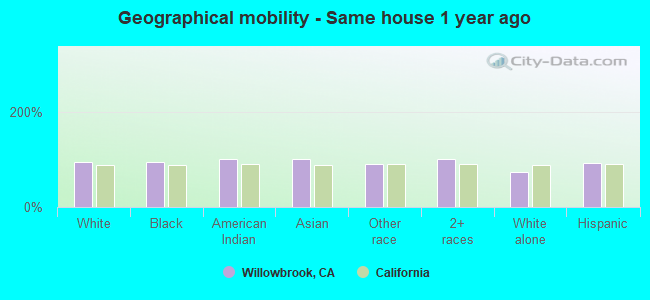
Geographical mobility - Same house 1 year ago (%)
Geographical mobility - Same house 1 year ago (%) - White
Geographical mobility - Same house 1 year ago (%) - Black or African American
Geographical mobility - Same house 1 year ago (%) - Asian
Geographical mobility - Same house 1 year ago (%) - Hispanic or Latino
Geographical mobility - Same house 1 year ago (%) - American Indian and Alaska Native
Geographical mobility - Same house 1 year ago (%) - Multirace
Geographical mobility - Same house 1 year ago (%) - Other Race
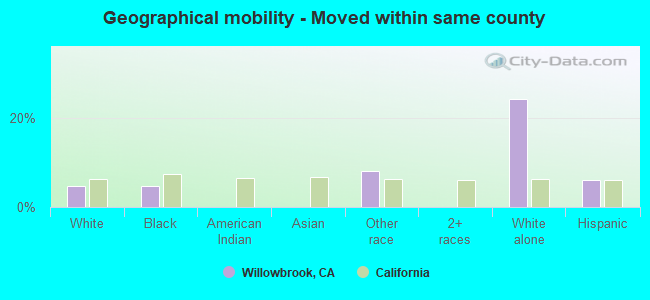
Geographical mobility - Moved within same county (%)
Geographical mobility - Moved within same county (%) - White
Geographical mobility - Moved within same county (%) - Black or African American
Geographical mobility - Moved within same county (%) - Asian
Geographical mobility - Moved within same county (%) - Hispanic or Latino
Geographical mobility - Moved within same county (%) - American Indian and Alaska Native
Geographical mobility - Moved within same county (%) - Multirace
Geographical mobility - Moved within same county (%) - Other Race
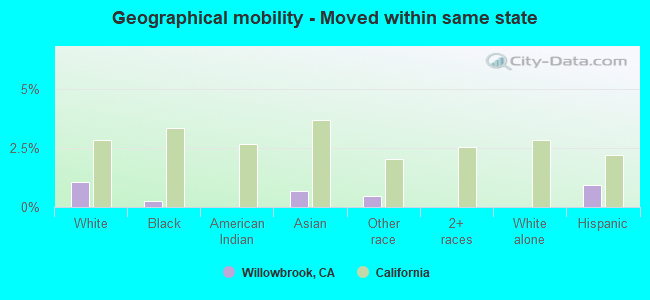
Geographical mobility - Moved from different county within same state (%)
Geographical mobility - Moved from different county within same state (%) - White
Geographical mobility - Moved from different county within same state (%) - Black or African American
Geographical mobility - Moved from different county within same state (%) - Asian
Geographical mobility - Moved from different county within same state (%) - Hispanic or Latino
Geographical mobility - Moved from different county within same state (%) - American Indian and Alaska Native
Geographical mobility - Moved from different county within same state (%) - Multirace
Geographical mobility - Moved from different county within same state (%) - Other Race
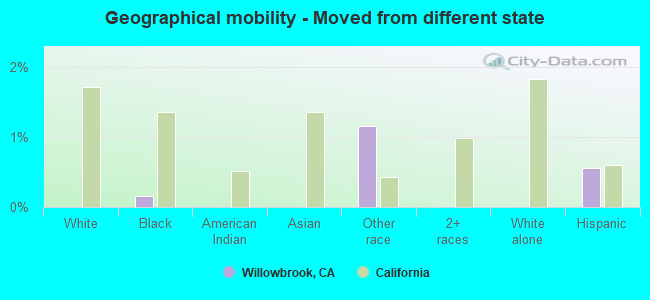
Geographical mobility - Moved from different state (%)
Geographical mobility - Moved from different state (%) - White
Geographical mobility - Moved from different state (%) - Black or African American
Geographical mobility - Moved from different state (%) - Asian
Geographical mobility - Moved from different state (%) - Hispanic or Latino
Geographical mobility - Moved from different state (%) - American Indian and Alaska Native
Geographical mobility - Moved from different state (%) - Multirace
Geographical mobility - Moved from different state (%) - Other Race
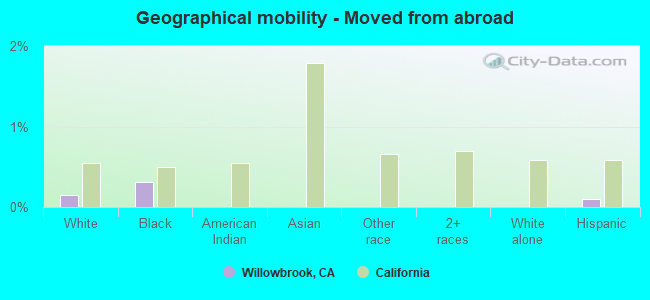
Geographical mobility - Moved from abroad (%)
Geographical mobility - Moved from abroad (%) - White
Geographical mobility - Moved from abroad (%) - Black or African American
Geographical mobility - Moved from abroad (%) - Asian
Geographical mobility - Moved from abroad (%) - Hispanic or Latino
Geographical mobility - Moved from abroad (%) - American Indian and Alaska Native
Geographical mobility - Moved from abroad (%) - Multirace
Geographical mobility - Moved from abroad (%) - Other Race
Place of birth for the foreign-born population - Ireland (%)
Place of birth for the foreign-born population - Denmark (%)
Place of birth for the foreign-born population - Norway (%)
Place of birth for the foreign-born population - Sweden (%)
Place of birth for the foreign-born population - United Kingdom (%)
Place of birth for the foreign-born population - England (%)
Place of birth for the foreign-born population - Scotland (%)
Place of birth for the foreign-born population - Other Northern Europe (%)
Place of birth for the foreign-born population - Austria (%)
Place of birth for the foreign-born population - Belgium (%)
Place of birth for the foreign-born population - France (%)
Place of birth for the foreign-born population - Germany (%)
Place of birth for the foreign-born population - Netherlands (%)
Place of birth for the foreign-born population - Switzerland (%)
Place of birth for the foreign-born population - Other Western Europe (%)
Place of birth for the foreign-born population - Greece (%)
Place of birth for the foreign-born population - Italy (%)
Place of birth for the foreign-born population - Portugal (%)
Place of birth for the foreign-born population - Spain (%)
Place of birth for the foreign-born population - Other Southern Europe (%)
Place of birth for the foreign-born population - Albania (%)
Place of birth for the foreign-born population - Belarus (%)
Place of birth for the foreign-born population - Bosnia and Herzegovina (%)
Place of birth for the foreign-born population - Bulgaria (%)
Place of birth for the foreign-born population - Croatia (%)
Place of birth for the foreign-born population - Czechoslovakia (%)
Place of birth for the foreign-born population - Hungary (%)
Place of birth for the foreign-born population - Latvia (%)
Place of birth for the foreign-born population - Lithuania (%)
Place of birth for the foreign-born population - North Macedonia (Macedonia) (%)
Place of birth for the foreign-born population - Moldova (%)
Place of birth for the foreign-born population - Poland (%)
Place of birth for the foreign-born population - Romania (%)
Place of birth for the foreign-born population - Russia (%)
Place of birth for the foreign-born population - Serbia (%)
Place of birth for the foreign-born population - Ukraine (%)
Place of birth for the foreign-born population - Other Eastern Europe (%)
Place of birth for the foreign-born population - China (%)
Place of birth for the foreign-born population - Hong Kong (%)
Place of birth for the foreign-born population - Taiwan (%)
Place of birth for the foreign-born population - Japan (%)
Place of birth for the foreign-born population - Korea (%)
Place of birth for the foreign-born population - Other Eastern Asia (%)
Place of birth for the foreign-born population - Afghanistan (%)
Place of birth for the foreign-born population - Bangladesh (%)
Place of birth for the foreign-born population - India (%)
Place of birth for the foreign-born population - Iran (%)
Place of birth for the foreign-born population - Kazakhstan (%)
Place of birth for the foreign-born population - Nepal (%)
Place of birth for the foreign-born population - Pakistan (%)
Place of birth for the foreign-born population - Sri Lanka (%)
Place of birth for the foreign-born population - Uzbekistan (%)
Place of birth for the foreign-born population - Other South Central Asia (%)
Place of birth for the foreign-born population - Burma (%)
Place of birth for the foreign-born population - Cambodia (%)
Place of birth for the foreign-born population - Indonesia (%)
Place of birth for the foreign-born population - Laos (%)
Place of birth for the foreign-born population - Malaysia (%)
Place of birth for the foreign-born population - Philippines (%)
Place of birth for the foreign-born population - Singapore (%)
Place of birth for the foreign-born population - Thailand (%)
Place of birth for the foreign-born population - Vietnam (%)
Place of birth for the foreign-born population - Other South Eastern Asia (%)
Place of birth for the foreign-born population - Armenia (%)
Place of birth for the foreign-born population - Iraq (%)
Place of birth for the foreign-born population - Israel (%)
Place of birth for the foreign-born population - Jordan (%)
Place of birth for the foreign-born population - Kuwait (%)
Place of birth for the foreign-born population - Lebanon (%)
Place of birth for the foreign-born population - Saudi Arabia (%)
Place of birth for the foreign-born population - Syria (%)
Place of birth for the foreign-born population - Turkey (%)
Place of birth for the foreign-born population - Yemen (%)
Place of birth for the foreign-born population - Other Western Asia (%)
Place of birth for the foreign-born population - Eritrea (%)
Place of birth for the foreign-born population - Ethiopia (%)
Place of birth for the foreign-born population - Kenya (%)
Place of birth for the foreign-born population - Somalia (%)
Place of birth for the foreign-born population - Uganda (%)
Place of birth for the foreign-born population - Zimbabwe (%)
Place of birth for the foreign-born population - Other Eastern Africa (%)
Place of birth for the foreign-born population - Cameroon (%)
Place of birth for the foreign-born population - Congo (%)
Place of birth for the foreign-born population - Democratic Republic of Congo (Zaire) (%)
Place of birth for the foreign-born population - Other Middle Africa (%)
Place of birth for the foreign-born population - Egypt (%)
Place of birth for the foreign-born population - Morocco (%)
Place of birth for the foreign-born population - Sudan (%)
Place of birth for the foreign-born population - Other Northern Africa (%)
Place of birth for the foreign-born population - South Africa (%)
Place of birth for the foreign-born population - Other Southern Africa (%)
Place of birth for the foreign-born population - Cabo Verde (%)
Place of birth for the foreign-born population - Ghana (%)
Place of birth for the foreign-born population - Liberia (%)
Place of birth for the foreign-born population - Nigeria (%)
Place of birth for the foreign-born population - Senegal (%)
Place of birth for the foreign-born population - Sierra Leone (%)
Place of birth for the foreign-born population - Other Western Africa (%)
Place of birth for the foreign-born population - Australia (%)
Place of birth for the foreign-born population - New Zealand (%)
Place of birth for the foreign-born population - Fiji (%)
Place of birth for the foreign-born population - Micronesia (%)
Place of birth for the foreign-born population - Bahamas (%)
Place of birth for the foreign-born population - Barbados (%)
Place of birth for the foreign-born population - Cuba (%)
Place of birth for the foreign-born population - Dominica (%)
Place of birth for the foreign-born population - Dominican Republic (%)
Place of birth for the foreign-born population - Grenada (%)
Place of birth for the foreign-born population - Haiti (%)
Place of birth for the foreign-born population - Jamaica (%)
Place of birth for the foreign-born population - St. Vincent and the Grenadines (%)
Place of birth for the foreign-born population - Trinidad and Tobago (%)
Place of birth for the foreign-born population - West Indies (%)
Place of birth for the foreign-born population - Other Caribbean (%)
Place of birth for the foreign-born population - Belize (%)
Place of birth for the foreign-born population - Costa Rica (%)
Place of birth for the foreign-born population - El Salvador (%)
Place of birth for the foreign-born population - Guatemala (%)
Place of birth for the foreign-born population - Honduras (%)
Place of birth for the foreign-born population - Mexico (%)
Place of birth for the foreign-born population - Nicaragua (%)
Place of birth for the foreign-born population - Panama (%)
Place of birth for the foreign-born population - Other Central America (%)
Place of birth for the foreign-born population - Argentina (%)
Place of birth for the foreign-born population - Bolivia (%)
Place of birth for the foreign-born population - Brazil (%)
Place of birth for the foreign-born population - Chile (%)
Place of birth for the foreign-born population - Colombia (%)
Place of birth for the foreign-born population - Ecuador (%)
Place of birth for the foreign-born population - Guyana (%)
Place of birth for the foreign-born population - Peru (%)
Place of birth for the foreign-born population - Uruguay (%)
Place of birth for the foreign-born population - Venezuela (%)
Place of birth for the foreign-born population - Other South America (%)
Place of birth for the foreign-born population - Canada (%)
Place of birth for the foreign-born population - Other Northern America (%)
Place of birth for the foreign-born population - Other (%)
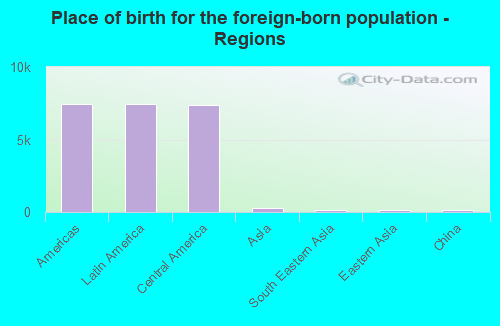
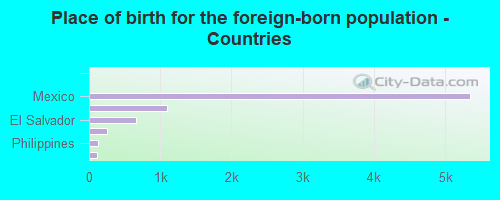
According to 2022 data, the most numerous races in Willowbrook, CA are Hispanic (18,547 residents), White alone (208 residents), and Asian alone (291 residents). 25.1% of Willowbrook residents speak English at home. 33.7% of Willowbrook, CA residents are foreign-born (32.1% born in Latin America), which is 22.8% greater than the foreign-born rate of 26.0% across the entire state of California.
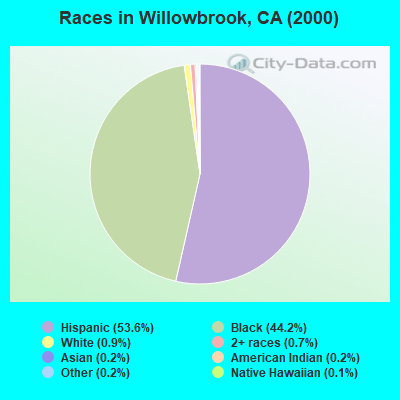
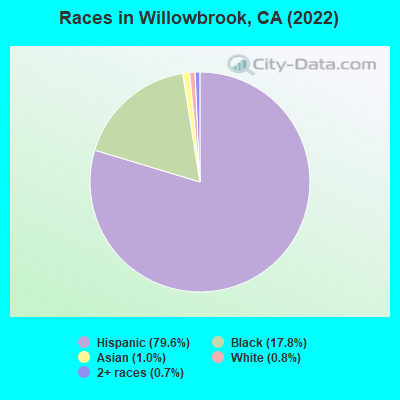
Race distribution in Willowbrook
2000 2022
15,816,790 46.7% White alone 10,966,556 32.4% Hispanic 3,648,860 10.8% Asian alone 2,181,926 6.4% Black alone 903,115 2.7% Two or more races 178,984 0.5% American Indian alone 103,736 0.3% Native Hawaiian and Other 71,681 0.2% Other race alone
15,732,184 40.3% Hispanic 13,160,426 33.7% White alone 5,957,867 15.3% Asian alone 2,025,218 5.2% Black alone 1,663,222 4.3% Two or more races 251,618 0.6% Other race alone 135,777 0.3% Native Hawaiian and Other 103,030 0.3% American Indian alone
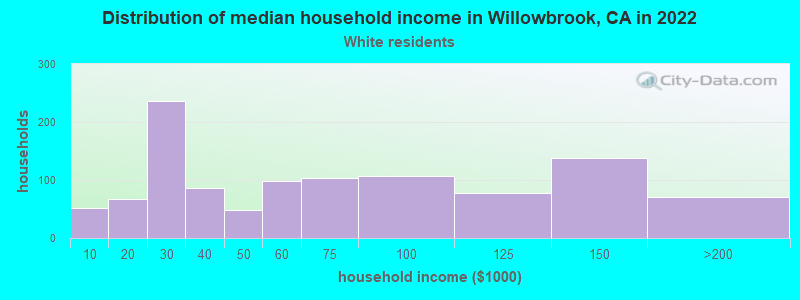
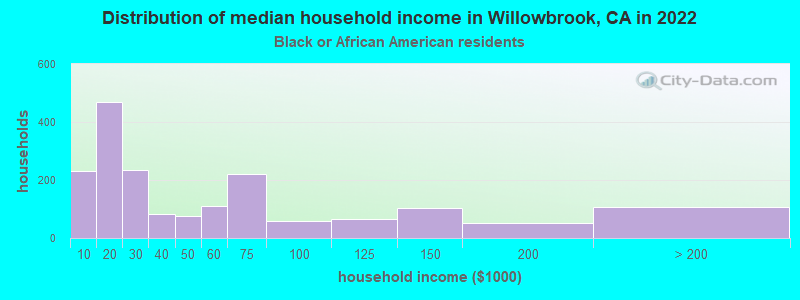
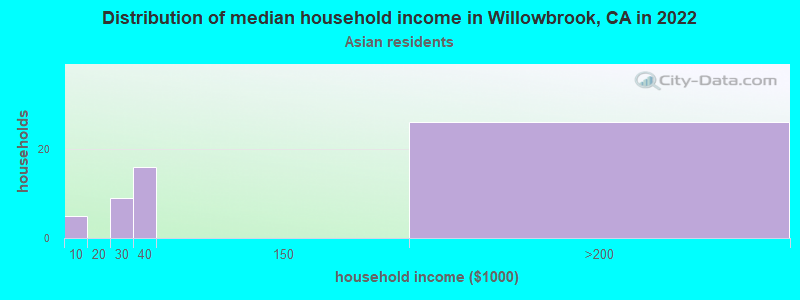
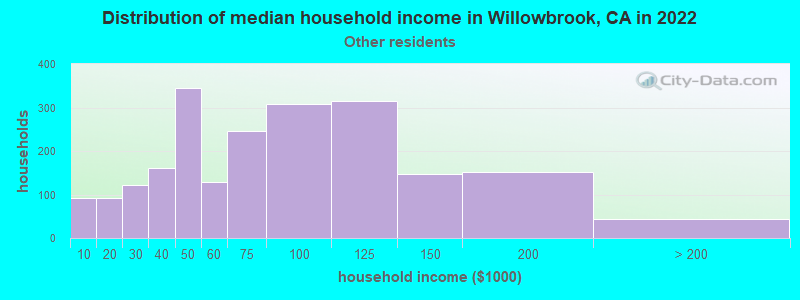
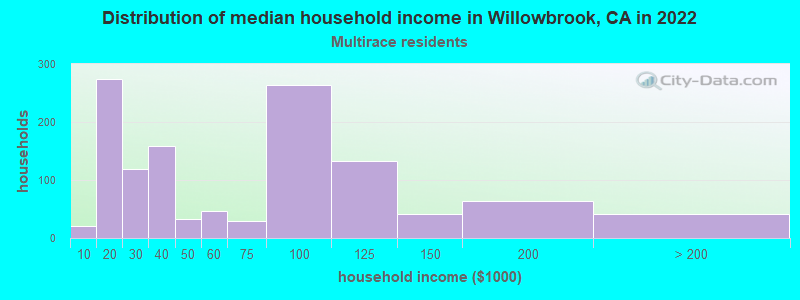
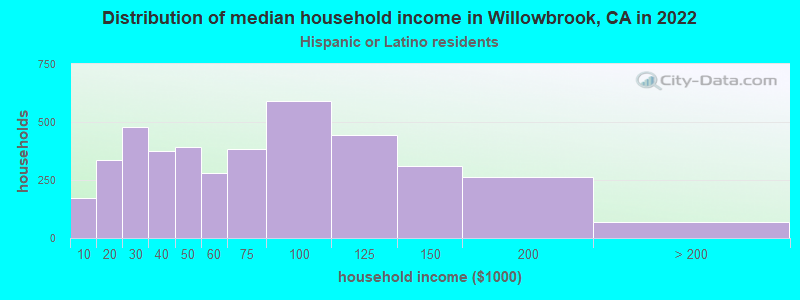
Income and house value in Willowbrook Median household income in 2022 $67,509 White non-Hispanic householders$37,779 Black householders$20,297 American Indian and Alaska Native householders$36,191 Asian householders$3,482 Native Hawaiian and other Pacific Islander householders$89,849 Some other race householders$63,559 Two or more races householders$73,770 Hispanic or Latino race householdersMedian 2022 house value $521,897 White Non-Hispanic householders$496,342 Black or African American householders$469,348 American Indian or Alaska Native householders over $1,000,000 Asian householders$404,920 Native Hawaiian and other Pacific Islander householders$431,915 Some other race householders$541,334 Two or more races householders$443,073 Hispanic or Latino householders
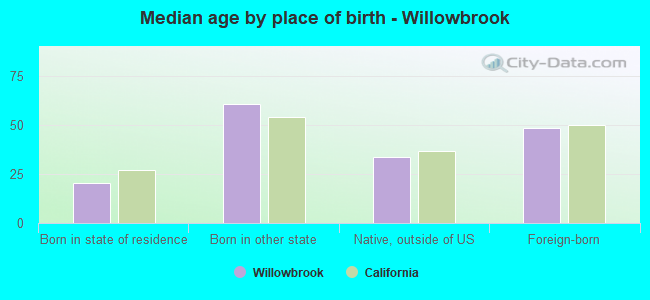
Median age by race in Willowbrook
27.8 Median age for White residents27.3 30.1 32.0 Median age for Black or African American residents33.4 30.1 34.1 Median age for American Indian / Alaska Native residents33.5 43.3 48.6 Median age for Asian residents43.1 63.1 15.4 Median age for Native Hawaiian / Pacific Islander residents45.0 14.0 27.8 Median age for Other race residents28.0 27.7 12.0 Median age for Two or more races residents11.4 66.6 35.9 Median age for White alone residents36.2 30.2 27.7 Median age for Hispanic or Latino residents27.4 27.9
Owner/renter occupied households by race in Willowbrook
House owners and renters - White residents 736 45.5% Owner occupied880 54.5% Renter occupiedHouse owners and renters - Black or African American residents 326 23.1% Owner occupied1,083 76.9% Renter occupiedHouse owners and renters - American Indian / Alaska Native residents 69 100.0% Owner occupiedHouse owners and renters - Asian residents 71 93.1% Owner occupied5 6.9% Renter occupiedHouse owners and renters - Other race residents 890 47.7% Owner occupied976 52.3% Renter occupiedHouse owners and renters - Two or more races residents 83 70.0% Owner occupied36 30.0% Renter occupiedHouse owners and renters - White alone residents 10 43.2% Owner occupied14 56.8% Renter occupiedHouse owners and renters - Hispanic or Latino residents 1,749 46.7% Owner occupied1,993 53.3% Renter occupied
Language usage in Willowbrook
English speakers - Total 25.1% of residents of Willowbrook speak English at home.
72.1% of residents speak Spanish at home 9,773 66.2% Speak English very well4,985 33.8% Speak English less than very well1.9% of residents speak other language at home 138 35.3% Speak English very well253 64.7% Speak English less than very well
English speakers - Born in the United States 83.2% of residents of Willowbrook speak English at home.
13.2% of residents speak Spanish at home 109 87.2% Speak English very well16 12.8% Speak English less than very well3.4% of residents speak other language at home 8 25.0% Speak English very well24 75.0% Speak English less than very well
English speakers - Native, born elsewhere 20.2% of residents of Willowbrook speak English at home.
82.4% of residents speak Spanish at home 98 100.0% Speak English very well
English speakers - Foreign-born 1.2% of residents of Willowbrook speak English at home.
92.1% of residents speak Spanish at home 2,476 36.0% Speak English very well4,400 64.0% Speak English less than very well3.2% of residents speak other language at home 15 6.2% Speak English very well227 93.8% Speak English less than very well
White (Caucasian) - Speak only English Native:
22.3% (871)Foreign-born:
1.5% (43)
White (Caucasian) - Speak another language Native:
61.5% (2,401)Foreign-born:
93.8% (2,639)
Black or African American - Speak another language Native:
4.4% (143)Foreign-born:
100.0% (17)
Asian - Speak only English Native:
62.8% (29)Foreign-born:
4.7% (12)
Asian - Speak another language Native:
37.5% (17)Foreign-born:
94.6% (246)
Other race - Speak only English Native:
13.5% (715)Foreign-born:
1.1% (34)
Other race - Speak another language Native:
83.9% (4,439)Foreign-born:
97.7% (3,087)
Two or more races - Speak another language Native:
67.0% (126)Foreign-born:
100.0% (137)
Hispanic or Latino - Speak only English Native:
16.7% (1,631)Foreign-born:
1.5% (102)
Hispanic or Latino - Speak another language Native:
81.0% (7,904)Foreign-born:
97.6% (6,721)
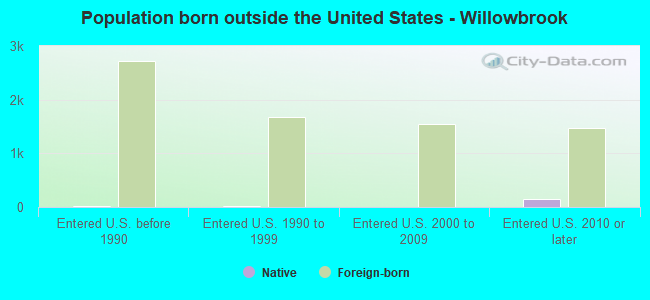
Foreign-born residents in Willowbrook 7,668 residents are foreign born (32.1% Latin America ).
This city:
33.7%California:
100.0%
Marital status for residents in Willowbrook Marital status - White (Caucasian) population 15 years and over
Males 53.0% Never married41.1% Now married0.8% Separated2.1% Widowed3.0% DivorcedFemales 43.9% Never married40.0% Now married2.0% Separated6.8% Widowed7.3% DivorcedWomen who gave birth in the past 12 months Now married:
26.6% (16)Unmarried:
73.4% (45)
Women who did not give birth in the past 12 months Now married:
34.3% (593)Unmarried:
65.7% (1,135)
Marital status - Black or African American population 15 years and over
Males 62.6% Never married13.3% Now married6.6% Separated3.9% Widowed13.6% DivorcedFemales 65.2% Never married9.6% Now married4.8% Separated10.7% Widowed9.7% DivorcedWomen who gave birth in the past 12 months Now married:
0.0% (0)Unmarried:
100.0% (60)
Women who did not give birth in the past 12 months Now married:
11.7% (116)Unmarried:
88.3% (873)
Marital status - American Indian / Alaska Native population 15 years and over
Males 100.0% Never married0.0% Now married0.0% Separated0.0% Widowed0.0% DivorcedFemales 38.9% Never married61.1% Now married0.0% Separated0.0% Widowed0.0% DivorcedWomen who gave birth in the past 12 months Now married:
0.0% (0)Unmarried:
100.0% (51)
Women who did not give birth in the past 12 months Now married:
100.0% (66)Unmarried:
0.0% (0)
Marital status - Asian population 15 years and over
Males 21.2% Never married66.7% Now married0.0% Separated0.0% Widowed12.2% DivorcedFemales 55.6% Never married42.7% Now married0.0% Separated1.7% Widowed0.0% DivorcedWomen who did not give birth in the past 12 months Now married:
33.3% (13)Unmarried:
66.7% (26)
Marital status - Other race population 15 years and over
Males 54.5% Never married43.6% Now married0.4% Separated0.8% Widowed0.7% DivorcedFemales 44.7% Never married46.2% Now married2.0% Separated2.4% Widowed4.7% DivorcedWomen who gave birth in the past 12 months Now married:
71.3% (166)Unmarried:
28.7% (67)
Women who did not give birth in the past 12 months Now married:
40.4% (951)Unmarried:
59.6% (1,405)
Marital status - Two or more races population 15 years and over
Males 0.0% Never married100.0% Now married0.0% Separated0.0% Widowed0.0% DivorcedFemales 28.2% Never married0.0% Now married0.0% Separated17.9% Widowed53.8% DivorcedWomen who did not give birth in the past 12 months Now married:
0.0% (0)Unmarried:
100.0% (53)
Marital status - White alone, not Hispanic / Latino population 15 years and over
Males 45.4% Never married35.1% Now married0.0% Separated0.0% Widowed19.6% DivorcedFemales 33.7% Never married59.6% Now married3.4% Separated0.0% Widowed3.4% DivorcedWomen who gave birth in the past 12 months Now married:
0.0% (0)Unmarried:
100.0% (14)
Women who did not give birth in the past 12 months Now married:
75.9% (40)Unmarried:
24.1% (13)
Marital status - Hispanic or Latino population 15 years and over
Males 53.7% Never married42.2% Now married0.6% Separated1.5% Widowed2.0% DivorcedFemales 44.3% Never married42.6% Now married1.9% Separated4.8% Widowed6.4% DivorcedWomen who gave birth in the past 12 months Now married:
62.5% (175)Unmarried:
37.5% (105)
Women who did not give birth in the past 12 months Now married:
36.5% (1,595)Unmarried:
63.5% (2,769)
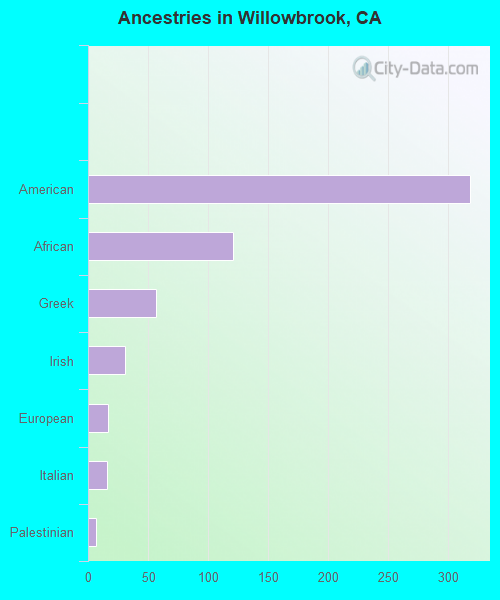
Ancestries in Willowbrook
684 3.7% American204 1.1% European120 0.7% African10 0.05% Jordanian9 0.05% Italian2 0.01% Russian
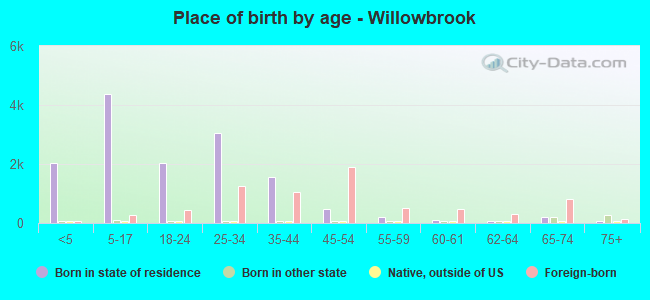
Children Nativity (place of birth) in Willowbrook
Children under 6 years - Living with two parents Both parents native 398 100.0% NativeBoth parents foreign-born 418 100.0% NativeOne native, one foreign-born parent 145 100.0% NativeChildren under 6 years - Living with one parent Native parent 949 99.9% Native1 0.1% Foreign-bornForeign-born parent 349 92.9% Native27 7.1% Foreign-bornChildren 6 to 17 years - Living with two parents Both parents native 457 100.0% NativeBoth parents foreign-born 1,049 91.4% Native99 8.6% Foreign-bornOne native, one foreign-born parent 398 100.0% NativeChildren 6 to 17 years - Living with one parent Native parent 1,227 100.0% NativeForeign-born parent 867 56.1% Native679 43.9% Foreign-born
Grandparents responsible for own grandchildren in Willowbrook
Grandparents (30 to 59 years) White / Caucasian 13 6.8% Responsible for grandchildren183 93.2% Not responsible for grandchildrenBlack or African American 79 100.0% Not responsible for grandchildrenAmerican Indian / Alaska Native 61 100.0% Not responsible for grandchildrenOther race 93 30.4% Responsible for grandchildren212 69.6% Not responsible for grandchildrenTwo or more races 12 100.0% Responsible for grandchildrenHispanic or Latino 100 17.4% Responsible for grandchildren476 82.6% Not responsible for grandchildrenGrandparents (60 years and over) White / Caucasian 53 32.8% Responsible for grandchildren108 67.2% Not responsible for grandchildrenBlack or African American 44 100.0% Not responsible for grandchildrenOther race 231 100.0% Not responsible for grandchildrenTwo or more races 88 100.0% Not responsible for grandchildrenHispanic or Latino 70 16.7% Responsible for grandchildren351 83.3% Not responsible for grandchildren