Races in Winchester, Nevada (NV) Detailed Stats
Data:
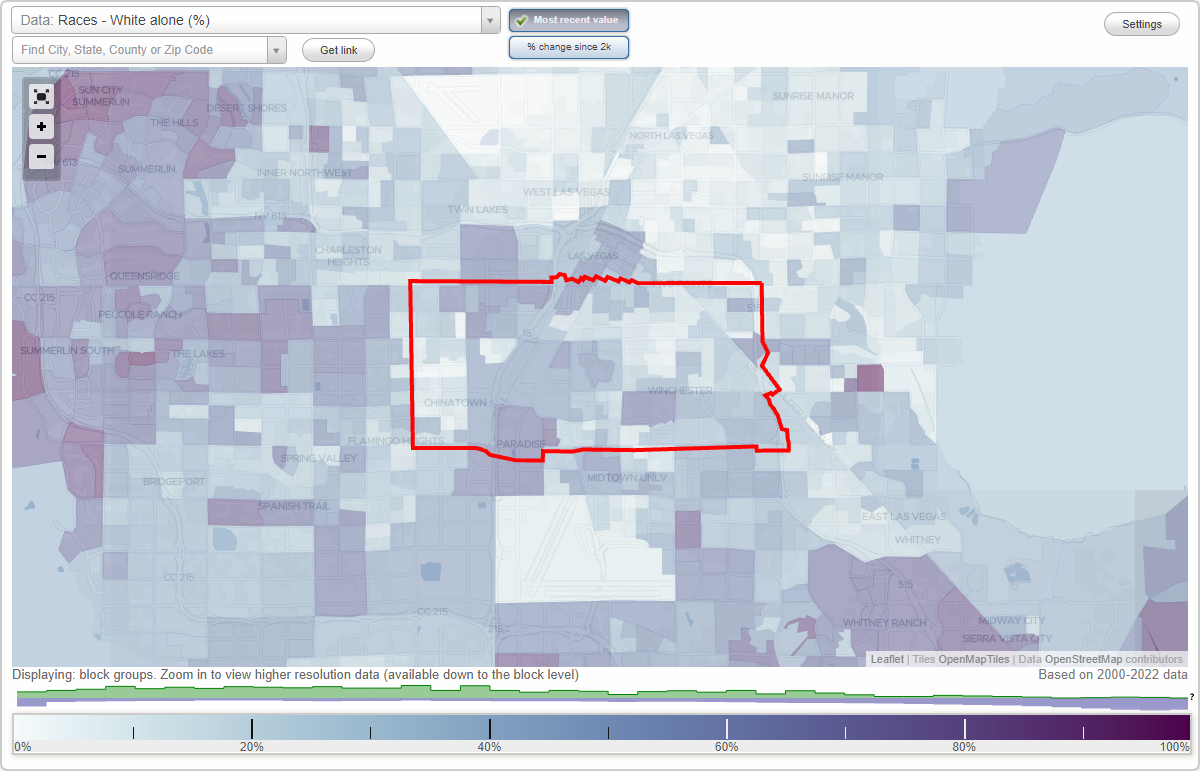
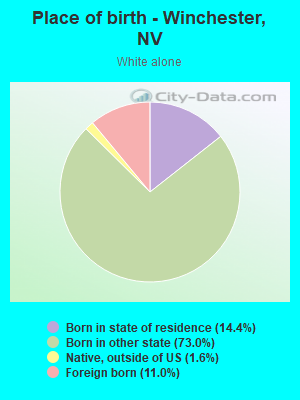
Races - White alone (%)
Races - White alone (% change since 2000)
Races - Black alone (%)
Races - Black alone (% change since 2000)
Races - American Indian alone (%)
Races - American Indian alone (% change since 2000)
Races - Asian alone (%)
Races - Asian alone (% change since 2000)
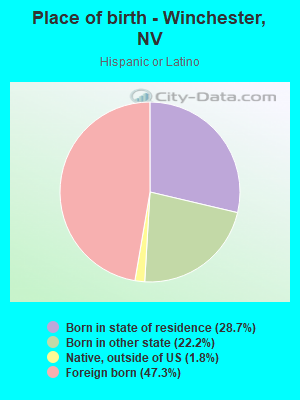
Races - Hispanic (%)
Races - Hispanic (% change since 2000)
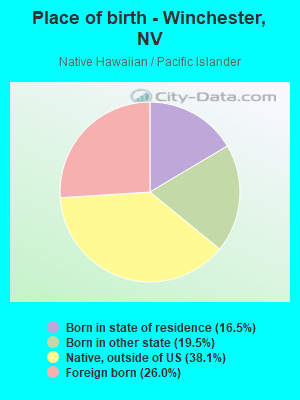
Races - Native Hawaiian and Other Pacific Islander alone (%)
Races - Native Hawaiian and Other Pacific Islander alone (% change since 2000)
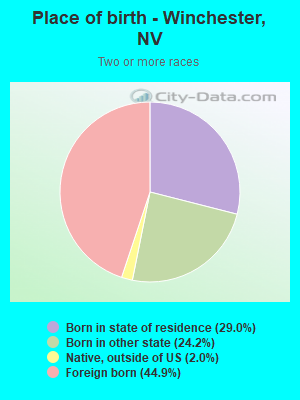
Races - Two or more races(%)
Races - Two or more races(% change since 2000)
Races - Other race alone (%)
Races - Other race alone (% change since 2000)
Racial diversity
Place of birth - Born in state of residence (%)
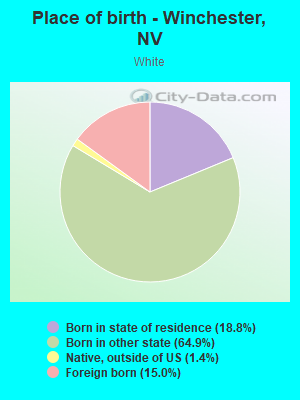
Place of birth - Born in state of residence (%) - White
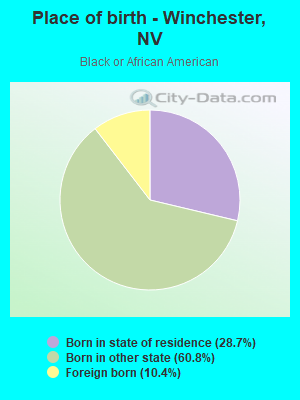
Place of birth - Born in state of residence (%) - Black or African American
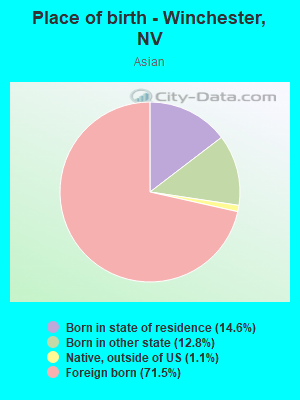
Place of birth - Born in state of residence (%) - Asian
Place of birth - Born in state of residence (%) - Hispanic or Latino
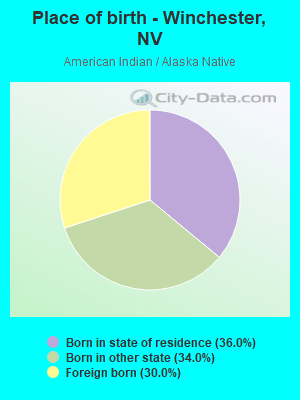
Place of birth - Born in state of residence (%) - American Indian and Alaska Native
Place of birth - Born in state of residence (%) - Multirace
Place of birth - Born in state of residence (%) - Other Race
Place of birth - Born in other state (%)
Place of birth - Born in other state (%) - White
Place of birth - Born in other state (%) - Black or African American
Place of birth - Born in other state (%) - Asian
Place of birth - Born in other state (%) - Hispanic or Latino
Place of birth - Born in other state (%) - American Indian and Alaska Native
Place of birth - Born in other state (%) - Multirace
Place of birth - Born in other state (%) - Other Race
Place of birth - Native, outside of US (%)
Place of birth - Native, outside of US (%) - White
Place of birth - Native, outside of US (%) - Black or African American
Place of birth - Native, outside of US (%) - Asian
Place of birth - Native, outside of US (%) - Hispanic or Latino
Place of birth - Native, outside of US (%) - American Indian and Alaska Native
Place of birth - Native, outside of US (%) - Multirace
Place of birth - Native, outside of US (%) - Other Race
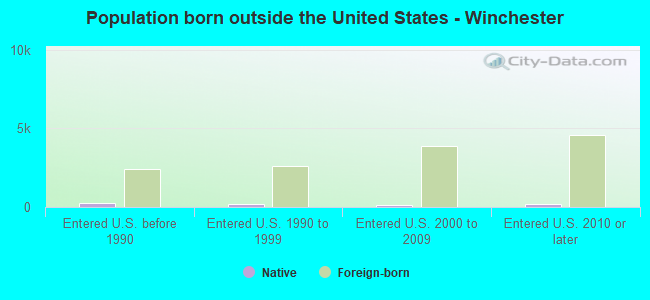
Place of birth - Foreign born (%)
Place of birth - Foreign born (%) - White
Place of birth - Foreign born (%) - Black or African American
Place of birth - Foreign born (%) - Asian
Place of birth - Foreign born (%) - Hispanic or Latino
Place of birth - Foreign born (%) - American Indian and Alaska Native
Place of birth - Foreign born (%) - Multirace
Place of birth - Foreign born (%) - Other Race
Residents speaking English at home (%)
Residents speaking English at home - Born in the United States (%)
Residents speaking English at home - Native, born elsewhere (%)
Residents speaking English at home - Foreign born (%)
Residents speaking Spanish at home (%)
Residents speaking Spanish at home - Born in the United States (%)
Residents speaking Spanish at home - Native, born elsewhere (%)
Residents speaking Spanish at home - Foreign born (%)
Residents speaking other language at home (%)
Residents speaking other language at home - Born in the United States (%)
Residents speaking other language at home - Native, born elsewhere (%)
Residents speaking other language at home - Foreign born (%)
Marital status - Never married (%)
Marital status - Now married (%)
Marital status - Separated (%)
Marital status - Widowed (%)
Marital status - Divorced (%)
Ancestries Reported - Arab (%)
Ancestries Reported - Czech (%)
Ancestries Reported - Danish (%)
Ancestries Reported - Dutch (%)
Ancestries Reported - English (%)
Ancestries Reported - French (%)
Ancestries Reported - French Canadian (%)
Ancestries Reported - German (%)
Ancestries Reported - Greek (%)
Ancestries Reported - Hungarian (%)
Ancestries Reported - Irish (%)
Ancestries Reported - Italian (%)
Ancestries Reported - Lithuanian (%)
Ancestries Reported - Norwegian (%)
Ancestries Reported - Polish (%)
Ancestries Reported - Portuguese (%)
Ancestries Reported - Russian (%)
Ancestries Reported - Scotch-Irish (%)
Ancestries Reported - Scottish (%)
Ancestries Reported - Slovak (%)
Ancestries Reported - Subsaharan African (%)
Ancestries Reported - Swedish (%)
Ancestries Reported - Swiss (%)
Ancestries Reported - Ukrainian (%)
Ancestries Reported - United States (%)
Ancestries Reported - Welsh (%)
Ancestries Reported - West Indian (%)
Ancestries Reported - Other (%)
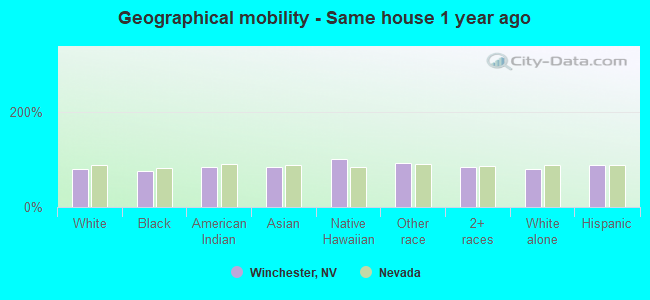
Geographical mobility - Same house 1 year ago (%)
Geographical mobility - Same house 1 year ago (%) - White
Geographical mobility - Same house 1 year ago (%) - Black or African American
Geographical mobility - Same house 1 year ago (%) - Asian
Geographical mobility - Same house 1 year ago (%) - Hispanic or Latino
Geographical mobility - Same house 1 year ago (%) - American Indian and Alaska Native
Geographical mobility - Same house 1 year ago (%) - Multirace
Geographical mobility - Same house 1 year ago (%) - Other Race
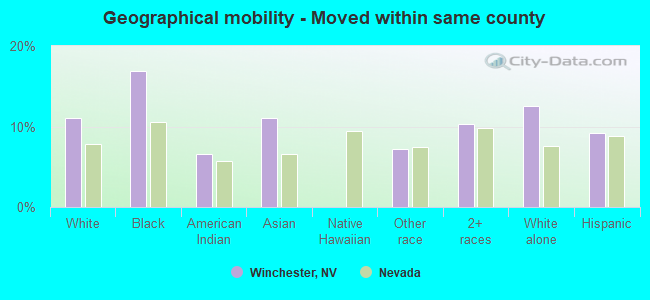
Geographical mobility - Moved within same county (%)
Geographical mobility - Moved within same county (%) - White
Geographical mobility - Moved within same county (%) - Black or African American
Geographical mobility - Moved within same county (%) - Asian
Geographical mobility - Moved within same county (%) - Hispanic or Latino
Geographical mobility - Moved within same county (%) - American Indian and Alaska Native
Geographical mobility - Moved within same county (%) - Multirace
Geographical mobility - Moved within same county (%) - Other Race
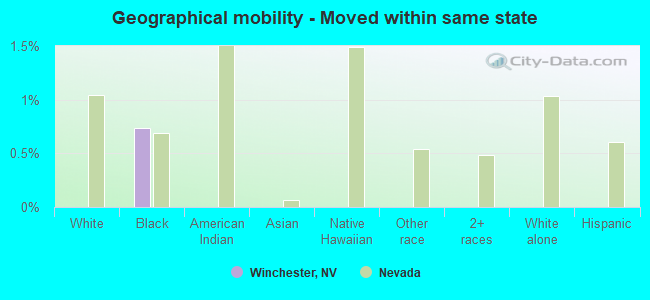
Geographical mobility - Moved from different county within same state (%)
Geographical mobility - Moved from different county within same state (%) - White
Geographical mobility - Moved from different county within same state (%) - Black or African American
Geographical mobility - Moved from different county within same state (%) - Asian
Geographical mobility - Moved from different county within same state (%) - Hispanic or Latino
Geographical mobility - Moved from different county within same state (%) - American Indian and Alaska Native
Geographical mobility - Moved from different county within same state (%) - Multirace
Geographical mobility - Moved from different county within same state (%) - Other Race
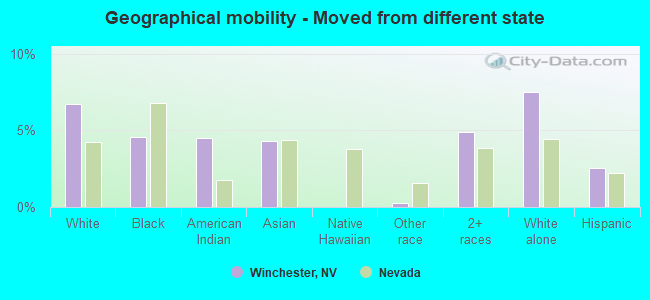
Geographical mobility - Moved from different state (%)
Geographical mobility - Moved from different state (%) - White
Geographical mobility - Moved from different state (%) - Black or African American
Geographical mobility - Moved from different state (%) - Asian
Geographical mobility - Moved from different state (%) - Hispanic or Latino
Geographical mobility - Moved from different state (%) - American Indian and Alaska Native
Geographical mobility - Moved from different state (%) - Multirace
Geographical mobility - Moved from different state (%) - Other Race
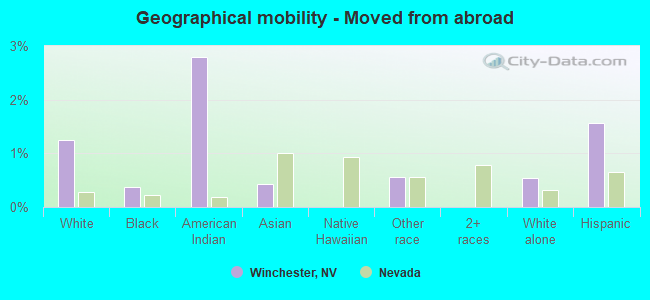
Geographical mobility - Moved from abroad (%)
Geographical mobility - Moved from abroad (%) - White
Geographical mobility - Moved from abroad (%) - Black or African American
Geographical mobility - Moved from abroad (%) - Asian
Geographical mobility - Moved from abroad (%) - Hispanic or Latino
Geographical mobility - Moved from abroad (%) - American Indian and Alaska Native
Geographical mobility - Moved from abroad (%) - Multirace
Geographical mobility - Moved from abroad (%) - Other Race
Place of birth for the foreign-born population - Ireland (%)
Place of birth for the foreign-born population - Denmark (%)
Place of birth for the foreign-born population - Norway (%)
Place of birth for the foreign-born population - Sweden (%)
Place of birth for the foreign-born population - United Kingdom (%)
Place of birth for the foreign-born population - England (%)
Place of birth for the foreign-born population - Scotland (%)
Place of birth for the foreign-born population - Other Northern Europe (%)
Place of birth for the foreign-born population - Austria (%)
Place of birth for the foreign-born population - Belgium (%)
Place of birth for the foreign-born population - France (%)
Place of birth for the foreign-born population - Germany (%)
Place of birth for the foreign-born population - Netherlands (%)
Place of birth for the foreign-born population - Switzerland (%)
Place of birth for the foreign-born population - Other Western Europe (%)
Place of birth for the foreign-born population - Greece (%)
Place of birth for the foreign-born population - Italy (%)
Place of birth for the foreign-born population - Portugal (%)
Place of birth for the foreign-born population - Spain (%)
Place of birth for the foreign-born population - Other Southern Europe (%)
Place of birth for the foreign-born population - Albania (%)
Place of birth for the foreign-born population - Belarus (%)
Place of birth for the foreign-born population - Bosnia and Herzegovina (%)
Place of birth for the foreign-born population - Bulgaria (%)
Place of birth for the foreign-born population - Croatia (%)
Place of birth for the foreign-born population - Czechoslovakia (%)
Place of birth for the foreign-born population - Hungary (%)
Place of birth for the foreign-born population - Latvia (%)
Place of birth for the foreign-born population - Lithuania (%)
Place of birth for the foreign-born population - North Macedonia (Macedonia) (%)
Place of birth for the foreign-born population - Moldova (%)
Place of birth for the foreign-born population - Poland (%)
Place of birth for the foreign-born population - Romania (%)
Place of birth for the foreign-born population - Russia (%)
Place of birth for the foreign-born population - Serbia (%)
Place of birth for the foreign-born population - Ukraine (%)
Place of birth for the foreign-born population - Other Eastern Europe (%)
Place of birth for the foreign-born population - China (%)
Place of birth for the foreign-born population - Hong Kong (%)
Place of birth for the foreign-born population - Taiwan (%)
Place of birth for the foreign-born population - Japan (%)
Place of birth for the foreign-born population - Korea (%)
Place of birth for the foreign-born population - Other Eastern Asia (%)
Place of birth for the foreign-born population - Afghanistan (%)
Place of birth for the foreign-born population - Bangladesh (%)
Place of birth for the foreign-born population - India (%)
Place of birth for the foreign-born population - Iran (%)
Place of birth for the foreign-born population - Kazakhstan (%)
Place of birth for the foreign-born population - Nepal (%)
Place of birth for the foreign-born population - Pakistan (%)
Place of birth for the foreign-born population - Sri Lanka (%)
Place of birth for the foreign-born population - Uzbekistan (%)
Place of birth for the foreign-born population - Other South Central Asia (%)
Place of birth for the foreign-born population - Burma (%)
Place of birth for the foreign-born population - Cambodia (%)
Place of birth for the foreign-born population - Indonesia (%)
Place of birth for the foreign-born population - Laos (%)
Place of birth for the foreign-born population - Malaysia (%)
Place of birth for the foreign-born population - Philippines (%)
Place of birth for the foreign-born population - Singapore (%)
Place of birth for the foreign-born population - Thailand (%)
Place of birth for the foreign-born population - Vietnam (%)
Place of birth for the foreign-born population - Other South Eastern Asia (%)
Place of birth for the foreign-born population - Armenia (%)
Place of birth for the foreign-born population - Iraq (%)
Place of birth for the foreign-born population - Israel (%)
Place of birth for the foreign-born population - Jordan (%)
Place of birth for the foreign-born population - Kuwait (%)
Place of birth for the foreign-born population - Lebanon (%)
Place of birth for the foreign-born population - Saudi Arabia (%)
Place of birth for the foreign-born population - Syria (%)
Place of birth for the foreign-born population - Turkey (%)
Place of birth for the foreign-born population - Yemen (%)
Place of birth for the foreign-born population - Other Western Asia (%)
Place of birth for the foreign-born population - Eritrea (%)
Place of birth for the foreign-born population - Ethiopia (%)
Place of birth for the foreign-born population - Kenya (%)
Place of birth for the foreign-born population - Somalia (%)
Place of birth for the foreign-born population - Uganda (%)
Place of birth for the foreign-born population - Zimbabwe (%)
Place of birth for the foreign-born population - Other Eastern Africa (%)
Place of birth for the foreign-born population - Cameroon (%)
Place of birth for the foreign-born population - Congo (%)
Place of birth for the foreign-born population - Democratic Republic of Congo (Zaire) (%)
Place of birth for the foreign-born population - Other Middle Africa (%)
Place of birth for the foreign-born population - Egypt (%)
Place of birth for the foreign-born population - Morocco (%)
Place of birth for the foreign-born population - Sudan (%)
Place of birth for the foreign-born population - Other Northern Africa (%)
Place of birth for the foreign-born population - South Africa (%)
Place of birth for the foreign-born population - Other Southern Africa (%)
Place of birth for the foreign-born population - Cabo Verde (%)
Place of birth for the foreign-born population - Ghana (%)
Place of birth for the foreign-born population - Liberia (%)
Place of birth for the foreign-born population - Nigeria (%)
Place of birth for the foreign-born population - Senegal (%)
Place of birth for the foreign-born population - Sierra Leone (%)
Place of birth for the foreign-born population - Other Western Africa (%)
Place of birth for the foreign-born population - Australia (%)
Place of birth for the foreign-born population - New Zealand (%)
Place of birth for the foreign-born population - Fiji (%)
Place of birth for the foreign-born population - Micronesia (%)
Place of birth for the foreign-born population - Bahamas (%)
Place of birth for the foreign-born population - Barbados (%)
Place of birth for the foreign-born population - Cuba (%)
Place of birth for the foreign-born population - Dominica (%)
Place of birth for the foreign-born population - Dominican Republic (%)
Place of birth for the foreign-born population - Grenada (%)
Place of birth for the foreign-born population - Haiti (%)
Place of birth for the foreign-born population - Jamaica (%)
Place of birth for the foreign-born population - St. Vincent and the Grenadines (%)
Place of birth for the foreign-born population - Trinidad and Tobago (%)
Place of birth for the foreign-born population - West Indies (%)
Place of birth for the foreign-born population - Other Caribbean (%)
Place of birth for the foreign-born population - Belize (%)
Place of birth for the foreign-born population - Costa Rica (%)
Place of birth for the foreign-born population - El Salvador (%)
Place of birth for the foreign-born population - Guatemala (%)
Place of birth for the foreign-born population - Honduras (%)
Place of birth for the foreign-born population - Mexico (%)
Place of birth for the foreign-born population - Nicaragua (%)
Place of birth for the foreign-born population - Panama (%)
Place of birth for the foreign-born population - Other Central America (%)
Place of birth for the foreign-born population - Argentina (%)
Place of birth for the foreign-born population - Bolivia (%)
Place of birth for the foreign-born population - Brazil (%)
Place of birth for the foreign-born population - Chile (%)
Place of birth for the foreign-born population - Colombia (%)
Place of birth for the foreign-born population - Ecuador (%)
Place of birth for the foreign-born population - Guyana (%)
Place of birth for the foreign-born population - Peru (%)
Place of birth for the foreign-born population - Uruguay (%)
Place of birth for the foreign-born population - Venezuela (%)
Place of birth for the foreign-born population - Other South America (%)
Place of birth for the foreign-born population - Canada (%)
Place of birth for the foreign-born population - Other Northern America (%)
Place of birth for the foreign-born population - Other (%)
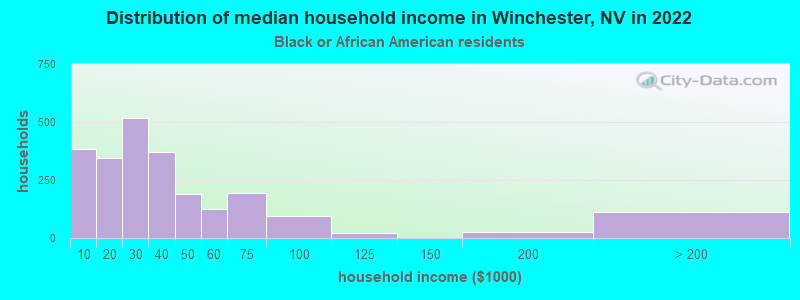
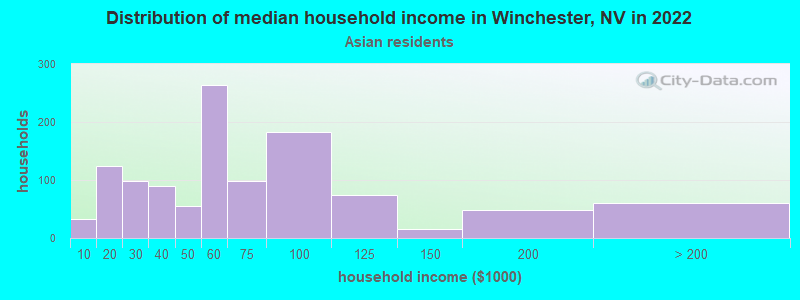
According to 2022 data, the most numerous races in Winchester, NV are White alone (8,784 residents), Hispanic (19,995 residents), and Black alone (4,862 residents). 48.7% of Winchester residents speak English at home. 34.4% of Winchester, NV residents are foreign-born (25.5% born in Latin America, 6.6% born in Asia), which is 47.6% greater than the foreign-born rate of 18.0% across the entire state of Nevada.
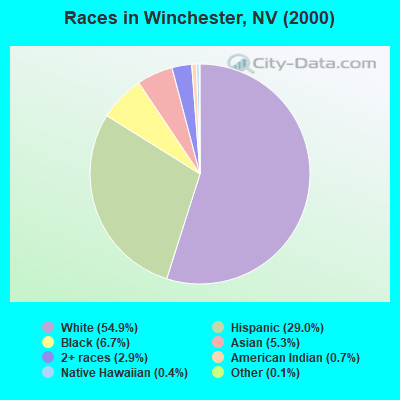
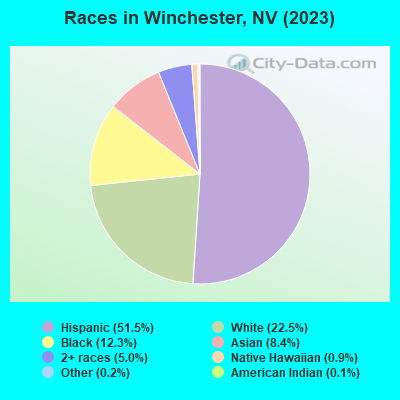
Race distribution in Winchester
2000 2022
1,303,001 65.2% White alone 393,970 19.7% Hispanic 131,509 6.6% Black alone 88,593 4.4% Asian alone 49,231 2.5% Two or more races 21,397 1.1% American Indian alone 7,769 0.4% Native Hawaiian and Other 2,787 0.1% Other race alone
1,410,145 44.4% White alone 961,357 30.3% Hispanic 286,471 9.0% Black alone 281,149 8.8% Asian alone 182,151 5.7% Two or more races 20,102 0.6% Native Hawaiian and Other 18,781 0.6% Other race alone 17,616 0.6% American Indian alone
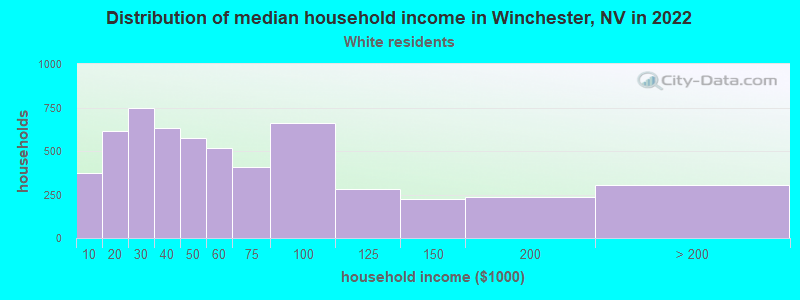
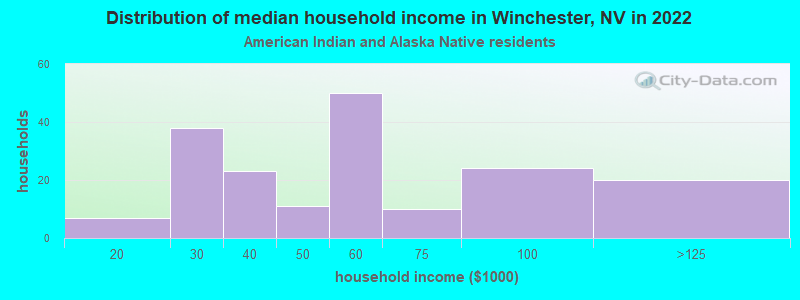
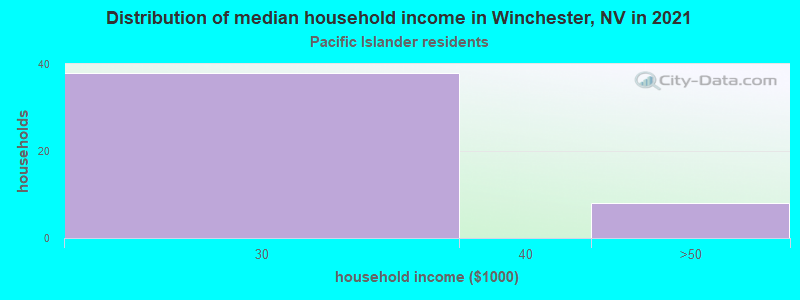
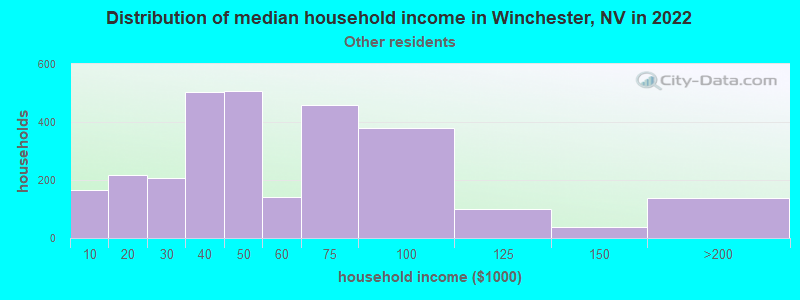
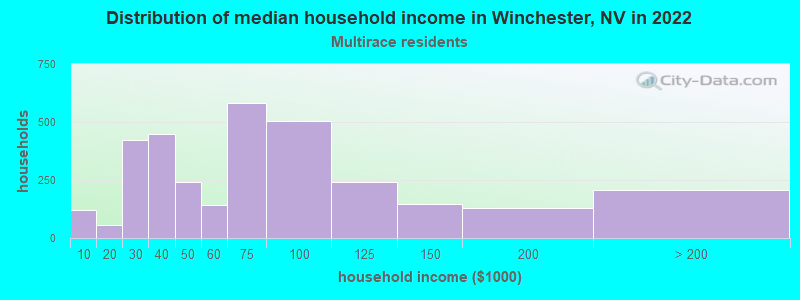
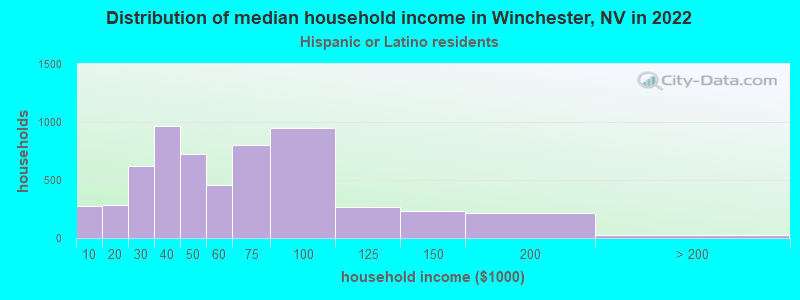
Income and house value in Winchester Median household income in 2022 $44,686 White non-Hispanic householders$28,676 Black householders$49,265 American Indian and Alaska Native householders$54,531 Asian householders$44,129 Native Hawaiian and other Pacific Islander householders$46,217 Some other race householders$65,186 Two or more races householders$49,020 Hispanic or Latino race householdersMedian 2022 house value $355,498 White Non-Hispanic householders$329,919 Black or African American householders$381,659 American Indian or Alaska Native householders $333,116 Asian householders$654,024 Native Hawaiian and other Pacific Islander householders$343,290 Some other race householders$386,019 Two or more races householders$314,803 Hispanic or Latino householders
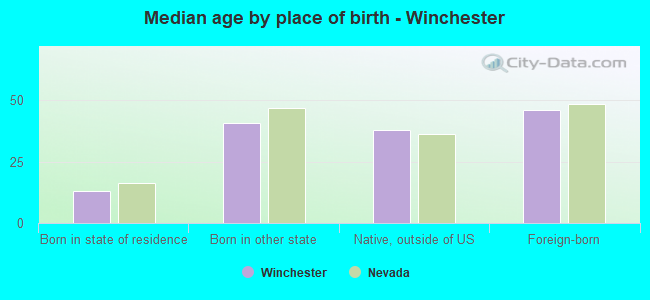
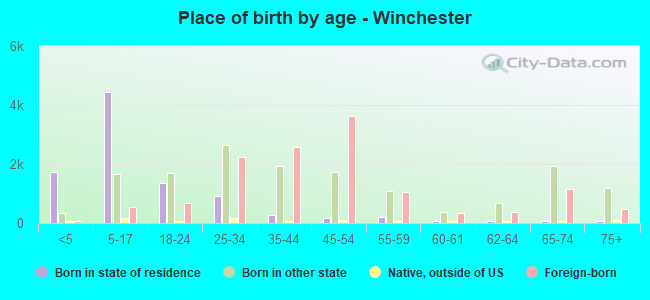
Median age by race in Winchester
45.3 Median age for White residents46.5 44.6 31.7 Median age for Black or African American residents27.3 35.6 34.7 Median age for American Indian / Alaska Native residents46.8 23.9 45.5 Median age for Asian residents48.2 45.1 60.3 Median age for Native Hawaiian / Pacific Islander residents67.9 59.6 32.0 Median age for Other race residents31.8 32.1 34.8 Median age for Two or more races residents36.2 33.8 52.4 Median age for White alone residents51.1 53.8 31.5 Median age for Hispanic or Latino residents31.3 31.9
Owner/renter occupied households by race in Winchester
House owners and renters - White residents 2,517 45.2% Owner occupied3,049 54.8% Renter occupiedHouse owners and renters - Black or African American residents 435 18.4% Owner occupied1,924 81.6% Renter occupiedHouse owners and renters - American Indian / Alaska Native residents 13 5.8% Owner occupied204 94.2% Renter occupiedHouse owners and renters - Asian residents 525 44.7% Owner occupied649 55.3% Renter occupiedHouse owners and renters - Native Hawaiian / Pacific Islander residents 57 100.0% Renter occupiedHouse owners and renters - Other race residents 720 25.6% Owner occupied2,095 74.4% Renter occupiedHouse owners and renters - Two or more races residents 925 28.9% Owner occupied2,277 71.1% Renter occupiedHouse owners and renters - White alone residents 2,290 47.9% Owner occupied2,494 52.1% Renter occupiedHouse owners and renters - Hispanic or Latino residents 1,476 25.5% Owner occupied4,320 74.5% Renter occupied
Language usage in Winchester
English speakers - Total 48.7% of residents of Winchester speak English at home.
41.7% of residents speak Spanish at home 8,028 53.0% Speak English very well7,123 47.0% Speak English less than very well9.9% of residents speak other language at home 1,875 52.3% Speak English very well1,710 47.7% Speak English less than very well
English speakers - Born in the United States 79.0% of residents of Winchester speak English at home.
18.5% of residents speak Spanish at home 2,326 84.5% Speak English very well427 15.5% Speak English less than very well2.6% of residents speak other language at home 331 86.6% Speak English very well51 13.4% Speak English less than very well
English speakers - Native, born elsewhere 39.7% of residents of Winchester speak English at home.
47.4% of residents speak Spanish at home 242 70.8% Speak English very well100 29.2% Speak English less than very well16.9% of residents speak other language at home 48 39.3% Speak English very well74 60.7% Speak English less than very well
English speakers - Foreign-born 9.3% of residents of Winchester speak English at home.
68.8% of residents speak Spanish at home 2,633 29.1% Speak English very well6,410 70.9% Speak English less than very well21.9% of residents speak other language at home 1,324 45.9% Speak English very well1,561 54.1% Speak English less than very well
White (Caucasian) - Speak only English Native:
87.5% (7,672)Foreign-born:
26.0% (418)
White (Caucasian) - Speak another language Native:
11.1% (971)Foreign-born:
71.8% (1,155)
Black or African American - Speak only English Native:
97.9% (4,242)Foreign-born:
23.7% (126)
Black or African American - Speak another language Native:
2.3% (99)Foreign-born:
76.1% (403)
American Indian / Alaska Native - Speak only English Native:
64.5% (346)Foreign-born:
12.9% (29)
American Indian / Alaska Native - Speak another language Native:
35.5% (191)Foreign-born:
89.3% (204)
Asian - Speak only English Native:
64.0% (490)Foreign-born:
5.9% (135)
Asian - Speak another language Native:
35.2% (270)Foreign-born:
93.8% (2,141)
Native Hawaiian / Pacific Islander - Speak only English Native:
51.8% (100)Foreign-born:
28.6% (21)
Native Hawaiian / Pacific Islander - Speak another language Native:
54.3% (105)Foreign-born:
69.6% (51)
Other race - Speak only English Native:
21.1% (984)Foreign-born:
5.0% (260)
Other race - Speak another language Native:
79.7% (3,713)Foreign-born:
94.1% (4,852)
Two or more races - Speak only English Native:
63.4% (2,947)Foreign-born:
4.0% (160)
Two or more races - Speak another language Native:
37.9% (1,761)Foreign-born:
96.3% (3,853)
White alone - Speak only English Native:
95.5% (7,212)Foreign-born:
48.8% (466)
White alone - Speak another language Native:
4.5% (343)Foreign-born:
50.8% (484)
Hispanic or Latino - Speak only English Native:
34.9% (3,189)Foreign-born:
4.2% (392)
Hispanic or Latino - Speak another language Native:
64.9% (5,937)Foreign-born:
95.8% (8,952)
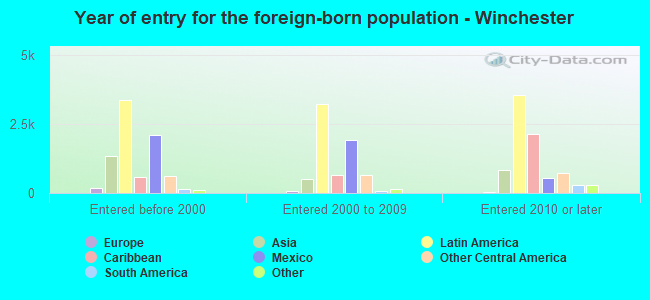
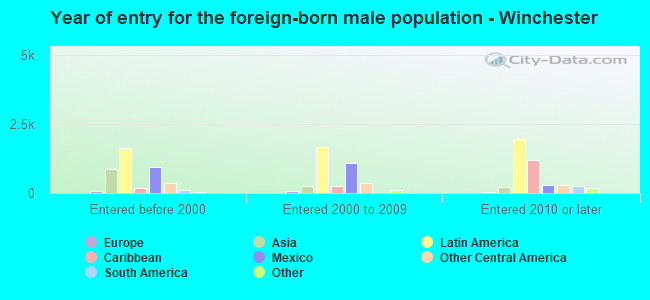
Foreign-born residents in Winchester 13,225 residents are foreign born (25.5% Latin America , 6.6% Asia ).
This city:
34.4%Nevada:
19.1%
Marital status for residents in Winchester Marital status - White (Caucasian) population 15 years and over
Males 50.5% Never married28.7% Now married1.6% Separated1.8% Widowed17.4% DivorcedFemales 36.6% Never married28.6% Now married4.5% Separated10.7% Widowed19.6% DivorcedWomen who gave birth in the past 12 months Now married:
40.6% (55)Unmarried:
59.4% (80)
Women who did not give birth in the past 12 months Now married:
31.2% (683)Unmarried:
68.8% (1,510)
Marital status - Black or African American population 15 years and over
Males 56.5% Never married24.4% Now married3.6% Separated3.3% Widowed12.2% DivorcedFemales 49.9% Never married18.8% Now married7.3% Separated8.1% Widowed15.9% DivorcedWomen who gave birth in the past 12 months Now married:
75.0% (37)Unmarried:
25.0% (12)
Women who did not give birth in the past 12 months Now married:
17.3% (185)Unmarried:
82.7% (880)
Marital status - American Indian / Alaska Native population 15 years and over
Males 41.0% Never married12.4% Now married14.3% Separated22.2% Widowed10.2% DivorcedFemales 57.5% Never married13.7% Now married12.4% Separated10.5% Widowed5.9% DivorcedWomen who did not give birth in the past 12 months Now married:
29.2% (55)Unmarried:
70.8% (132)
Marital status - Asian population 15 years and over
Males 30.1% Never married58.7% Now married1.8% Separated4.5% Widowed4.8% DivorcedFemales 18.7% Never married60.6% Now married0.0% Separated12.0% Widowed8.7% DivorcedWomen who gave birth in the past 12 months Now married:
53.8% (39)Unmarried:
46.2% (34)
Women who did not give birth in the past 12 months Now married:
64.6% (413)Unmarried:
35.4% (226)
Marital status - Native Hawaiian / Pacific Islander population 15 years and over
Males 24.5% Never married58.5% Now married0.0% Separated10.4% Widowed6.6% DivorcedFemales 28.5% Never married38.0% Now married0.0% Separated0.0% Widowed33.6% DivorcedWomen who did not give birth in the past 12 months Now married:
64.6% (34)Unmarried:
35.4% (18)
Marital status - Other race population 15 years and over
Males 42.9% Never married39.2% Now married2.5% Separated2.1% Widowed13.3% DivorcedFemales 39.9% Never married36.7% Now married8.5% Separated3.2% Widowed11.8% DivorcedWomen who gave birth in the past 12 months Now married:
30.8% (96)Unmarried:
69.2% (216)
Women who did not give birth in the past 12 months Now married:
45.5% (1,162)Unmarried:
54.5% (1,394)
Marital status - Two or more races population 15 years and over
Males 43.9% Never married29.5% Now married3.0% Separated0.9% Widowed22.9% DivorcedFemales 30.9% Never married32.4% Now married10.9% Separated4.6% Widowed21.2% DivorcedWomen who gave birth in the past 12 months Now married:
65.4% (167)Unmarried:
34.6% (88)
Women who did not give birth in the past 12 months Now married:
44.3% (833)Unmarried:
55.7% (1,048)
Marital status - White alone, not Hispanic / Latino population 15 years and over
Males 50.5% Never married26.8% Now married0.6% Separated2.3% Widowed19.8% DivorcedFemales 34.0% Never married26.1% Now married3.9% Separated13.7% Widowed22.4% DivorcedWomen who gave birth in the past 12 months Now married:
24.2% (15)Unmarried:
75.8% (48)
Women who did not give birth in the past 12 months Now married:
26.2% (375)Unmarried:
73.8% (1,057)
Marital status - Hispanic or Latino population 15 years and over
Males 45.7% Never married33.8% Now married3.8% Separated2.1% Widowed14.7% DivorcedFemales 38.3% Never married35.0% Now married9.2% Separated3.7% Widowed13.8% DivorcedWomen who gave birth in the past 12 months Now married:
45.6% (272)Unmarried:
54.4% (324)
Women who did not give birth in the past 12 months Now married:
42.9% (2,179)Unmarried:
57.1% (2,898)
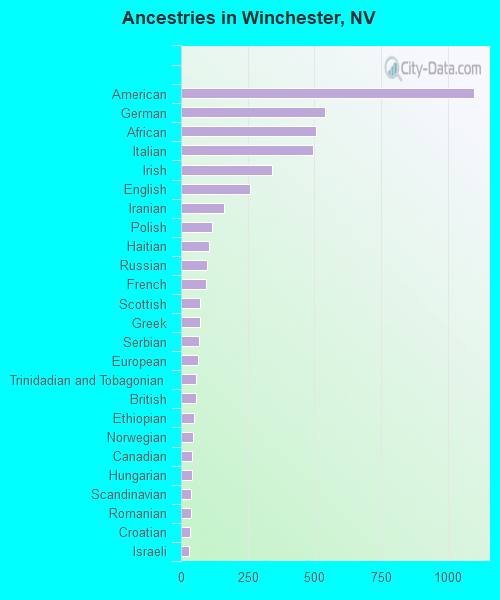
Ancestries in Winchester
1,099 4.3% American540 2.1% German507 2.0% African496 1.9% Italian342 1.3% Irish260 1.0% English160 0.6% Iranian115 0.4% Polish105 0.4% Haitian96 0.4% Russian95 0.4% French71 0.3% Scottish70 0.3% Greek67 0.3% Serbian65 0.3% European56 0.2% Trinidadian and Tobagonian55 0.2% British49 0.2% Ethiopian46 0.2% Norwegian41 0.2% Canadian40 0.2% Hungarian39 0.2% Scandinavian36 0.1% Romanian32 0.1% Croatian30 0.1% Israeli23 0.09% Eastern European20 0.08% South African17 0.07% Swedish15 0.06% New Zealander13 0.05% Syrian13 0.05% Welsh11 0.04% Portuguese10 0.04% Ukrainian9 0.04% Brazilian8 0.03% Australian8 0.03% Austrian8 0.03% Turkish6 0.02% Armenian6 0.02% Scotch-Irish6 0.02% Soviet Union5 0.02% Czech4 0.02% Northern European4 0.02% Dutch
Geographical mobility in Winchester Same house 1 year ago 8,949 80.3% White (Caucasian)3,777 74.9% Black or African American627 83.3% American Indian / Alaska Native2,664 83.1% Asian283 100.0% Native Hawaiian / Pacific Islander9,686 93.5% Other race7,295 84.0% Two or more races6,902 78.6% White alone, not Hispanic / Latino16,930 87.0% Hispanic or LatinoMoved within same county 1,230 11.0% White / Caucasian853 16.9% Black or African American49 6.5% American Indian / Alaska Native354 11.0% Asian753 7.3% Other race895 10.3% Two or more races1,104 12.6% White alone, not Hispanic / Latino1,778 9.1% Hispanic or LatinoMoved within same state 37 0.7% Black or African AmericanMoved from different state 751 6.7% White / Caucasian229 4.6% Black or African American34 4.5% American Indian / Alaska Native138 4.3% Asian27 0.3% Other race428 4.9% Two or more races660 7.5% White alone, not Hispanic / Latino499 2.6% Hispanic or LatinoMoved from abroad 140 1.3% White19 0.4% Black or African American21 2.8% American Indian / Alaska Native13 0.4% Asian58 0.6% Other race47 0.5% White alone, not Hispanic / Latino304 1.6% Hispanic or Latino
Children Nativity (place of birth) in Winchester
Children under 6 years - Living with two parents Both parents native 264 100.0% NativeBoth parents foreign-born 293 100.0% NativeOne native, one foreign-born parent 424 100.0% NativeChildren under 6 years - Living with one parent Native parent 728 100.0% NativeForeign-born parent 952 94.0% Native60 6.0% Foreign-bornChildren 6 to 17 years - Living with two parents Both parents native 534 100.0% NativeBoth parents foreign-born 1,057 81.5% Native241 18.5% Foreign-bornOne native, one foreign-born parent 641 86.8% Native98 13.2% Foreign-bornChildren 6 to 17 years - Living with one parent Native parent 1,213 100.0% NativeForeign-born parent 1,623 53.0% Native1,437 47.0% Foreign-born
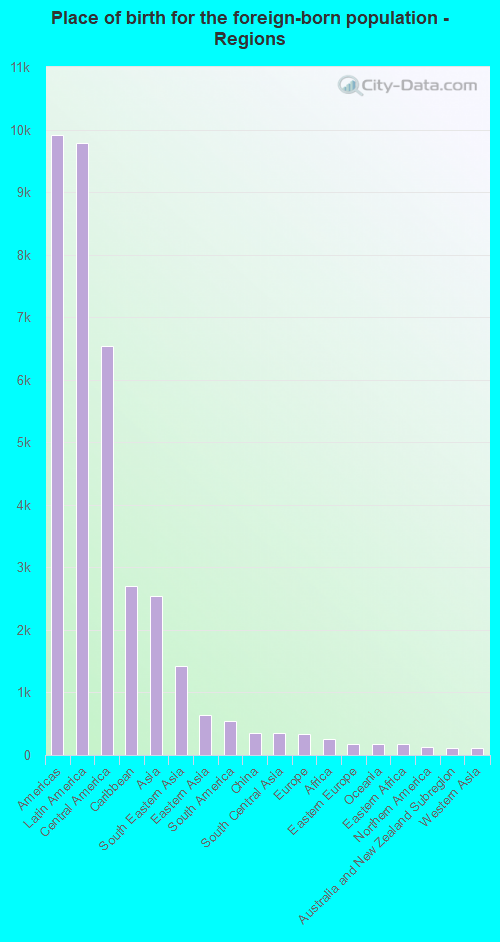
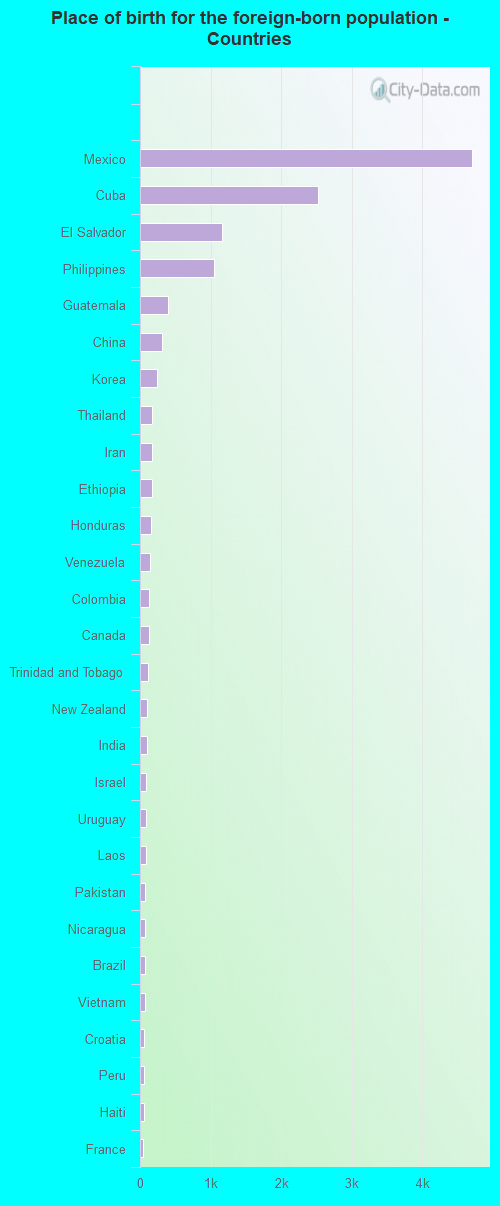
Place of birth for residents in Winchester 9,911 Americas9,784 Latin America6,542 Central America2,702 Caribbean2,541 Asia1,430 South Eastern Asia644 Eastern Asia539 South America352 China352 South Central Asia333 Europe261 Africa179 Eastern Europe177 Oceania172 Eastern Africa126 Northern America117 Australia and New Zealand Subregion113 Western Asia68 Northern Europe61 Western Europe23 Southern Europe21 Middle Africa14 Southern Africa4,714 Mexico2,518 Cuba1,170 El Salvador1,052 Philippines397 Guatemala311 China240 Korea170 Thailand169 Iran168 Ethiopia151 Honduras147 Venezuela130 Colombia126 Canada120 Trinidad and Tobago104 New Zealand95 India87 Israel85 Uruguay83 Laos76 Pakistan76 Nicaragua76 Brazil75 Vietnam57 Croatia56 Peru51 Haiti44 France42 United Kingdom41 Romania35 Taiwan35 Russia31 Costa Rica30 Japan26 Indonesia23 Italy22 Poland21 Democratic Republic of Congo (Zaire)18 Cambodia18 Argentina14 South Africa14 England14 Chile13 Australia13 Switzerland12 Jamaica11 Uzbekistan10 Ireland9 Hungary8 Syria8 Turkey7 Serbia5 Hong Kong5 United Arab Emirates4 Lebanon3 Austria3 Malaysia1 Norway
Grandparents responsible for own grandchildren in Winchester
Grandparents (30 to 59 years) White / Caucasian 107 100.0% Not responsible for grandchildrenBlack or African American 40 32.6% Responsible for grandchildren82 67.4% Not responsible for grandchildrenAmerican Indian / Alaska Native 24 100.0% Not responsible for grandchildrenAsian 11 93.3% Responsible for grandchildren1 6.7% Not responsible for grandchildrenOther race 122 34.5% Responsible for grandchildren232 65.5% Not responsible for grandchildrenTwo or more races 185 100.0% Not responsible for grandchildrenWhite alone, not Hispanic / Latino 107 100.0% Not responsible for grandchildrenHispanic or Latino 68 19.3% Responsible for grandchildren284 80.7% Not responsible for grandchildrenGrandparents (60 years and over) White / Caucasian 37 52.0% Responsible for grandchildren34 48.0% Not responsible for grandchildrenBlack or African American 18 100.0% Not responsible for grandchildrenAsian 153 100.0% Not responsible for grandchildrenOther race 45 32.2% Responsible for grandchildren96 67.8% Not responsible for grandchildrenTwo or more races 6 3.8% Responsible for grandchildren152 96.2% Not responsible for grandchildrenWhite alone, not Hispanic / Latino 45 91.0% Responsible for grandchildren4 9.0% Not responsible for grandchildrenHispanic or Latino 29 10.6% Responsible for grandchildren244 89.4% Not responsible for grandchildren