Races in Winter Haven, Florida (FL) Detailed Stats
Data:
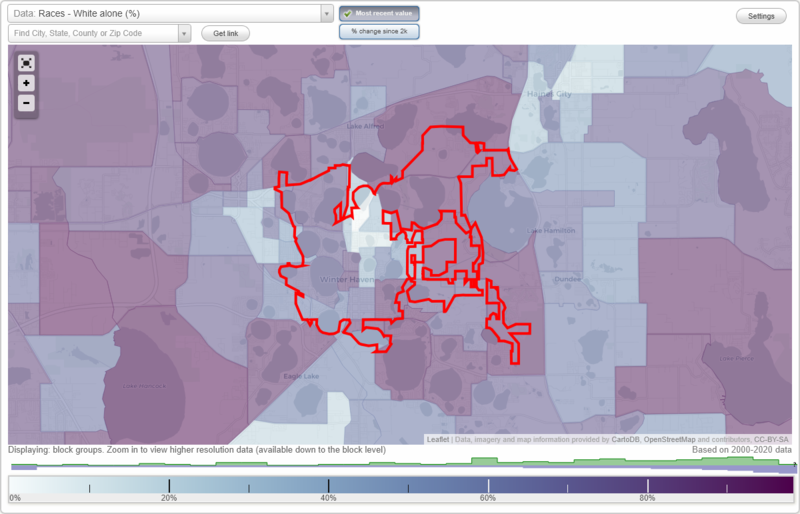
Races - White alone (%)
Races - White alone (% change since 2000)
Races - Black alone (%)
Races - Black alone (% change since 2000)
Races - American Indian alone (%)
Races - American Indian alone (% change since 2000)
Races - Asian alone (%)
Races - Asian alone (% change since 2000)
Races - Hispanic (%)
Races - Hispanic (% change since 2000)
Races - Native Hawaiian and Other Pacific Islander alone (%)
Races - Native Hawaiian and Other Pacific Islander alone (% change since 2000)
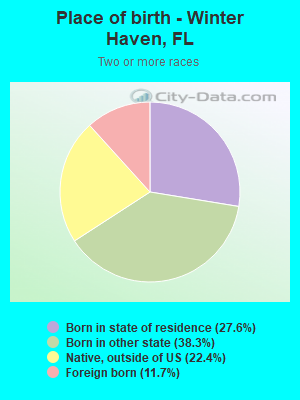
Races - Two or more races(%)
Races - Two or more races(% change since 2000)
Races - Other race alone (%)
Races - Other race alone (% change since 2000)
Racial diversity
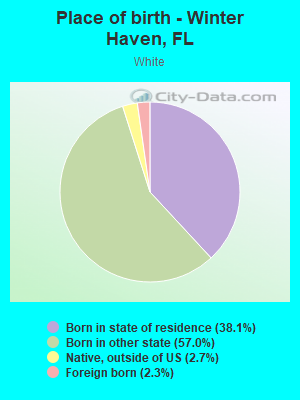
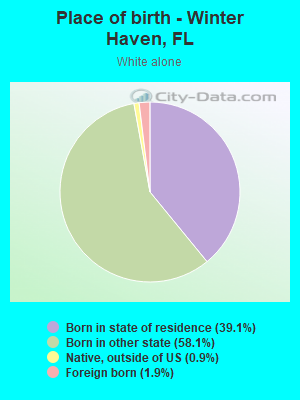
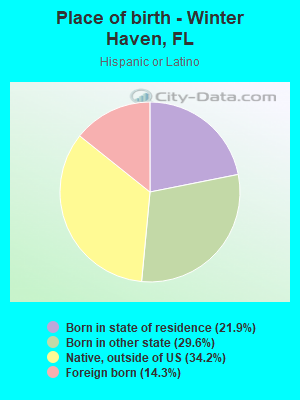
Place of birth - Born in state of residence (%)
Place of birth - Born in state of residence (%) - White
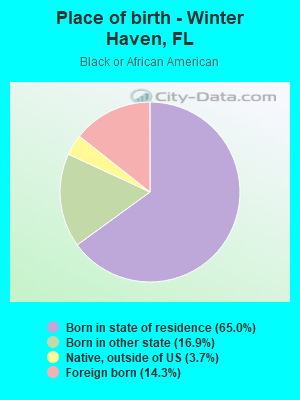
Place of birth - Born in state of residence (%) - Black or African American
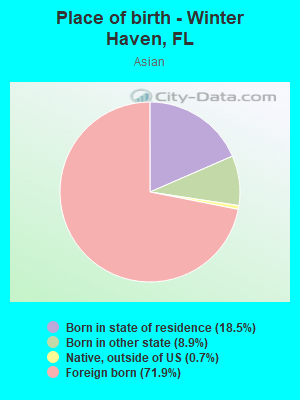
Place of birth - Born in state of residence (%) - Asian
Place of birth - Born in state of residence (%) - Hispanic or Latino
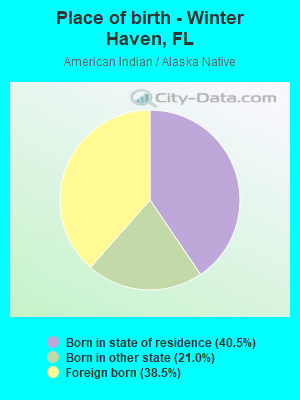
Place of birth - Born in state of residence (%) - American Indian and Alaska Native
Place of birth - Born in state of residence (%) - Multirace
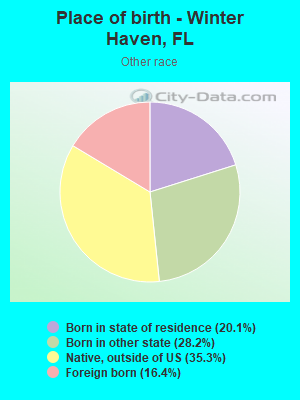
Place of birth - Born in state of residence (%) - Other Race
Place of birth - Born in other state (%)
Place of birth - Born in other state (%) - White
Place of birth - Born in other state (%) - Black or African American
Place of birth - Born in other state (%) - Asian
Place of birth - Born in other state (%) - Hispanic or Latino
Place of birth - Born in other state (%) - American Indian and Alaska Native
Place of birth - Born in other state (%) - Multirace
Place of birth - Born in other state (%) - Other Race
Place of birth - Native, outside of US (%)
Place of birth - Native, outside of US (%) - White
Place of birth - Native, outside of US (%) - Black or African American
Place of birth - Native, outside of US (%) - Asian
Place of birth - Native, outside of US (%) - Hispanic or Latino
Place of birth - Native, outside of US (%) - American Indian and Alaska Native
Place of birth - Native, outside of US (%) - Multirace
Place of birth - Native, outside of US (%) - Other Race
Place of birth - Foreign born (%)
Place of birth - Foreign born (%) - White
Place of birth - Foreign born (%) - Black or African American
Place of birth - Foreign born (%) - Asian
Place of birth - Foreign born (%) - Hispanic or Latino
Place of birth - Foreign born (%) - American Indian and Alaska Native
Place of birth - Foreign born (%) - Multirace
Place of birth - Foreign born (%) - Other Race
Residents speaking English at home (%)
Residents speaking English at home - Born in the United States (%)
Residents speaking English at home - Native, born elsewhere (%)
Residents speaking English at home - Foreign born (%)
Residents speaking Spanish at home (%)
Residents speaking Spanish at home - Born in the United States (%)
Residents speaking Spanish at home - Native, born elsewhere (%)
Residents speaking Spanish at home - Foreign born (%)
Residents speaking other language at home (%)
Residents speaking other language at home - Born in the United States (%)
Residents speaking other language at home - Native, born elsewhere (%)
Residents speaking other language at home - Foreign born (%)
Marital status - Never married (%)
Marital status - Now married (%)
Marital status - Separated (%)
Marital status - Widowed (%)
Marital status - Divorced (%)
Ancestries Reported - Arab (%)
Ancestries Reported - Czech (%)
Ancestries Reported - Danish (%)
Ancestries Reported - Dutch (%)
Ancestries Reported - English (%)
Ancestries Reported - French (%)
Ancestries Reported - French Canadian (%)
Ancestries Reported - German (%)
Ancestries Reported - Greek (%)
Ancestries Reported - Hungarian (%)
Ancestries Reported - Irish (%)
Ancestries Reported - Italian (%)
Ancestries Reported - Lithuanian (%)
Ancestries Reported - Norwegian (%)
Ancestries Reported - Polish (%)
Ancestries Reported - Portuguese (%)
Ancestries Reported - Russian (%)
Ancestries Reported - Scotch-Irish (%)
Ancestries Reported - Scottish (%)
Ancestries Reported - Slovak (%)
Ancestries Reported - Subsaharan African (%)
Ancestries Reported - Swedish (%)
Ancestries Reported - Swiss (%)
Ancestries Reported - Ukrainian (%)
Ancestries Reported - United States (%)
Ancestries Reported - Welsh (%)
Ancestries Reported - West Indian (%)
Ancestries Reported - Other (%)
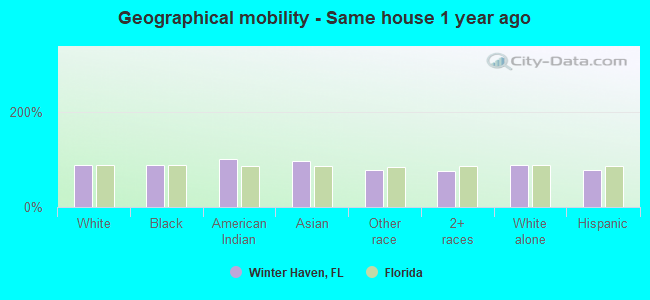
Geographical mobility - Same house 1 year ago (%)
Geographical mobility - Same house 1 year ago (%) - White
Geographical mobility - Same house 1 year ago (%) - Black or African American
Geographical mobility - Same house 1 year ago (%) - Asian
Geographical mobility - Same house 1 year ago (%) - Hispanic or Latino
Geographical mobility - Same house 1 year ago (%) - American Indian and Alaska Native
Geographical mobility - Same house 1 year ago (%) - Multirace
Geographical mobility - Same house 1 year ago (%) - Other Race
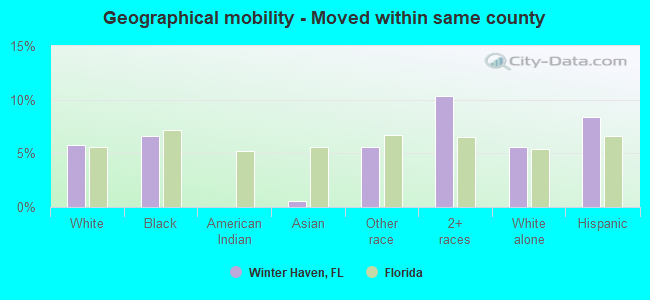
Geographical mobility - Moved within same county (%)
Geographical mobility - Moved within same county (%) - White
Geographical mobility - Moved within same county (%) - Black or African American
Geographical mobility - Moved within same county (%) - Asian
Geographical mobility - Moved within same county (%) - Hispanic or Latino
Geographical mobility - Moved within same county (%) - American Indian and Alaska Native
Geographical mobility - Moved within same county (%) - Multirace
Geographical mobility - Moved within same county (%) - Other Race
Geographical mobility - Moved from different county within same state (%)
Geographical mobility - Moved from different county within same state (%) - White
Geographical mobility - Moved from different county within same state (%) - Black or African American
Geographical mobility - Moved from different county within same state (%) - Asian
Geographical mobility - Moved from different county within same state (%) - Hispanic or Latino
Geographical mobility - Moved from different county within same state (%) - American Indian and Alaska Native
Geographical mobility - Moved from different county within same state (%) - Multirace
Geographical mobility - Moved from different county within same state (%) - Other Race
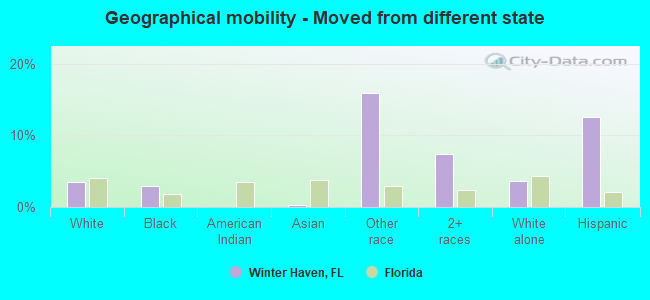
Geographical mobility - Moved from different state (%)
Geographical mobility - Moved from different state (%) - White
Geographical mobility - Moved from different state (%) - Black or African American
Geographical mobility - Moved from different state (%) - Asian
Geographical mobility - Moved from different state (%) - Hispanic or Latino
Geographical mobility - Moved from different state (%) - American Indian and Alaska Native
Geographical mobility - Moved from different state (%) - Multirace
Geographical mobility - Moved from different state (%) - Other Race
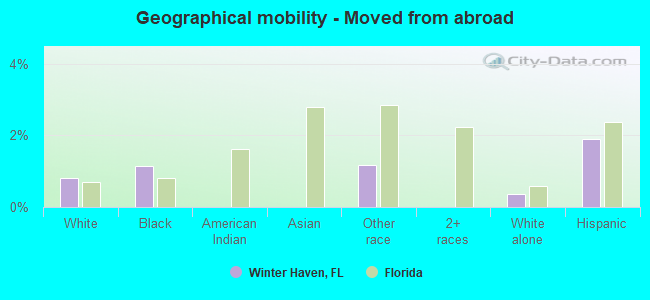
Geographical mobility - Moved from abroad (%)
Geographical mobility - Moved from abroad (%) - White
Geographical mobility - Moved from abroad (%) - Black or African American
Geographical mobility - Moved from abroad (%) - Asian
Geographical mobility - Moved from abroad (%) - Hispanic or Latino
Geographical mobility - Moved from abroad (%) - American Indian and Alaska Native
Geographical mobility - Moved from abroad (%) - Multirace
Geographical mobility - Moved from abroad (%) - Other Race
Place of birth for the foreign-born population - Ireland (%)
Place of birth for the foreign-born population - Denmark (%)
Place of birth for the foreign-born population - Norway (%)
Place of birth for the foreign-born population - Sweden (%)
Place of birth for the foreign-born population - United Kingdom (%)
Place of birth for the foreign-born population - England (%)
Place of birth for the foreign-born population - Scotland (%)
Place of birth for the foreign-born population - Other Northern Europe (%)
Place of birth for the foreign-born population - Austria (%)
Place of birth for the foreign-born population - Belgium (%)
Place of birth for the foreign-born population - France (%)
Place of birth for the foreign-born population - Germany (%)
Place of birth for the foreign-born population - Netherlands (%)
Place of birth for the foreign-born population - Switzerland (%)
Place of birth for the foreign-born population - Other Western Europe (%)
Place of birth for the foreign-born population - Greece (%)
Place of birth for the foreign-born population - Italy (%)
Place of birth for the foreign-born population - Portugal (%)
Place of birth for the foreign-born population - Spain (%)
Place of birth for the foreign-born population - Other Southern Europe (%)
Place of birth for the foreign-born population - Albania (%)
Place of birth for the foreign-born population - Belarus (%)
Place of birth for the foreign-born population - Bosnia and Herzegovina (%)
Place of birth for the foreign-born population - Bulgaria (%)
Place of birth for the foreign-born population - Croatia (%)
Place of birth for the foreign-born population - Czechoslovakia (%)
Place of birth for the foreign-born population - Hungary (%)
Place of birth for the foreign-born population - Latvia (%)
Place of birth for the foreign-born population - Lithuania (%)
Place of birth for the foreign-born population - North Macedonia (Macedonia) (%)
Place of birth for the foreign-born population - Moldova (%)
Place of birth for the foreign-born population - Poland (%)
Place of birth for the foreign-born population - Romania (%)
Place of birth for the foreign-born population - Russia (%)
Place of birth for the foreign-born population - Serbia (%)
Place of birth for the foreign-born population - Ukraine (%)
Place of birth for the foreign-born population - Other Eastern Europe (%)
Place of birth for the foreign-born population - China (%)
Place of birth for the foreign-born population - Hong Kong (%)
Place of birth for the foreign-born population - Taiwan (%)
Place of birth for the foreign-born population - Japan (%)
Place of birth for the foreign-born population - Korea (%)
Place of birth for the foreign-born population - Other Eastern Asia (%)
Place of birth for the foreign-born population - Afghanistan (%)
Place of birth for the foreign-born population - Bangladesh (%)
Place of birth for the foreign-born population - India (%)
Place of birth for the foreign-born population - Iran (%)
Place of birth for the foreign-born population - Kazakhstan (%)
Place of birth for the foreign-born population - Nepal (%)
Place of birth for the foreign-born population - Pakistan (%)
Place of birth for the foreign-born population - Sri Lanka (%)
Place of birth for the foreign-born population - Uzbekistan (%)
Place of birth for the foreign-born population - Other South Central Asia (%)
Place of birth for the foreign-born population - Burma (%)
Place of birth for the foreign-born population - Cambodia (%)
Place of birth for the foreign-born population - Indonesia (%)
Place of birth for the foreign-born population - Laos (%)
Place of birth for the foreign-born population - Malaysia (%)
Place of birth for the foreign-born population - Philippines (%)
Place of birth for the foreign-born population - Singapore (%)
Place of birth for the foreign-born population - Thailand (%)
Place of birth for the foreign-born population - Vietnam (%)
Place of birth for the foreign-born population - Other South Eastern Asia (%)
Place of birth for the foreign-born population - Armenia (%)
Place of birth for the foreign-born population - Iraq (%)
Place of birth for the foreign-born population - Israel (%)
Place of birth for the foreign-born population - Jordan (%)
Place of birth for the foreign-born population - Kuwait (%)
Place of birth for the foreign-born population - Lebanon (%)
Place of birth for the foreign-born population - Saudi Arabia (%)
Place of birth for the foreign-born population - Syria (%)
Place of birth for the foreign-born population - Turkey (%)
Place of birth for the foreign-born population - Yemen (%)
Place of birth for the foreign-born population - Other Western Asia (%)
Place of birth for the foreign-born population - Eritrea (%)
Place of birth for the foreign-born population - Ethiopia (%)
Place of birth for the foreign-born population - Kenya (%)
Place of birth for the foreign-born population - Somalia (%)
Place of birth for the foreign-born population - Uganda (%)
Place of birth for the foreign-born population - Zimbabwe (%)
Place of birth for the foreign-born population - Other Eastern Africa (%)
Place of birth for the foreign-born population - Cameroon (%)
Place of birth for the foreign-born population - Congo (%)
Place of birth for the foreign-born population - Democratic Republic of Congo (Zaire) (%)
Place of birth for the foreign-born population - Other Middle Africa (%)
Place of birth for the foreign-born population - Egypt (%)
Place of birth for the foreign-born population - Morocco (%)
Place of birth for the foreign-born population - Sudan (%)
Place of birth for the foreign-born population - Other Northern Africa (%)
Place of birth for the foreign-born population - South Africa (%)
Place of birth for the foreign-born population - Other Southern Africa (%)
Place of birth for the foreign-born population - Cabo Verde (%)
Place of birth for the foreign-born population - Ghana (%)
Place of birth for the foreign-born population - Liberia (%)
Place of birth for the foreign-born population - Nigeria (%)
Place of birth for the foreign-born population - Senegal (%)
Place of birth for the foreign-born population - Sierra Leone (%)
Place of birth for the foreign-born population - Other Western Africa (%)
Place of birth for the foreign-born population - Australia (%)
Place of birth for the foreign-born population - New Zealand (%)
Place of birth for the foreign-born population - Fiji (%)
Place of birth for the foreign-born population - Micronesia (%)
Place of birth for the foreign-born population - Bahamas (%)
Place of birth for the foreign-born population - Barbados (%)
Place of birth for the foreign-born population - Cuba (%)
Place of birth for the foreign-born population - Dominica (%)
Place of birth for the foreign-born population - Dominican Republic (%)
Place of birth for the foreign-born population - Grenada (%)
Place of birth for the foreign-born population - Haiti (%)
Place of birth for the foreign-born population - Jamaica (%)
Place of birth for the foreign-born population - St. Vincent and the Grenadines (%)
Place of birth for the foreign-born population - Trinidad and Tobago (%)
Place of birth for the foreign-born population - West Indies (%)
Place of birth for the foreign-born population - Other Caribbean (%)
Place of birth for the foreign-born population - Belize (%)
Place of birth for the foreign-born population - Costa Rica (%)
Place of birth for the foreign-born population - El Salvador (%)
Place of birth for the foreign-born population - Guatemala (%)
Place of birth for the foreign-born population - Honduras (%)
Place of birth for the foreign-born population - Mexico (%)
Place of birth for the foreign-born population - Nicaragua (%)
Place of birth for the foreign-born population - Panama (%)
Place of birth for the foreign-born population - Other Central America (%)
Place of birth for the foreign-born population - Argentina (%)
Place of birth for the foreign-born population - Bolivia (%)
Place of birth for the foreign-born population - Brazil (%)
Place of birth for the foreign-born population - Chile (%)
Place of birth for the foreign-born population - Colombia (%)
Place of birth for the foreign-born population - Ecuador (%)
Place of birth for the foreign-born population - Guyana (%)
Place of birth for the foreign-born population - Peru (%)
Place of birth for the foreign-born population - Uruguay (%)
Place of birth for the foreign-born population - Venezuela (%)
Place of birth for the foreign-born population - Other South America (%)
Place of birth for the foreign-born population - Canada (%)
Place of birth for the foreign-born population - Other Northern America (%)
Place of birth for the foreign-born population - Other (%)
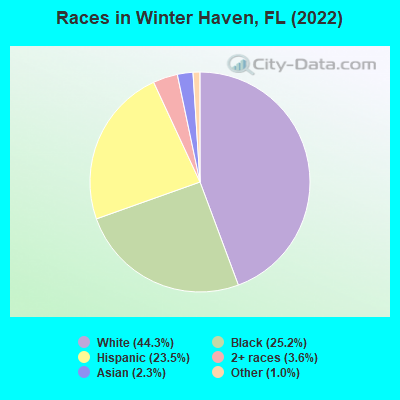
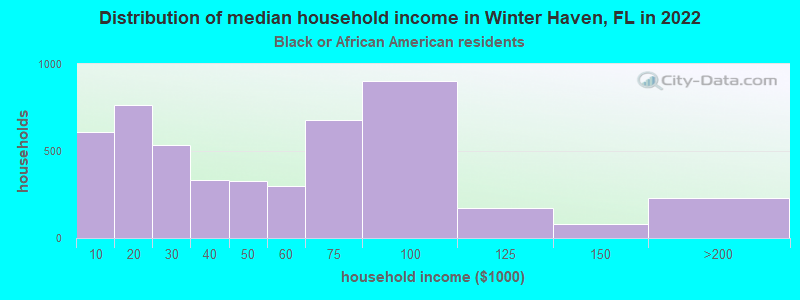
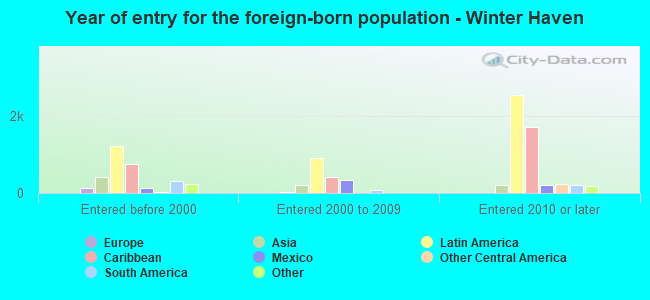
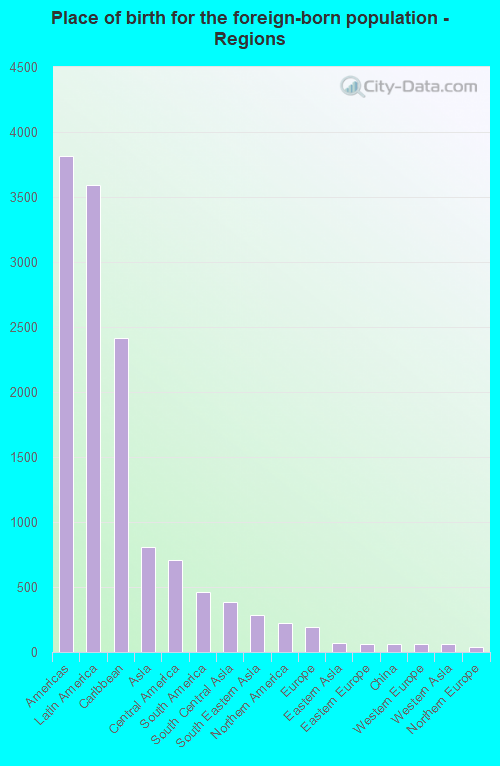
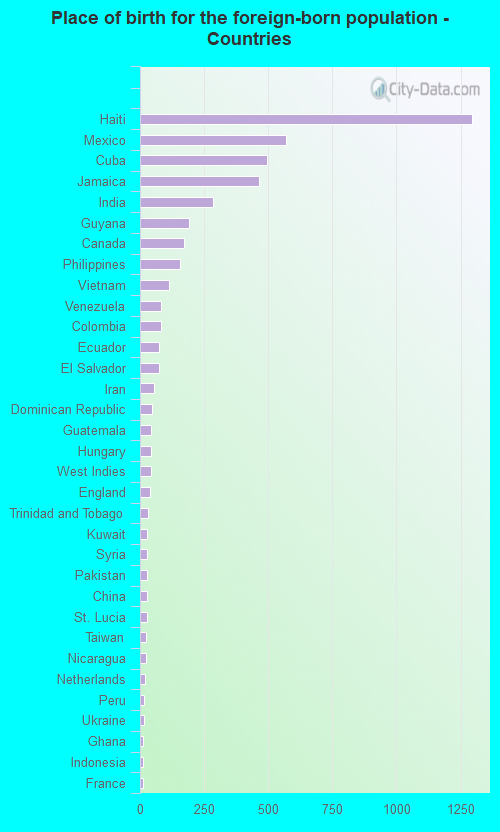
According to 2022 data, the most numerous races in Winter Haven, FL are White alone (24,055 residents), Hispanic (12,778 residents), and Black alone (13,684 residents). 73.7% of Winter Haven residents speak English at home. 8.9% of Winter Haven, FL residents are foreign-born (6.7% born in Latin America, 1.5% born in Asia), which is 135.8% less than the foreign-born rate of 21.0% across the entire state of Florida.
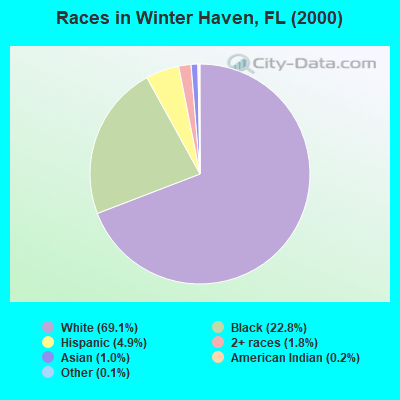
Race distribution in Winter Haven
2000 2022
10,458,509 65.4% White alone 2,682,715 16.8% Hispanic 2,264,268 14.2% Black alone 261,693 1.6% Asian alone 236,954 1.5% Two or more races 42,358 0.3% American Indian alone 28,994 0.2% Other race alone 6,887 0.04% Native Hawaiian and Other
11,309,403 50.8% White alone 6,025,039 27.1% Hispanic 3,241,015 14.6% Black alone 861,630 3.9% Two or more races 623,692 2.8% Asian alone 152,054 0.7% Other race alone 22,504 0.1% American Indian alone 9,486 0.04% Native Hawaiian and Other
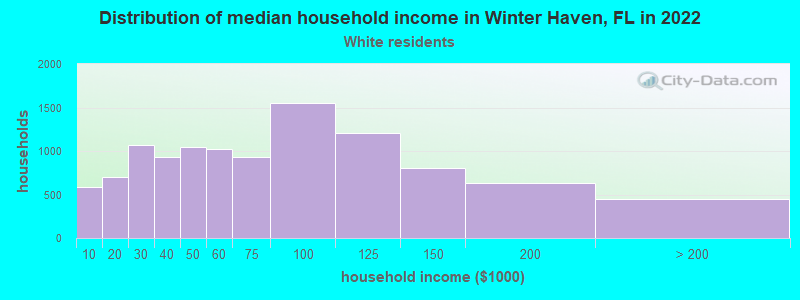
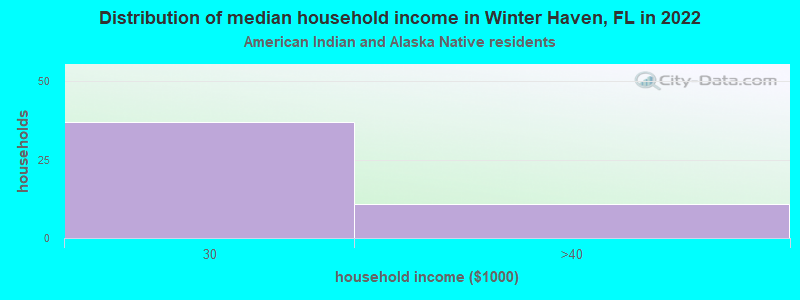
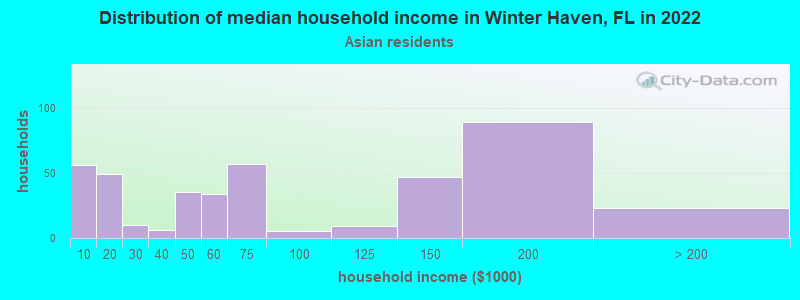
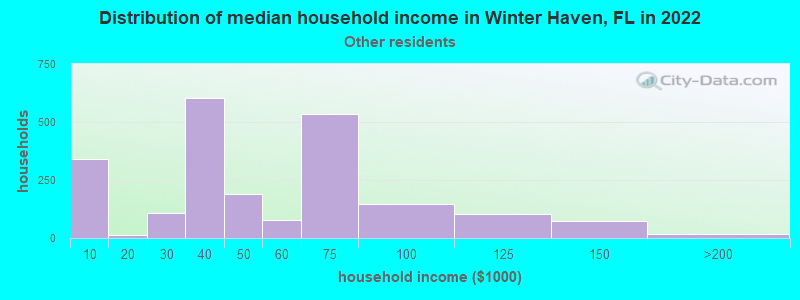
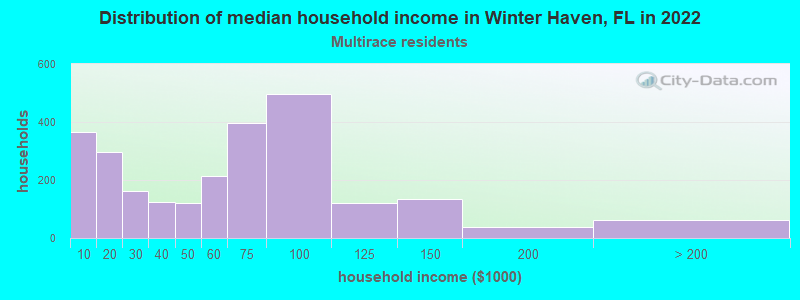
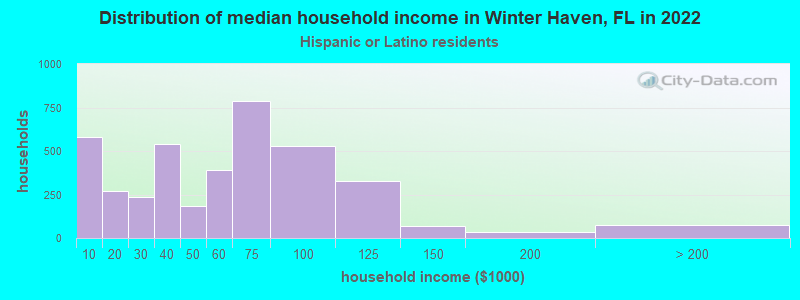
Income and house value in Winter Haven Median household income in 2022 $61,334 White non-Hispanic householders$45,576 Black householders$62,788 Asian householders$42,854 Some other race householders$60,786 Two or more races householders$60,340 Hispanic or Latino race householdersMedian 2022 house value $327,997 White Non-Hispanic householders$245,045 Black or African American householders $359,738 Asian householders$320,379 Some other race householders$267,476 Two or more races householders$308,528 Hispanic or Latino householders
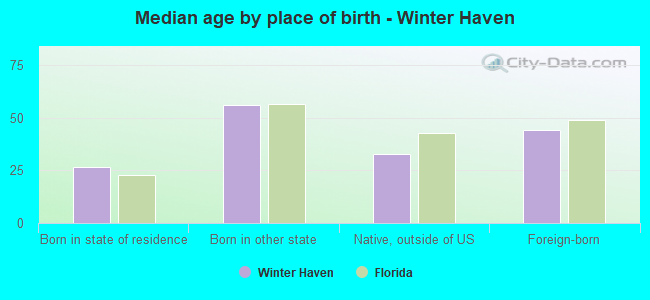
Median age by race in Winter Haven
54.6 Median age for White residents51.5 58.0 33.8 Median age for Black or African American residents36.0 32.9 41.3 Median age for American Indian / Alaska Native residents36.0 52.6 50.3 Median age for Asian residents39.6 50.7 -679,849,340.2 Median age for Native Hawaiian / Pacific Islander residents-858,307,848.3 -443,298,968.6 31.9 Median age for Other race residents31.7 32.4 25.9 Median age for Two or more races residents28.3 23.5 54.7 Median age for White alone residents51.5 57.6 28.2 Median age for Hispanic or Latino residents28.4 29.0
Owner/renter occupied households by race in Winter Haven
House owners and renters - White residents 8,033 73.4% Owner occupied2,912 26.6% Renter occupiedHouse owners and renters - Black or African American residents 2,287 46.3% Owner occupied2,649 53.7% Renter occupiedHouse owners and renters - American Indian / Alaska Native residents 17 38.0% Owner occupied28 62.0% Renter occupiedHouse owners and renters - Asian residents 404 95.8% Owner occupied18 4.2% Renter occupiedHouse owners and renters - Other race residents 1,424 69.5% Owner occupied624 30.5% Renter occupiedHouse owners and renters - Two or more races residents 1,329 53.1% Owner occupied1,172 46.9% Renter occupiedHouse owners and renters - White alone residents 7,856 73.1% Owner occupied2,888 26.9% Renter occupiedHouse owners and renters - Hispanic or Latino residents 2,352 60.4% Owner occupied1,543 39.6% Renter occupied
Language usage in Winter Haven
English speakers - Total 73.7% of residents of Winter Haven speak English at home.
18.3% of residents speak Spanish at home 4,945 52.9% Speak English very well4,395 47.1% Speak English less than very well7.8% of residents speak other language at home 2,757 69.4% Speak English very well1,214 30.6% Speak English less than very well
English speakers - Born in the United States 87.3% of residents of Winter Haven speak English at home.
11.2% of residents speak Spanish at home 1,695 75.1% Speak English very well561 24.9% Speak English less than very well1.5% of residents speak other language at home 304 100.0% Speak English very well
English speakers - Native, born elsewhere 16.7% of residents of Winter Haven speak English at home.
79.9% of residents speak Spanish at home 1,752 44.3% Speak English very well2,205 55.7% Speak English less than very well2.7% of residents speak other language at home 38 28.1% Speak English very well97 71.9% Speak English less than very well
English speakers - Foreign-born 26.9% of residents of Winter Haven speak English at home.
26.2% of residents speak Spanish at home 442 30.3% Speak English very well1,016 69.7% Speak English less than very well45.6% of residents speak other language at home 1,344 52.8% Speak English very well1,200 47.2% Speak English less than very well
White (Caucasian) - Speak only English Native:
96.5% (22,359)Foreign-born:
65.4% (365)
White (Caucasian) - Speak another language Native:
4.6% (1,070)Foreign-born:
44.9% (251)
Black or African American - Speak only English Native:
91.6% (9,894)Foreign-born:
22.6% (432)
Black or African American - Speak another language Native:
8.3% (897)Foreign-born:
80.1% (1,528)
American Indian / Alaska Native - Speak only English Native:
26.0% (24)Foreign-born:
21.9% (13)
American Indian / Alaska Native - Speak another language Native:
97.2% (90)Foreign-born:
67.3% (39)
Asian - Speak only English Native:
77.0% (273)Foreign-born:
23.7% (217)
Asian - Speak another language Native:
21.3% (76)Foreign-born:
75.9% (697)
Other race - Speak only English Native:
24.6% (1,225)Foreign-born:
11.4% (118)
Other race - Speak another language Native:
73.4% (3,662)Foreign-born:
88.1% (905)
Two or more races - Speak only English Native:
38.1% (2,599)Foreign-born:
43.1% (430)
Two or more races - Speak another language Native:
62.6% (4,266)Foreign-born:
65.8% (656)
White alone - Speak only English Native:
97.6% (21,989)Foreign-born:
60.4% (279)
White alone - Speak another language Native:
2.4% (531)Foreign-born:
38.1% (176)
Hispanic or Latino - Speak only English Native:
24.3% (2,386)Foreign-born:
19.7% (351)
Hispanic or Latino - Speak another language Native:
75.8% (7,439)Foreign-born:
82.0% (1,461)
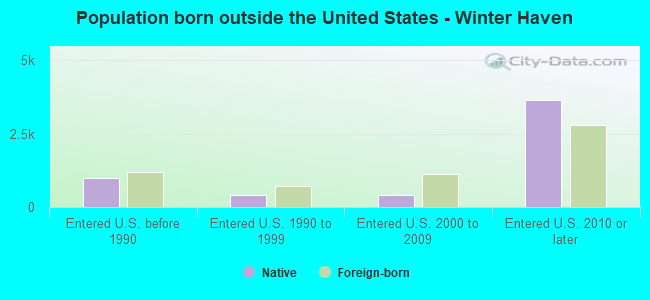
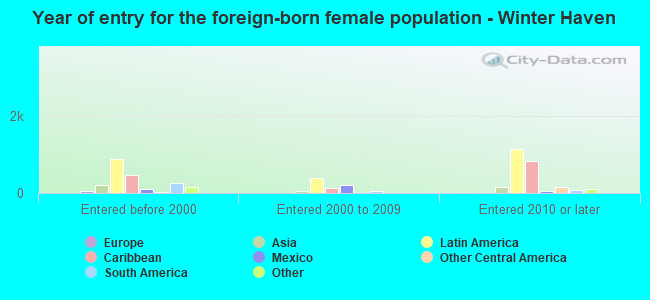
Foreign-born residents in Winter Haven 4,837 residents are foreign born (6.7% Latin America , 1.5% Asia ).
This city:
8.9%Florida:
21.1%
Marital status for residents in Winter Haven Marital status - White (Caucasian) population 15 years and over
Males 30.0% Never married53.5% Now married1.1% Separated4.1% Widowed11.3% DivorcedFemales 18.1% Never married46.9% Now married0.4% Separated16.5% Widowed18.1% DivorcedWomen who gave birth in the past 12 months Now married:
72.7% (81)Unmarried:
27.3% (30)
Women who did not give birth in the past 12 months Now married:
43.3% (1,674)Unmarried:
56.7% (2,189)
Marital status - Black or African American population 15 years and over
Males 40.6% Never married39.1% Now married1.0% Separated3.4% Widowed15.8% DivorcedFemales 44.3% Never married27.8% Now married2.9% Separated6.8% Widowed18.2% DivorcedWomen who gave birth in the past 12 months Now married:
40.0% (35)Unmarried:
60.0% (53)
Women who did not give birth in the past 12 months Now married:
31.8% (1,174)Unmarried:
68.2% (2,521)
Marital status - American Indian / Alaska Native population 15 years and over
Males 75.4% Never married24.6% Now married0.0% Separated0.0% Widowed0.0% DivorcedFemales 50.0% Never married36.8% Now married0.0% Separated13.2% Widowed0.0% DivorcedWomen who did not give birth in the past 12 months Now married:
0.0% (0)Unmarried:
100.0% (31)
Marital status - Asian population 15 years and over
Males 12.9% Never married40.2% Now married7.1% Separated9.5% Widowed30.4% DivorcedFemales 20.7% Never married38.6% Now married0.0% Separated24.9% Widowed15.8% DivorcedWomen who gave birth in the past 12 months Now married:
100.0% (6)Unmarried:
0.0% (0)
Women who did not give birth in the past 12 months Now married:
47.9% (117)Unmarried:
52.1% (127)
Marital status - Other race population 15 years and over
Males 41.4% Never married41.4% Now married0.0% Separated11.3% Widowed6.0% DivorcedFemales 32.1% Never married48.5% Now married5.1% Separated0.5% Widowed13.8% DivorcedWomen who gave birth in the past 12 months Now married:
100.0% (12)Unmarried:
0.0% (0)
Women who did not give birth in the past 12 months Now married:
56.1% (997)Unmarried:
43.9% (780)
Marital status - Two or more races population 15 years and over
Males 47.0% Never married40.0% Now married0.0% Separated1.1% Widowed12.0% DivorcedFemales 44.0% Never married38.1% Now married6.0% Separated0.7% Widowed11.2% DivorcedWomen who gave birth in the past 12 months Now married:
59.6% (107)Unmarried:
40.4% (73)
Women who did not give birth in the past 12 months Now married:
33.6% (773)Unmarried:
66.4% (1,527)
Marital status - White alone, not Hispanic / Latino population 15 years and over
Males 29.9% Never married53.6% Now married0.8% Separated4.5% Widowed11.2% DivorcedFemales 17.3% Never married46.5% Now married0.4% Separated17.1% Widowed18.7% DivorcedWomen who gave birth in the past 12 months Now married:
83.0% (93)Unmarried:
17.0% (19)
Women who did not give birth in the past 12 months Now married:
41.8% (1,550)Unmarried:
58.2% (2,161)
Marital status - Hispanic or Latino population 15 years and over
Males 41.7% Never married42.1% Now married1.8% Separated5.3% Widowed9.1% DivorcedFemales 33.6% Never married46.6% Now married5.0% Separated3.2% Widowed11.6% DivorcedWomen who gave birth in the past 12 months Now married:
54.5% (86)Unmarried:
45.5% (71)
Women who did not give birth in the past 12 months Now married:
48.4% (1,690)Unmarried:
51.6% (1,805)
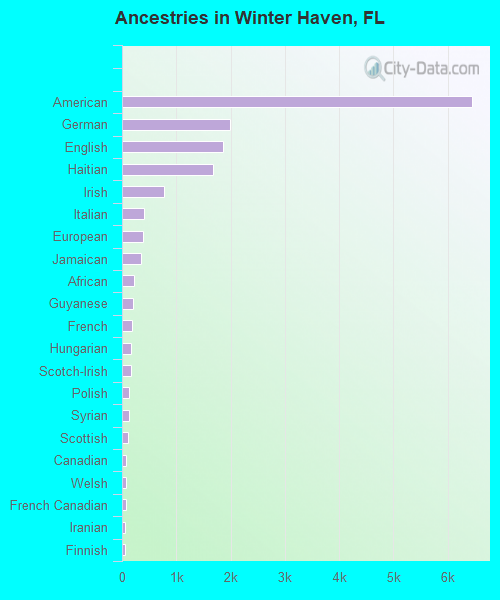
Ancestries in Winter Haven
6,437 21.2% American1,993 6.6% German1,867 6.1% English1,670 5.5% Haitian782 2.6% Irish397 1.3% Italian389 1.3% European344 1.1% Jamaican216 0.7% African194 0.6% Guyanese175 0.6% French168 0.6% Hungarian165 0.5% Scotch-Irish133 0.4% Polish121 0.4% Syrian114 0.4% Scottish77 0.3% Canadian72 0.2% Welsh67 0.2% French Canadian61 0.2% Iranian59 0.2% Finnish48 0.2% Czech48 0.2% Eastern European47 0.2% Swedish46 0.2% Norwegian44 0.1% West Indian41 0.1% Trinidadian and Tobagonian40 0.1% Dutch35 0.1% Czechoslovakian32 0.1% Maltese31 0.1% British29 0.10% Ghanaian29 0.10% Ukrainian23 0.08% Slovak23 0.08% Northern European22 0.07% Cape Verdean14 0.05% Croatian13 0.04% Portuguese13 0.04% Scandinavian13 0.04% Assyrian13 0.04% Lebanese13 0.04% Barbadian12 0.04% Palestinian10 0.03% Pennsylvania German10 0.03% Russian7 0.02% Greek4 0.01% Ethiopian
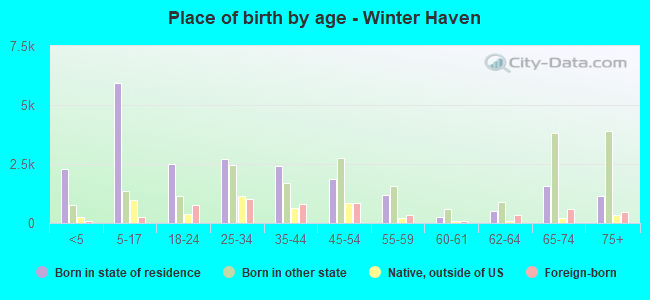
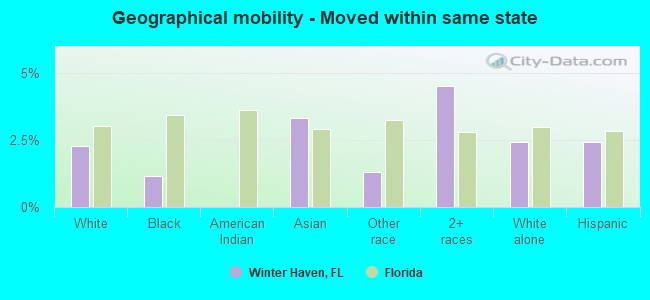
Geographical mobility in Winter Haven Same house 1 year ago 21,482 87.8% White (Caucasian)11,761 86.8% Black or African American190 100.0% American Indian / Alaska Native1,244 96.7% Asian5,152 78.4% Other race6,275 74.8% Two or more races20,950 88.1% White alone, not Hispanic / Latino9,922 78.5% Hispanic or LatinoMoved within same county 1,404 5.7% White / Caucasian892 6.6% Black or African American7 0.6% Asian367 5.6% Other race865 10.3% Two or more races1,331 5.6% White alone, not Hispanic / Latino1,057 8.4% Hispanic or LatinoMoved within same state 558 2.3% White / Caucasian158 1.2% Black or African American43 3.3% Asian85 1.3% Other race378 4.5% Two or more races575 2.4% White alone, not Hispanic / Latino308 2.4% Hispanic or LatinoMoved from different state 860 3.5% White / Caucasian392 2.9% Black or African American4 0.3% Asian1,050 16.0% Other race627 7.5% Two or more races858 3.6% White alone, not Hispanic / Latino1,591 12.6% Hispanic or LatinoMoved from abroad 201 0.8% White157 1.2% Black or African American77 1.2% Other race89 0.4% White alone, not Hispanic / Latino239 1.9% Hispanic or Latino
Children Nativity (place of birth) in Winter Haven
Children under 6 years - Living with two parents Both parents native 1,496 100.0% NativeBoth parents foreign-born 272 100.0% NativeOne native, one foreign-born parent 394 100.0% NativeChildren under 6 years - Living with one parent Native parent 1,360 100.0% NativeForeign-born parent 187 88.6% Native24 11.4% Foreign-bornChildren 6 to 17 years - Living with two parents Both parents native 3,229 99.1% Native28 0.9% Foreign-bornBoth parents foreign-born 157 100.0% NativeOne native, one foreign-born parent 615 100.0% NativeChildren 6 to 17 years - Living with one parent Native parent 2,542 100.0% NativeForeign-born parent 403 48.9% Native421 51.1% Foreign-born
Grandparents responsible for own grandchildren in Winter Haven
Grandparents (30 to 59 years) White / Caucasian 72 40.0% Responsible for grandchildren109 60.0% Not responsible for grandchildrenBlack or African American 97 51.0% Responsible for grandchildren93 49.0% Not responsible for grandchildrenOther race 123 100.0% Responsible for grandchildrenTwo or more races 22 100.0% Not responsible for grandchildrenWhite alone, not Hispanic / Latino 85 43.2% Responsible for grandchildren112 56.8% Not responsible for grandchildrenHispanic or Latino 53 38.8% Responsible for grandchildren84 61.2% Not responsible for grandchildrenGrandparents (60 years and over) White / Caucasian 45 25.1% Responsible for grandchildren135 74.9% Not responsible for grandchildrenBlack or African American 138 39.6% Responsible for grandchildren211 60.4% Not responsible for grandchildrenOther race 12 100.0% Not responsible for grandchildrenTwo or more races 30 100.0% Not responsible for grandchildrenWhite alone, not Hispanic / Latino 53 27.4% Responsible for grandchildren141 72.6% Not responsible for grandchildrenHispanic or Latino 11 100.0% Not responsible for grandchildren