Races in Woodbury, Minnesota (MN) Detailed Stats
Data:
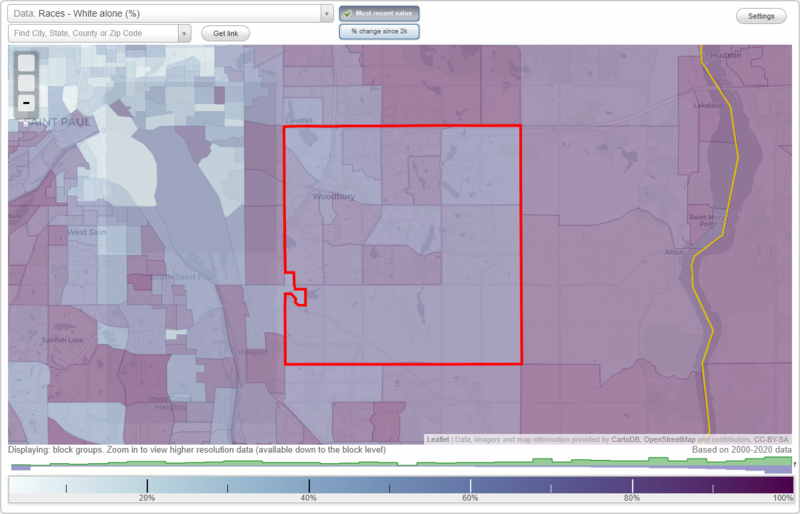
Races - White alone (%)
Races - White alone (% change since 2000)
Races - Black alone (%)
Races - Black alone (% change since 2000)
Races - American Indian alone (%)
Races - American Indian alone (% change since 2000)
Races - Asian alone (%)
Races - Asian alone (% change since 2000)
Races - Hispanic (%)
Races - Hispanic (% change since 2000)
Races - Native Hawaiian and Other Pacific Islander alone (%)
Races - Native Hawaiian and Other Pacific Islander alone (% change since 2000)
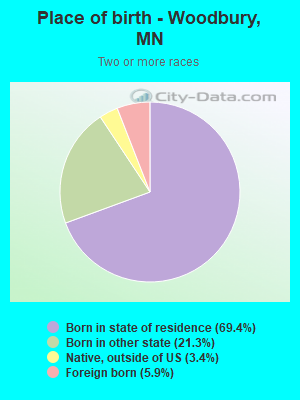
Races - Two or more races(%)
Races - Two or more races(% change since 2000)
Races - Other race alone (%)
Races - Other race alone (% change since 2000)
Racial diversity
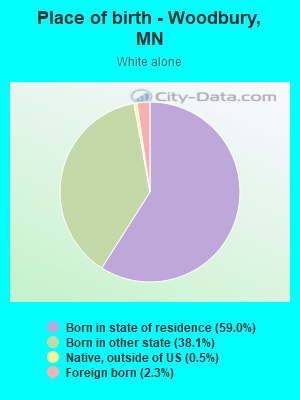
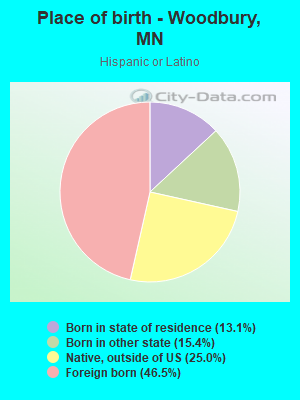
Place of birth - Born in state of residence (%)
Place of birth - Born in state of residence (%) - White
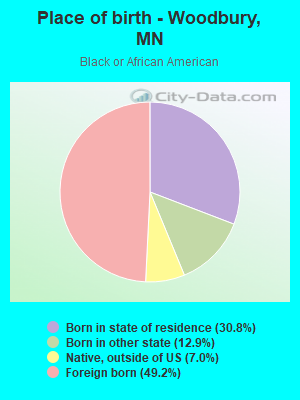
Place of birth - Born in state of residence (%) - Black or African American
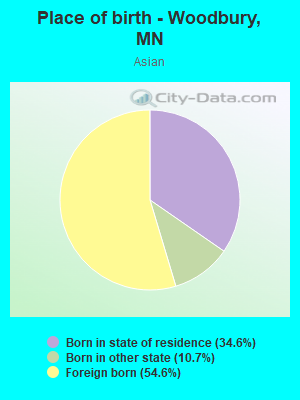
Place of birth - Born in state of residence (%) - Asian
Place of birth - Born in state of residence (%) - Hispanic or Latino
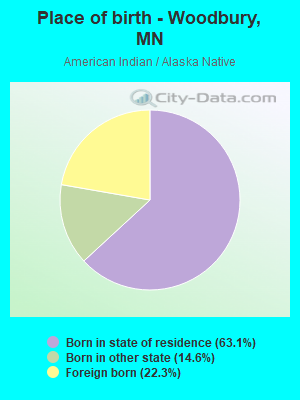
Place of birth - Born in state of residence (%) - American Indian and Alaska Native
Place of birth - Born in state of residence (%) - Multirace
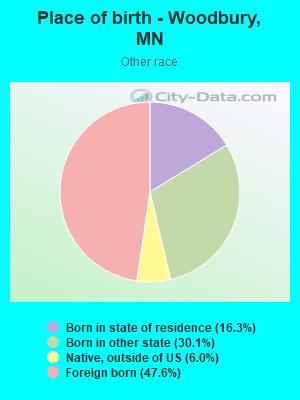
Place of birth - Born in state of residence (%) - Other Race
Place of birth - Born in other state (%)
Place of birth - Born in other state (%) - White
Place of birth - Born in other state (%) - Black or African American
Place of birth - Born in other state (%) - Asian
Place of birth - Born in other state (%) - Hispanic or Latino
Place of birth - Born in other state (%) - American Indian and Alaska Native
Place of birth - Born in other state (%) - Multirace
Place of birth - Born in other state (%) - Other Race
Place of birth - Native, outside of US (%)
Place of birth - Native, outside of US (%) - White
Place of birth - Native, outside of US (%) - Black or African American
Place of birth - Native, outside of US (%) - Asian
Place of birth - Native, outside of US (%) - Hispanic or Latino
Place of birth - Native, outside of US (%) - American Indian and Alaska Native
Place of birth - Native, outside of US (%) - Multirace
Place of birth - Native, outside of US (%) - Other Race
Place of birth - Foreign born (%)
Place of birth - Foreign born (%) - White
Place of birth - Foreign born (%) - Black or African American
Place of birth - Foreign born (%) - Asian
Place of birth - Foreign born (%) - Hispanic or Latino
Place of birth - Foreign born (%) - American Indian and Alaska Native
Place of birth - Foreign born (%) - Multirace
Place of birth - Foreign born (%) - Other Race
Residents speaking English at home (%)
Residents speaking English at home - Born in the United States (%)
Residents speaking English at home - Native, born elsewhere (%)
Residents speaking English at home - Foreign born (%)
Residents speaking Spanish at home (%)
Residents speaking Spanish at home - Born in the United States (%)
Residents speaking Spanish at home - Native, born elsewhere (%)
Residents speaking Spanish at home - Foreign born (%)
Residents speaking other language at home (%)
Residents speaking other language at home - Born in the United States (%)
Residents speaking other language at home - Native, born elsewhere (%)
Residents speaking other language at home - Foreign born (%)
Marital status - Never married (%)
Marital status - Now married (%)
Marital status - Separated (%)
Marital status - Widowed (%)
Marital status - Divorced (%)
Ancestries Reported - Arab (%)
Ancestries Reported - Czech (%)
Ancestries Reported - Danish (%)
Ancestries Reported - Dutch (%)
Ancestries Reported - English (%)
Ancestries Reported - French (%)
Ancestries Reported - French Canadian (%)
Ancestries Reported - German (%)
Ancestries Reported - Greek (%)
Ancestries Reported - Hungarian (%)
Ancestries Reported - Irish (%)
Ancestries Reported - Italian (%)
Ancestries Reported - Lithuanian (%)
Ancestries Reported - Norwegian (%)
Ancestries Reported - Polish (%)
Ancestries Reported - Portuguese (%)
Ancestries Reported - Russian (%)
Ancestries Reported - Scotch-Irish (%)
Ancestries Reported - Scottish (%)
Ancestries Reported - Slovak (%)
Ancestries Reported - Subsaharan African (%)
Ancestries Reported - Swedish (%)
Ancestries Reported - Swiss (%)
Ancestries Reported - Ukrainian (%)
Ancestries Reported - United States (%)
Ancestries Reported - Welsh (%)
Ancestries Reported - West Indian (%)
Ancestries Reported - Other (%)
Geographical mobility - Same house 1 year ago (%)
Geographical mobility - Same house 1 year ago (%) - White
Geographical mobility - Same house 1 year ago (%) - Black or African American
Geographical mobility - Same house 1 year ago (%) - Asian
Geographical mobility - Same house 1 year ago (%) - Hispanic or Latino
Geographical mobility - Same house 1 year ago (%) - American Indian and Alaska Native
Geographical mobility - Same house 1 year ago (%) - Multirace
Geographical mobility - Same house 1 year ago (%) - Other Race
Geographical mobility - Moved within same county (%)
Geographical mobility - Moved within same county (%) - White
Geographical mobility - Moved within same county (%) - Black or African American
Geographical mobility - Moved within same county (%) - Asian
Geographical mobility - Moved within same county (%) - Hispanic or Latino
Geographical mobility - Moved within same county (%) - American Indian and Alaska Native
Geographical mobility - Moved within same county (%) - Multirace
Geographical mobility - Moved within same county (%) - Other Race
Geographical mobility - Moved from different county within same state (%)
Geographical mobility - Moved from different county within same state (%) - White
Geographical mobility - Moved from different county within same state (%) - Black or African American
Geographical mobility - Moved from different county within same state (%) - Asian
Geographical mobility - Moved from different county within same state (%) - Hispanic or Latino
Geographical mobility - Moved from different county within same state (%) - American Indian and Alaska Native
Geographical mobility - Moved from different county within same state (%) - Multirace
Geographical mobility - Moved from different county within same state (%) - Other Race
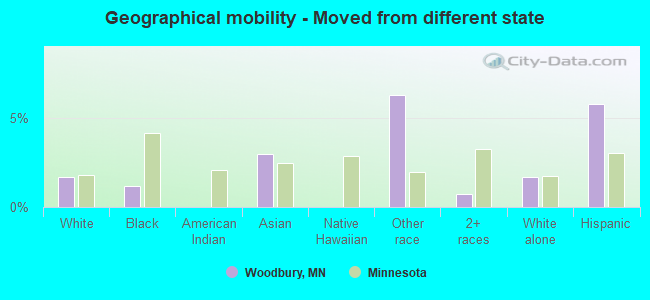
Geographical mobility - Moved from different state (%)
Geographical mobility - Moved from different state (%) - White
Geographical mobility - Moved from different state (%) - Black or African American
Geographical mobility - Moved from different state (%) - Asian
Geographical mobility - Moved from different state (%) - Hispanic or Latino
Geographical mobility - Moved from different state (%) - American Indian and Alaska Native
Geographical mobility - Moved from different state (%) - Multirace
Geographical mobility - Moved from different state (%) - Other Race
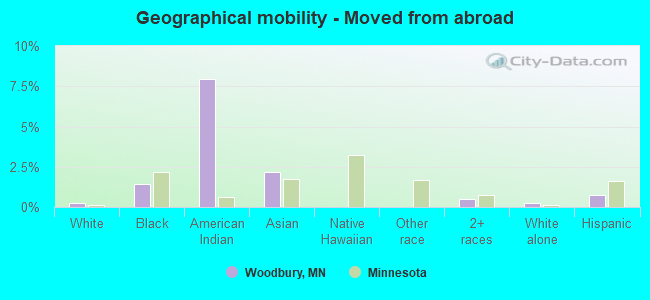
Geographical mobility - Moved from abroad (%)
Geographical mobility - Moved from abroad (%) - White
Geographical mobility - Moved from abroad (%) - Black or African American
Geographical mobility - Moved from abroad (%) - Asian
Geographical mobility - Moved from abroad (%) - Hispanic or Latino
Geographical mobility - Moved from abroad (%) - American Indian and Alaska Native
Geographical mobility - Moved from abroad (%) - Multirace
Geographical mobility - Moved from abroad (%) - Other Race
Place of birth for the foreign-born population - Ireland (%)
Place of birth for the foreign-born population - Denmark (%)
Place of birth for the foreign-born population - Norway (%)
Place of birth for the foreign-born population - Sweden (%)
Place of birth for the foreign-born population - United Kingdom (%)
Place of birth for the foreign-born population - England (%)
Place of birth for the foreign-born population - Scotland (%)
Place of birth for the foreign-born population - Other Northern Europe (%)
Place of birth for the foreign-born population - Austria (%)
Place of birth for the foreign-born population - Belgium (%)
Place of birth for the foreign-born population - France (%)
Place of birth for the foreign-born population - Germany (%)
Place of birth for the foreign-born population - Netherlands (%)
Place of birth for the foreign-born population - Switzerland (%)
Place of birth for the foreign-born population - Other Western Europe (%)
Place of birth for the foreign-born population - Greece (%)
Place of birth for the foreign-born population - Italy (%)
Place of birth for the foreign-born population - Portugal (%)
Place of birth for the foreign-born population - Spain (%)
Place of birth for the foreign-born population - Other Southern Europe (%)
Place of birth for the foreign-born population - Albania (%)
Place of birth for the foreign-born population - Belarus (%)
Place of birth for the foreign-born population - Bosnia and Herzegovina (%)
Place of birth for the foreign-born population - Bulgaria (%)
Place of birth for the foreign-born population - Croatia (%)
Place of birth for the foreign-born population - Czechoslovakia (%)
Place of birth for the foreign-born population - Hungary (%)
Place of birth for the foreign-born population - Latvia (%)
Place of birth for the foreign-born population - Lithuania (%)
Place of birth for the foreign-born population - North Macedonia (Macedonia) (%)
Place of birth for the foreign-born population - Moldova (%)
Place of birth for the foreign-born population - Poland (%)
Place of birth for the foreign-born population - Romania (%)
Place of birth for the foreign-born population - Russia (%)
Place of birth for the foreign-born population - Serbia (%)
Place of birth for the foreign-born population - Ukraine (%)
Place of birth for the foreign-born population - Other Eastern Europe (%)
Place of birth for the foreign-born population - China (%)
Place of birth for the foreign-born population - Hong Kong (%)
Place of birth for the foreign-born population - Taiwan (%)
Place of birth for the foreign-born population - Japan (%)
Place of birth for the foreign-born population - Korea (%)
Place of birth for the foreign-born population - Other Eastern Asia (%)
Place of birth for the foreign-born population - Afghanistan (%)
Place of birth for the foreign-born population - Bangladesh (%)
Place of birth for the foreign-born population - India (%)
Place of birth for the foreign-born population - Iran (%)
Place of birth for the foreign-born population - Kazakhstan (%)
Place of birth for the foreign-born population - Nepal (%)
Place of birth for the foreign-born population - Pakistan (%)
Place of birth for the foreign-born population - Sri Lanka (%)
Place of birth for the foreign-born population - Uzbekistan (%)
Place of birth for the foreign-born population - Other South Central Asia (%)
Place of birth for the foreign-born population - Burma (%)
Place of birth for the foreign-born population - Cambodia (%)
Place of birth for the foreign-born population - Indonesia (%)
Place of birth for the foreign-born population - Laos (%)
Place of birth for the foreign-born population - Malaysia (%)
Place of birth for the foreign-born population - Philippines (%)
Place of birth for the foreign-born population - Singapore (%)
Place of birth for the foreign-born population - Thailand (%)
Place of birth for the foreign-born population - Vietnam (%)
Place of birth for the foreign-born population - Other South Eastern Asia (%)
Place of birth for the foreign-born population - Armenia (%)
Place of birth for the foreign-born population - Iraq (%)
Place of birth for the foreign-born population - Israel (%)
Place of birth for the foreign-born population - Jordan (%)
Place of birth for the foreign-born population - Kuwait (%)
Place of birth for the foreign-born population - Lebanon (%)
Place of birth for the foreign-born population - Saudi Arabia (%)
Place of birth for the foreign-born population - Syria (%)
Place of birth for the foreign-born population - Turkey (%)
Place of birth for the foreign-born population - Yemen (%)
Place of birth for the foreign-born population - Other Western Asia (%)
Place of birth for the foreign-born population - Eritrea (%)
Place of birth for the foreign-born population - Ethiopia (%)
Place of birth for the foreign-born population - Kenya (%)
Place of birth for the foreign-born population - Somalia (%)
Place of birth for the foreign-born population - Uganda (%)
Place of birth for the foreign-born population - Zimbabwe (%)
Place of birth for the foreign-born population - Other Eastern Africa (%)
Place of birth for the foreign-born population - Cameroon (%)
Place of birth for the foreign-born population - Congo (%)
Place of birth for the foreign-born population - Democratic Republic of Congo (Zaire) (%)
Place of birth for the foreign-born population - Other Middle Africa (%)
Place of birth for the foreign-born population - Egypt (%)
Place of birth for the foreign-born population - Morocco (%)
Place of birth for the foreign-born population - Sudan (%)
Place of birth for the foreign-born population - Other Northern Africa (%)
Place of birth for the foreign-born population - South Africa (%)
Place of birth for the foreign-born population - Other Southern Africa (%)
Place of birth for the foreign-born population - Cabo Verde (%)
Place of birth for the foreign-born population - Ghana (%)
Place of birth for the foreign-born population - Liberia (%)
Place of birth for the foreign-born population - Nigeria (%)
Place of birth for the foreign-born population - Senegal (%)
Place of birth for the foreign-born population - Sierra Leone (%)
Place of birth for the foreign-born population - Other Western Africa (%)
Place of birth for the foreign-born population - Australia (%)
Place of birth for the foreign-born population - New Zealand (%)
Place of birth for the foreign-born population - Fiji (%)
Place of birth for the foreign-born population - Micronesia (%)
Place of birth for the foreign-born population - Bahamas (%)
Place of birth for the foreign-born population - Barbados (%)
Place of birth for the foreign-born population - Cuba (%)
Place of birth for the foreign-born population - Dominica (%)
Place of birth for the foreign-born population - Dominican Republic (%)
Place of birth for the foreign-born population - Grenada (%)
Place of birth for the foreign-born population - Haiti (%)
Place of birth for the foreign-born population - Jamaica (%)
Place of birth for the foreign-born population - St. Vincent and the Grenadines (%)
Place of birth for the foreign-born population - Trinidad and Tobago (%)
Place of birth for the foreign-born population - West Indies (%)
Place of birth for the foreign-born population - Other Caribbean (%)
Place of birth for the foreign-born population - Belize (%)
Place of birth for the foreign-born population - Costa Rica (%)
Place of birth for the foreign-born population - El Salvador (%)
Place of birth for the foreign-born population - Guatemala (%)
Place of birth for the foreign-born population - Honduras (%)
Place of birth for the foreign-born population - Mexico (%)
Place of birth for the foreign-born population - Nicaragua (%)
Place of birth for the foreign-born population - Panama (%)
Place of birth for the foreign-born population - Other Central America (%)
Place of birth for the foreign-born population - Argentina (%)
Place of birth for the foreign-born population - Bolivia (%)
Place of birth for the foreign-born population - Brazil (%)
Place of birth for the foreign-born population - Chile (%)
Place of birth for the foreign-born population - Colombia (%)
Place of birth for the foreign-born population - Ecuador (%)
Place of birth for the foreign-born population - Guyana (%)
Place of birth for the foreign-born population - Peru (%)
Place of birth for the foreign-born population - Uruguay (%)
Place of birth for the foreign-born population - Venezuela (%)
Place of birth for the foreign-born population - Other South America (%)
Place of birth for the foreign-born population - Canada (%)
Place of birth for the foreign-born population - Other Northern America (%)
Place of birth for the foreign-born population - Other (%)
Latest news about races in Woodbury, MN collected exclusively by city-data.com from local newspapers, TV, and radio stations
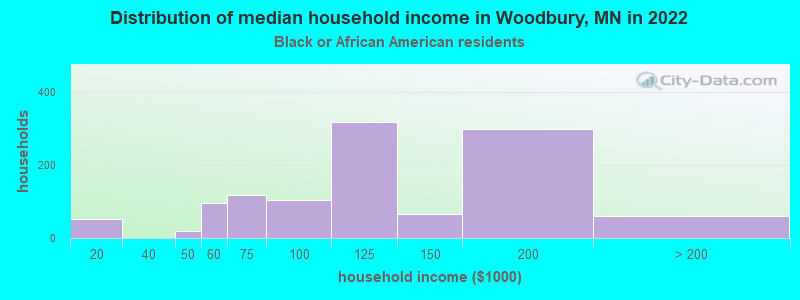
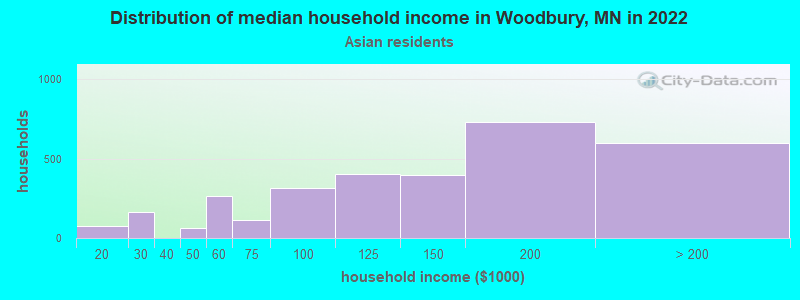
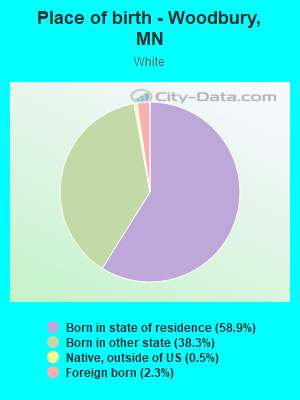
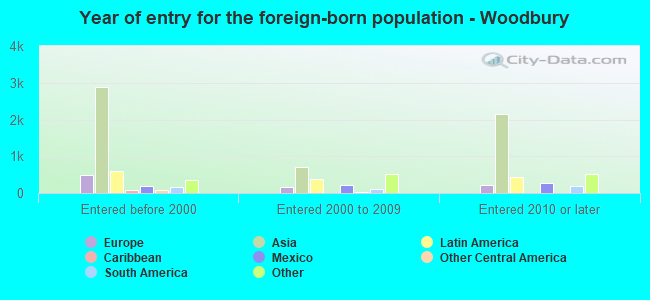
According to 2022 data, the most numerous races in Woodbury, MN are White alone (56,100 residents), Black alone (4,175 residents), and Hispanic (3,832 residents). 81.8% of Woodbury residents speak English at home. 12.3% of Woodbury, MN residents are foreign-born (7.4% born in Asia, 1.8% born in Latin America, 1.5% born in Africa), which is 35.0% greater than the foreign-born rate of 8.0% across the entire state of Minnesota.
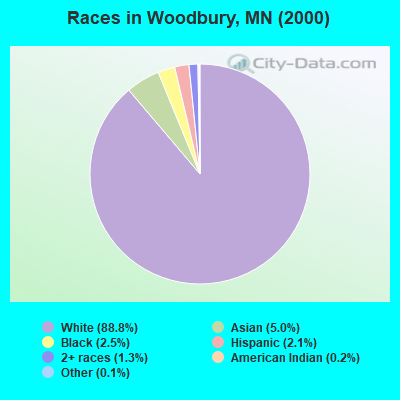
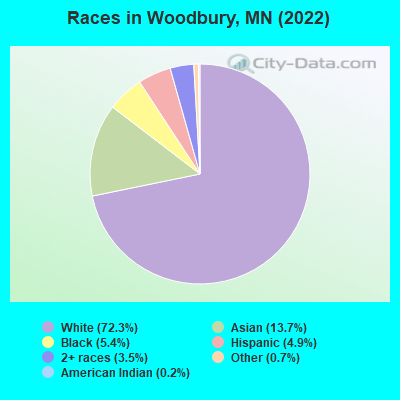
Race distribution in Woodbury
2000 2022
4,337,143 88.2% White alone 168,813 3.4% Black alone 143,382 2.9% Hispanic 141,083 2.9% Asian alone 70,304 1.4% Two or more races 52,009 1.1% American Indian alone 5,031 0.1% Other race alone 1,714 0.03% Native Hawaiian and Other
4,356,347 76.2% White alone 395,179 6.9% Black alone 333,830 5.8% Hispanic 294,800 5.2% Asian alone 259,649 4.5% Two or more races 42,125 0.7% American Indian alone 32,976 0.6% Other race alone 2,278 0.04% Native Hawaiian and Other
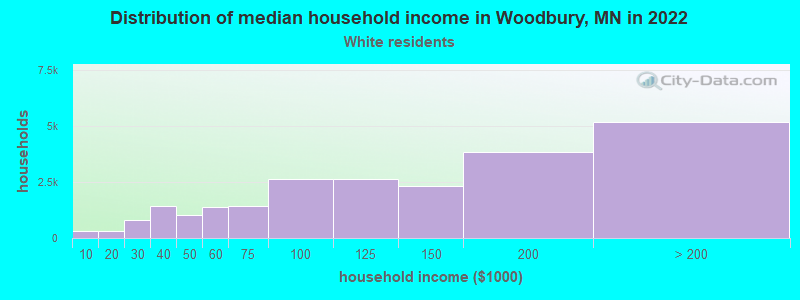
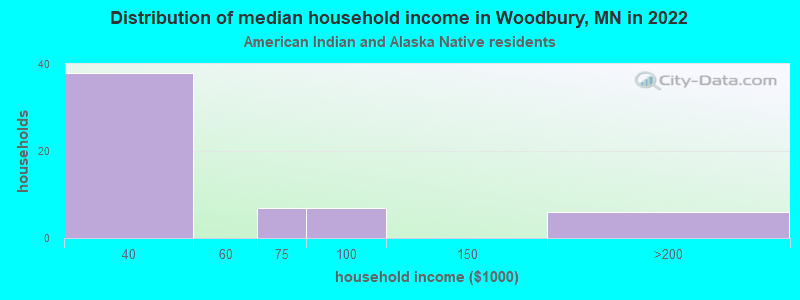
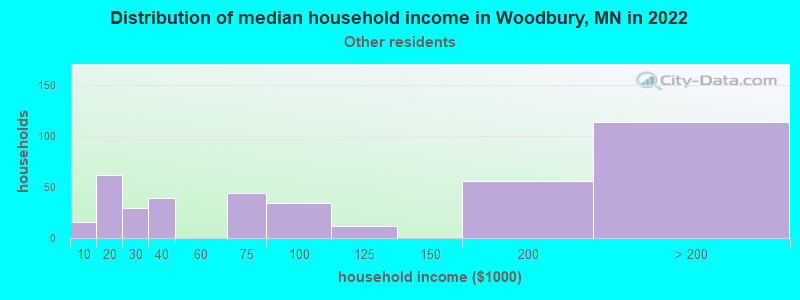
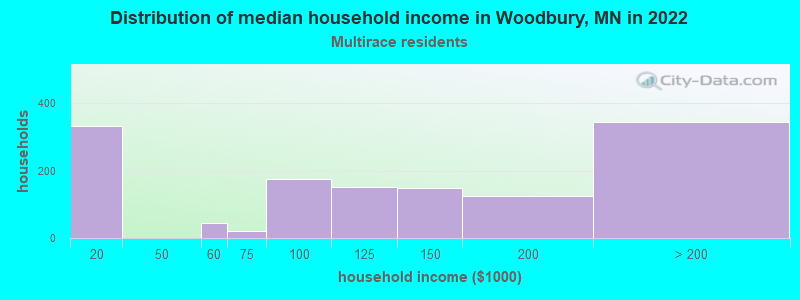
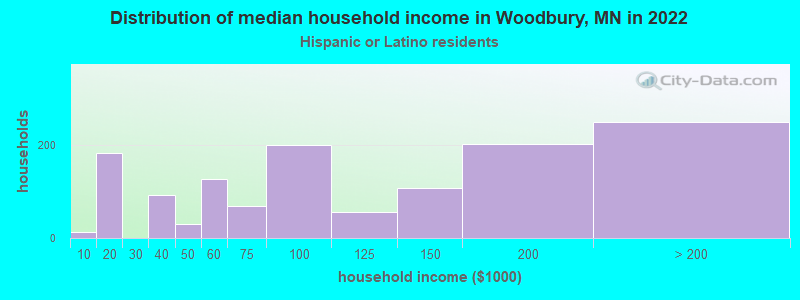
Income and house value in Woodbury Median household income in 2022 $118,927 White non-Hispanic householders$112,288 Black householders$138,908 Asian householders$90,850 Some other race householders$95,932 Two or more races householders$88,788 Hispanic or Latino race householdersMedian 2022 house value $450,217 White Non-Hispanic householders$429,446 Black or African American householders$357,006 American Indian or Alaska Native householders $553,294 Asian householders$411,011 Some other race householders$394,135 Two or more races householders$417,243 Hispanic or Latino householders
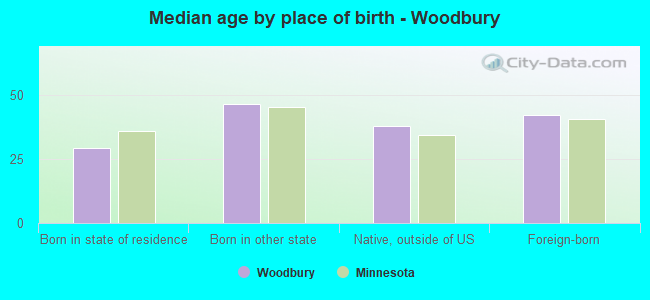
Median age by race in Woodbury
42.7 Median age for White residents42.1 44.2 25.8 Median age for Black or African American residents34.9 25.4 54.4 Median age for American Indian / Alaska Native residents54.5 -666,666,666.0 34.8 Median age for Asian residents33.8 35.0 -666,666,666.0 Median age for Native Hawaiian / Pacific Islander residents-666,666,666.0 -666,666,666.0 31.3 Median age for Other race residents31.8 25.6 17.3 Median age for Two or more races residents14.6 18.9 42.8 Median age for White alone residents42.2 44.3 34.9 Median age for Hispanic or Latino residents31.9 39.2
Owner/renter occupied households by race in Woodbury
House owners and renters - White residents 18,973 81.3% Owner occupied4,361 18.7% Renter occupiedHouse owners and renters - Black or African American residents 384 25.9% Owner occupied1,101 74.1% Renter occupiedHouse owners and renters - American Indian / Alaska Native residents 53 88.6% Owner occupied7 11.4% Renter occupiedHouse owners and renters - Asian residents 2,622 80.3% Owner occupied642 19.7% Renter occupiedHouse owners and renters - Native Hawaiian / Pacific Islander residents 30 100.0% Owner occupiedHouse owners and renters - Other race residents 210 76.6% Owner occupied64 23.4% Renter occupiedHouse owners and renters - Two or more races residents 642 54.0% Owner occupied547 46.0% Renter occupiedHouse owners and renters - White alone residents 18,920 81.4% Owner occupied4,310 18.6% Renter occupiedHouse owners and renters - Hispanic or Latino residents 418 44.8% Owner occupied515 55.2% Renter occupied
Language usage in Woodbury
English speakers - Total 81.8% of residents of Woodbury speak English at home.
3.8% of residents speak Spanish at home 1,073 38.7% Speak English very well1,703 61.3% Speak English less than very well15.5% of residents speak other language at home 8,054 70.7% Speak English very well3,340 29.3% Speak English less than very well
English speakers - Born in the United States 91.2% of residents of Woodbury speak English at home.
1.7% of residents speak Spanish at home 344 86.2% Speak English very well55 13.8% Speak English less than very well6.0% of residents speak other language at home 1,154 80.5% Speak English very well280 19.5% Speak English less than very well
English speakers - Native, born elsewhere 65.5% of residents of Woodbury speak English at home.
15.4% of residents speak Spanish at home 124 72.9% Speak English very well46 27.1% Speak English less than very well6.0% of residents speak other language at home 66 100.0% Speak English very well
English speakers - Foreign-born 21.4% of residents of Woodbury speak English at home.
13.2% of residents speak Spanish at home 319 21.5% Speak English very well1,167 78.5% Speak English less than very well69.4% of residents speak other language at home 5,594 71.5% Speak English very well2,225 28.5% Speak English less than very well
White (Caucasian) - Speak only English Native:
97.2% (50,716)Foreign-born:
32.1% (407)
White (Caucasian) - Speak another language Native:
2.8% (1,439)Foreign-born:
67.9% (862)
Black or African American - Speak only English Native:
67.4% (1,045)Foreign-born:
10.0% (223)
Black or African American - Speak another language Native:
41.3% (640)Foreign-born:
76.1% (1,697)
American Indian / Alaska Native - Speak another language Native:
53.5% (81)Foreign-born:
100.0% (43)
Asian - Speak only English Native:
39.0% (1,450)Foreign-born:
19.1% (1,032)
Asian - Speak another language Native:
61.0% (2,272)Foreign-born:
80.9% (4,376)
Other race - Speak only English Native:
61.5% (430)Foreign-born:
6.5% (50)
Other race - Speak another language Native:
32.7% (229)Foreign-born:
94.4% (719)
Two or more races - Speak only English Native:
89.6% (3,273)Foreign-born:
1.2% (3)
Two or more races - Speak another language Native:
10.4% (379)Foreign-born:
100.0% (257)
White alone - Speak only English Native:
97.4% (50,486)Foreign-born:
31.6% (399)
White alone - Speak another language Native:
2.6% (1,367)Foreign-born:
68.4% (862)
Hispanic or Latino - Speak only English Native:
58.1% (1,276)Foreign-born:
7.4% (100)
Hispanic or Latino - Speak another language Native:
42.1% (926)Foreign-born:
92.7% (1,256)
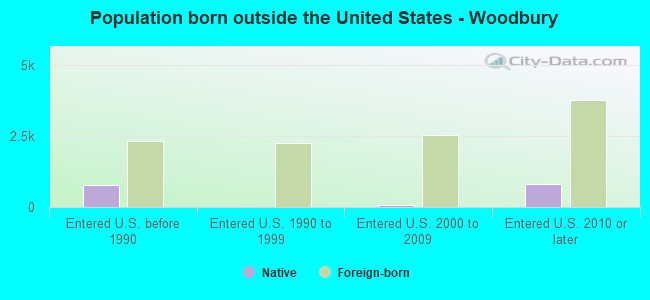
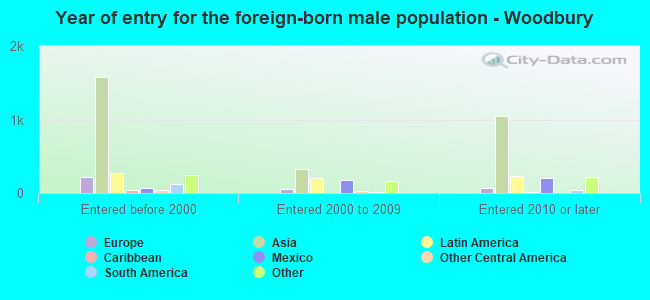
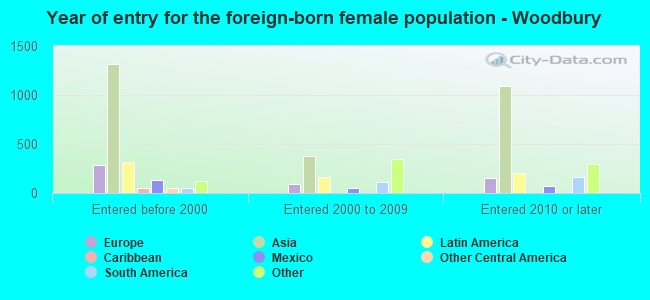
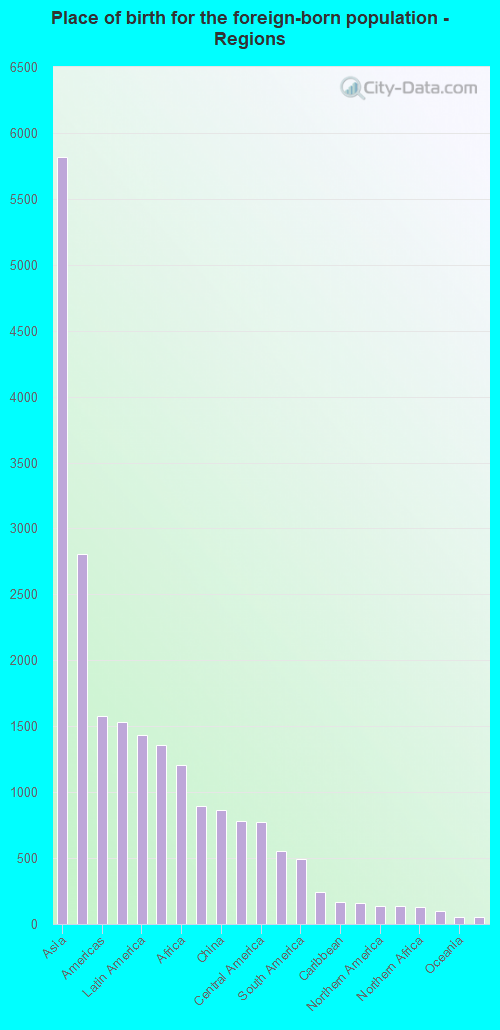
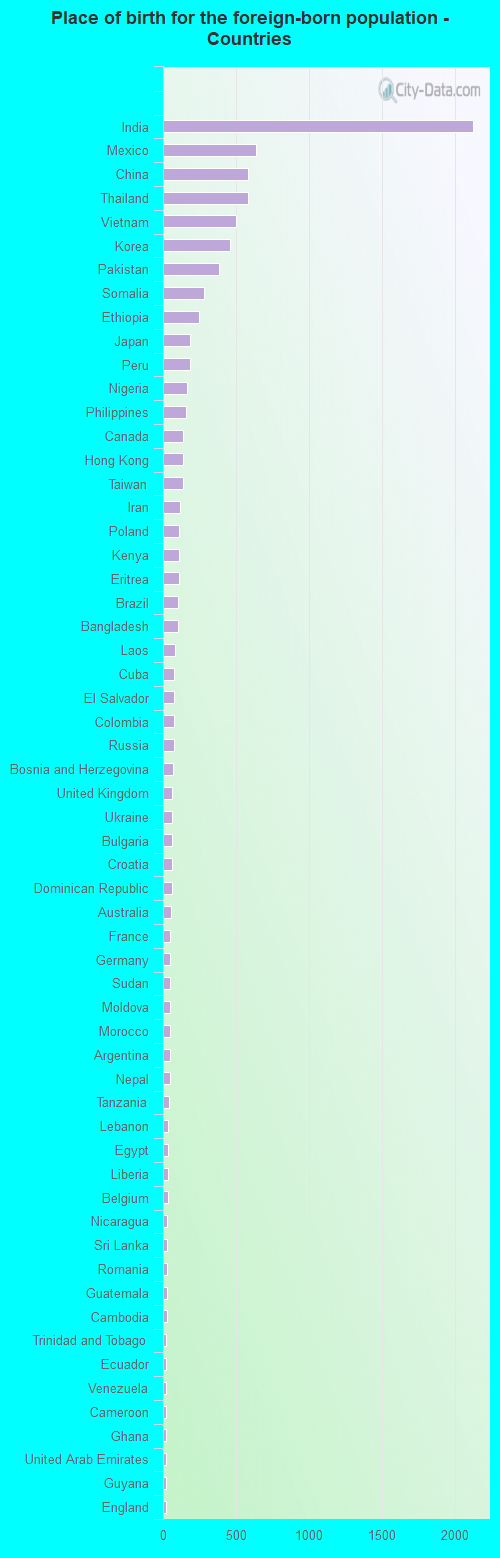
Foreign-born residents in Woodbury 9,549 residents are foreign born (7.4% Asia , 1.8% Latin America , 1.5% Africa ).
This city:
12.3%Minnesota:
8.5%
Marital status for residents in Woodbury Marital status - White (Caucasian) population 15 years and over
Males 29.5% Never married58.7% Now married0.0% Separated2.0% Widowed9.8% DivorcedFemales 28.3% Never married51.7% Now married0.7% Separated7.1% Widowed12.1% DivorcedWomen who gave birth in the past 12 months Now married:
77.0% (592)Unmarried:
23.0% (177)
Women who did not give birth in the past 12 months Now married:
43.3% (4,722)Unmarried:
56.7% (6,175)
Marital status - Black or African American population 15 years and over
Males 41.4% Never married54.0% Now married1.8% Separated0.3% Widowed2.5% DivorcedFemales 55.9% Never married34.7% Now married1.6% Separated1.9% Widowed6.0% DivorcedWomen who did not give birth in the past 12 months Now married:
31.0% (457)Unmarried:
69.0% (1,015)
Marital status - American Indian / Alaska Native population 15 years and over
Males 20.5% Never married79.5% Now married0.0% Separated0.0% Widowed0.0% DivorcedFemales 25.7% Never married74.3% Now married0.0% Separated0.0% Widowed0.0% DivorcedWomen who did not give birth in the past 12 months Now married:
78.7% (50)Unmarried:
21.3% (14)
Marital status - Asian population 15 years and over
Males 21.8% Never married72.8% Now married0.0% Separated0.0% Widowed5.5% DivorcedFemales 33.7% Never married58.6% Now married0.6% Separated1.6% Widowed5.6% DivorcedWomen who gave birth in the past 12 months Now married:
44.3% (61)Unmarried:
55.7% (77)
Women who did not give birth in the past 12 months Now married:
56.8% (1,806)Unmarried:
43.2% (1,374)
Marital status - Native Hawaiian / Pacific Islander population 15 years and over
Males 0.0% Never married0.0% Now married0.0% Separated100.0% Widowed0.0% DivorcedFemales 100.0% Never married0.0% Now married0.0% Separated0.0% Widowed0.0% DivorcedWomen who did not give birth in the past 12 months Now married:
0.0% (0)Unmarried:
100.0% (26)
Marital status - Other race population 15 years and over
Males 75.0% Never married13.6% Now married0.0% Separated0.0% Widowed11.5% DivorcedFemales 37.0% Never married37.2% Now married12.9% Separated1.8% Widowed11.1% DivorcedWomen who gave birth in the past 12 months Now married:
100.0% (39)Unmarried:
0.0% (0)
Women who did not give birth in the past 12 months Now married:
42.1% (165)Unmarried:
57.9% (227)
Marital status - Two or more races population 15 years and over
Males 50.5% Never married44.0% Now married0.0% Separated0.0% Widowed5.5% DivorcedFemales 39.9% Never married49.4% Now married0.0% Separated1.1% Widowed9.6% DivorcedWomen who gave birth in the past 12 months Now married:
100.0% (41)Unmarried:
0.0% (0)
Women who did not give birth in the past 12 months Now married:
42.1% (449)Unmarried:
57.9% (617)
Marital status - White alone, not Hispanic / Latino population 15 years and over
Males 29.6% Never married58.5% Now married0.0% Separated2.0% Widowed9.8% DivorcedFemales 28.1% Never married51.8% Now married0.7% Separated7.1% Widowed12.2% DivorcedWomen who gave birth in the past 12 months Now married:
77.0% (592)Unmarried:
23.0% (177)
Women who did not give birth in the past 12 months Now married:
43.5% (4,722)Unmarried:
56.5% (6,124)
Marital status - Hispanic or Latino population 15 years and over
Males 39.4% Never married44.0% Now married1.0% Separated0.0% Widowed15.6% DivorcedFemales 38.3% Never married48.0% Now married3.1% Separated2.9% Widowed7.7% DivorcedWomen who did not give birth in the past 12 months Now married:
49.4% (511)Unmarried:
50.6% (522)
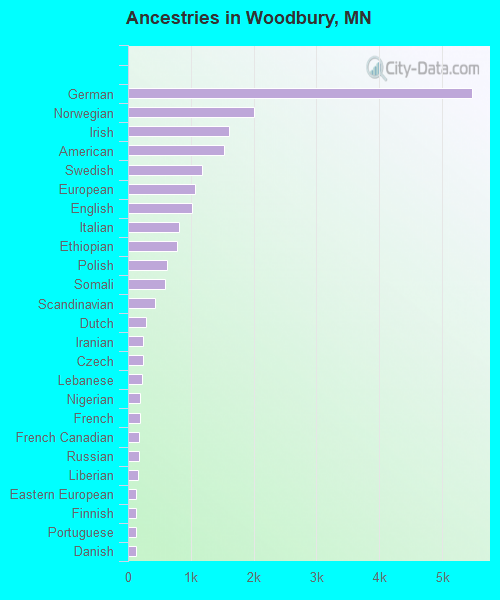
Ancestries in Woodbury
5,472 17.1% German1,999 6.2% Norwegian1,611 5.0% Irish1,521 4.8% American1,175 3.7% Swedish1,073 3.4% European1,014 3.2% English804 2.5% Italian773 2.4% Ethiopian614 1.9% Polish586 1.8% Somali433 1.4% Scandinavian287 0.9% Dutch242 0.8% Iranian241 0.8% Czech216 0.7% Lebanese187 0.6% Nigerian185 0.6% French177 0.6% French Canadian169 0.5% Russian157 0.5% Liberian131 0.4% Eastern European128 0.4% Finnish124 0.4% Portuguese122 0.4% Danish121 0.4% Swiss114 0.4% Belgian86 0.3% African83 0.3% Ukrainian76 0.2% Romanian73 0.2% Bulgarian71 0.2% Scottish62 0.2% Northern European53 0.2% Scotch-Irish49 0.2% Welsh48 0.2% Croatian45 0.1% Palestinian38 0.1% Yugoslavian36 0.1% Moroccan35 0.1% British35 0.1% Sudanese32 0.1% Canadian30 0.09% Lithuanian26 0.08% Slovak22 0.07% Hungarian21 0.07% Albanian20 0.06% Austrian15 0.05% Turkish10 0.03% Macedonian10 0.03% Haitian9 0.03% Latvian8 0.03% South African6 0.02% Syrian5 0.02% Slovene
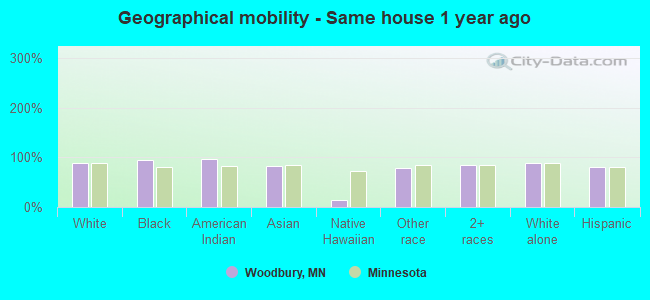
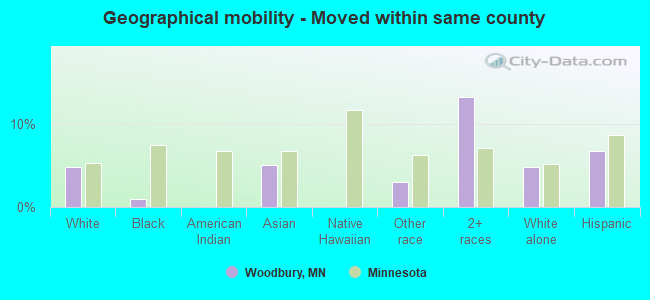
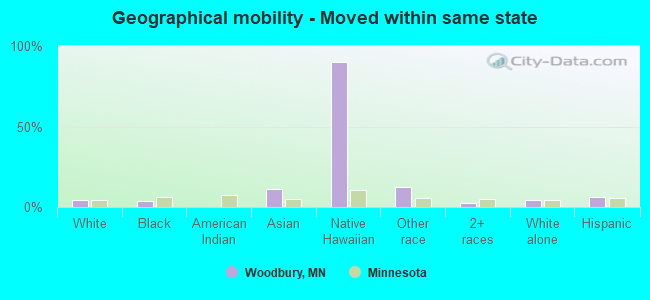
Geographical mobility in Woodbury Same house 1 year ago 48,675 88.8% White (Caucasian)3,688 93.6% Black or African American178 96.1% American Indian / Alaska Native8,615 81.7% Asian3 14.4% Native Hawaiian / Pacific Islander1,180 77.5% Other race3,668 84.3% Two or more races48,365 88.7% White alone, not Hispanic / Latino2,772 80.1% Hispanic or LatinoMoved within same county 2,641 4.8% White / Caucasian40 1.0% Black or African American534 5.1% Asian47 3.1% Other race582 13.4% Two or more races2,641 4.8% White alone, not Hispanic / Latino236 6.8% Hispanic or LatinoMoved within same state 2,438 4.4% White / Caucasian138 3.5% Black or African American1,175 11.1% Asian20 89.8% Native Hawaiian / Pacific Islander190 12.5% Other race113 2.6% Two or more races2,438 4.5% White alone, not Hispanic / Latino214 6.2% Hispanic or LatinoMoved from different state 921 1.7% White / Caucasian46 1.2% Black or African American313 3.0% Asian96 6.3% Other race33 0.8% Two or more races921 1.7% White alone, not Hispanic / Latino199 5.8% Hispanic or LatinoMoved from abroad 139 0.3% White57 1.4% Black or African American15 8.0% American Indian / Alaska Native232 2.2% Asian23 0.5% Two or more races139 0.3% White alone, not Hispanic / Latino25 0.7% Hispanic or Latino
Children Nativity (place of birth) in Woodbury
Children under 6 years - Living with two parents Both parents native 2,578 100.0% NativeBoth parents foreign-born 1,535 100.0% NativeOne native, one foreign-born parent 755 100.0% NativeChildren under 6 years - Living with one parent Native parent 472 100.0% NativeForeign-born parent 153 100.0% NativeChildren 6 to 17 years - Living with two parents Both parents native 8,368 100.0% NativeBoth parents foreign-born 844 75.6% Native272 24.4% Foreign-bornOne native, one foreign-born parent 841 100.0% NativeChildren 6 to 17 years - Living with one parent Native parent 2,880 100.0% NativeForeign-born parent 439 50.0% Native439 50.0% Foreign-born
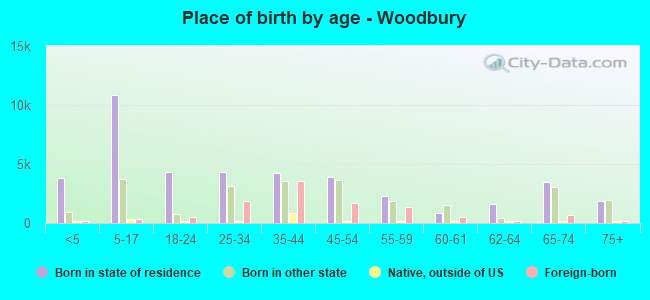
Place of birth for residents in Woodbury
Grandparents responsible for own grandchildren in Woodbury
Grandparents (30 to 59 years) White / Caucasian 74 58.8% Responsible for grandchildren52 41.2% Not responsible for grandchildrenBlack or African American 16 100.0% Not responsible for grandchildrenAmerican Indian / Alaska Native 35 100.0% Responsible for grandchildrenAsian 21 100.0% Not responsible for grandchildrenTwo or more races 4 100.0% Not responsible for grandchildrenWhite alone, not Hispanic / Latino 74 58.3% Responsible for grandchildren53 41.7% Not responsible for grandchildrenHispanic or Latino 14 100.0% Responsible for grandchildrenGrandparents (60 years and over) White / Caucasian 35 10.5% Responsible for grandchildren299 89.5% Not responsible for grandchildrenBlack or African American 19 100.0% Not responsible for grandchildrenAsian 32 100.0% Not responsible for grandchildrenWhite alone, not Hispanic / Latino 20 6.3% Responsible for grandchildren299 93.7% Not responsible for grandchildrenHispanic or Latino 8 67.5% Responsible for grandchildren4 32.5% Not responsible for grandchildren