Nevada
Public finance
The budget is prepared biennially by the Budget Division of the Department of Administration and submitted by the governor to the legislature, which has unlimited power to change it.
Nevada's two largest revenue sources, sales and gaming taxes, surged during the mid-1990s. Percentage fee collections, the State's largest source of gaming revenue, had gains of at least 6% every year between 1993 and 1996. Growth in the general fund occurred at comparable levels throughout the 1990s.
General fund appropriations for 2002/03 totaled $1.89 billion, including $990.4 million for education, $544 million for human services, and $207 million for public safety. For the 2003/04 appropriations totaled $2.35 billion, including $1.29 billion for education, $645 million for human services, and $224 million for public safety.
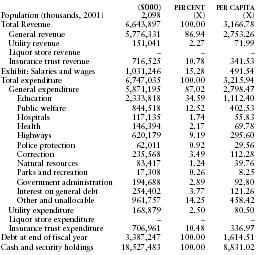
The following table from the US Census Bureau contains information on revenues, expenditures, indebtedness, and cash/securities for 2001.
| ($000) | PERCENT | PER CAPITA | |
| Population (thousands, 2001) | 2,098 | (X) | (X) |
| Total Revenue | 6,643,897 | 100.00 | 3,166.78 |
| General revenue | 5,776,331 | 86.94 | 2,753.26 |
| Utility revenue | 151,041 | 2.27 | 71.99 |
| Liquor store revenue | – | – | – |
| Insurance trust revenue | 716,525 | 10.78 | 341.53 |
| Exhibit: Salaries and wages | 1,031,246 | 15.28 | 491.54 |
| Total expenditure | 6,747,035 | 100.00 | 3,215.94 |
| General expenditure | 5,871,195 | 87.02 | 2,798.47 |
| Education | 2,333,818 | 34.59 | 1,112.40 |
| Public welfare | 844,518 | 12.52 | 402.53 |
| Hospitals | 117,135 | 1.74 | 55.83 |
| Health | 146,394 | 2.17 | 69.78 |
| Highways | 620,179 | 9.19 | 295.60 |
| Police protection | 62,011 | 0.92 | 29.56 |
| Correction | 235,568 | 3.49 | 112.28 |
| Natural resources | 83,417 | 1.24 | 39.76 |
| Parks and recreation | 17,308 | 0.26 | 8.25 |
| Government administration | 194,688 | 2.89 | 92.80 |
| Interest on general debt | 254,402 | 3.77 | 121.26 |
| Other and unallocable | 961,757 | 14.25 | 458.42 |
| Utility expenditure | 168,879 | 2.50 | 80.50 |
| Liquor store expenditure | – | – | – |
| Insurance trust expenditure | 706,961 | 10.48 | 336.97 |
| Debt at end of fiscal year | 3,387,247 | 100.00 | 1,614.51 |
| Cash and security holdings | 18,527,483 | 100.00 | 8,831.02 |