Ohio
Political parties
Ohio has sent seven native sons and one other state resident to the White House—equaling Virginia as the "mother of presidents." The state's two major political parties, Democratic and Republican, have dominated the political scene since 1856.
Ohioans scattered their votes among various political factions until 1836, when they rallied behind state resident William Henry Harrison and the Whig Party; they again supported Harrison in 1840, helping him win his second bid for the presidency. Whigs and Democrats divided the votes in 1844, 1848, and 1852; in 1856, however, Ohio supported the newly formed Republican Party, and after the Civil War, seven of the country's next 12 presidents were Ohio-born Republicans, beginning with Grant and ending with Harding. From 1856 to 1984, Ohioans voted for the Republican candidate in all presidential elections except those in which the following six Democrats were elected: Woodrow Wilson (twice), Franklin D. Roosevelt (three times), Harry S. Truman, Lyndon B. Johnson, Jimmy Carter, and Bill Clinton (twice). In 1920, when the presidential candidates of both major parties were Ohioans, the Republican, Warren G. Harding, carried Ohio as well as the nation.
Political bossism flourished in Ohio during the last quarter of the 19th century, when the state government was controlled by Republicans Mark Hanna in Cleveland and George B. Cox in Cincinnati. Hanna played an influential role in Republican national politics; in 1896, his handpicked candidate, William McKinley, was elected to the presidency. But the despotism of the bosses and the widespread corruption in city governments led to public demands for reform. In Toledo, a reform mayor, Samuel "Golden Rule" Jones, began to clean house in 1897. Four years later, another group of reformers, led by Mayor Tom L. Johnson, ousted the Hanna machine and instituted honest government in Cleveland. At the time, journalist Lincoln Steffens called Cleveland "the best-governed city in the US" and Cincinnati "the worst." The era of bossism ended for Cincinnati in 1905, when the voters overthrew the Cox machine, elected a reform mayor on a fusion ticket, and instituted reforms that in 1925 made Cincinnati the first major US city with a nonpartisan city-manager form of government.
With the decline of big-city political machines, ticket splitting has become a regular practice among Ohio voters in state and local contests. Governor Frank J. Lausche, a Democrat, was elected to an unprecedented five two-year terms (1945–47, 1949–57), and Republican James A. Rhodes served four four-year terms (1963–71, 1975–83). In 1982, Ohioans elected a Democratic governor, Richard F. Celeste, and Democrats swept all state offices and won control of both houses of the state legislature. Republican George Voinovich won the governorship in 1990 and again in 1994. In 1998 elections, Republican candidate Bob Taft won the governor's office; he was reelected in 2002. In 2003 the Republicans also dominated the state senate (22 seats as opposed to the Democrats' 11), and they retained control over the House—there were 62 Republicans and 37 Democrats in the state house.
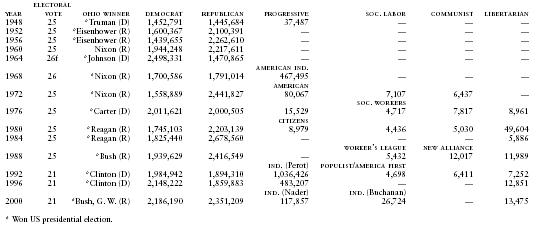
Ohio Presidential Vote by Political Parties, 1948–2000
| YEAR | ELECTORAL VOTE | OHIO WINNER | DEMOCRAT | REPUBLICAN | PROGRESSIVE | SOC. LABOR | COMMUNIST | LIBERTARIAN |
| * Won US presidential election. | ||||||||
| 1948 | 25 | *Truman (D) | 1,452,791 | 1,445,684 | 37,487 | — | — | — |
| 1952 | 25 | *Eisenhower (R) | 1,600,367 | 2,100,391 | — | — | — | — |
| 1956 | 25 | *Eisenhower (R) | 1,439,655 | 2,262,610 | — | — | — | — |
| 1960 | 25 | Nixon (R) | 1,944,248 | 2,217,611 | — | — | — | — |
| 1964 | 26f | *Johnson (D) | 2,498,331 | 1,470,865 | — | — | — | — |
| AMERICAN IND. | ||||||||
| 1968 | 26 | *Nixon (R) | 1,700,586 | 1,791,014 | 467,495 | — | — | — |
| AMERICAN | ||||||||
| 1972 | 25 | *Nixon (R) | 1,558,889 | 2,441,827 | 80,067 | 7,107 | 6,437 | — |
| SOC. WORKERS | ||||||||
| 1976 | 25 | *Carter (D) | 2,011,621 | 2,000,505 | 15,529 | 4,717 | 7,817 | 8,961 |
| CITIZENS | ||||||||
| 1980 | 25 | *Reagan (R) | 1,745,103 | 2,203,139 | 8,979 | 4,436 | 5,030 | 49,604 |
| 1984 | 25 | *Reagan (R) | 1,825,440 | 2,678,560 | — | — | — | 5,886 |
| WORKER's LEAGUE | NEW ALLIANCE | |||||||
| 1988 | 25 | *Bush (R) | 1,939,629 | 2,416,549 | — | 5,432 | 12,017 | 11,989 |
| IND. (Perot) | POPULIST/AMERICA FIRST | |||||||
| 1992 | 21 | *Clinton (D) | 1,984,942 | 1,894,310 | 1,036,426 | 4,698 | 6,411 | 7,252 |
| 1996 | 21 | *Clinton (D) | 2,148,222 | 1,859,883 | 483,207 | — | — | 12,851 |
| IND. (Nader) | IND. (Buchanan) | |||||||
| 2000 | 21 | *Bush, G. W. (R) | 2,186,190 | 2,351,209 | 117,857 | 26,724 | — | 13,475 |
Following November 2002 elections, there were six Democrats and 12 Republicans serving as US Representatives. In 1992 both Ohio senators—John Glenn, elected to a fourth term in 1992, and Howard Metzenbaum, elected to a third term in 1988—were Democrats. However, in 1994 Metzenbaum retired and a Republican, Mike DeWine, took the seat (he was reelected in 2000). In 1998, the seat held by retiring Senator John Glenn was won by former Ohio governor, Republican George Voinovich.
In general, third parties have fared poorly in Ohio since 1856. Exceptions were the 1968 presidential election, in which American Independent Party candidate George Wallace garnered nearly 12% of Ohio's popular vote, and the 1992 presidential election, when Independent Ross Perot captured 21% of the vote. A more typical voting pattern was displayed in the 1976 presidential election when the two major parties together received 97.7% of the total votes cast, and only 2.3% of the votes were split among minor parties and independents. In 2000, independent candidate Ralph Nader took 3% of the vote, and independent candidate Pat Buchanan won 1%.
The result was not nearly so close in 1980, when Ronald Reagan, the Republican presidential nominee, won 51% of the popular vote to 41% for Jimmy Carter (with 6% going to John Anderson and 2% to minor party candidates), or in 1984, when Reagan won 59% of the popular vote to defeat Walter Mondale in the state. Republican George Bush won 55% of the vote in 1988. In 1992, however, Bush lost the state to Democratic nominee Bill Clinton, who captured 40% of the vote to Bush's 38%. In 1996, Clinton won 47% of the vote, Republican Bob Dole won 41%, and Independent Ross Perot received 11%. In 2000, Republican George W. Bush won 50% of the vote to Democrat Al Gore's 46%. In 2002 there were 7,104,549 registered voters. In 1998, 17% of registered voters were Democratic, 18% Republican, and 65% unaffiliated or members of other parties. The state had 21 electoral votes in the 2000 presidential election.