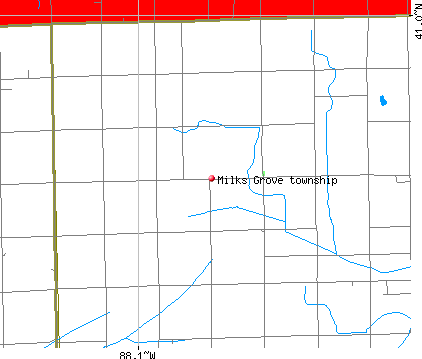
Milks Grove township, Iroquois County, Illinois (IL) detailed profile
Number of foreign born residents: 7 (100% naturalized citizens)
| Milks Grove township: | 6.8% |
| Whole state: | 12.3% |
62% of Milks Grove township residents lived in the same house 5 years ago.
Out of people who lived in different houses, 74% lived in this county.
Out of people who lived in different counties, 100% lived in Illinois.
Place of birth for U.S.-born residents:
- This state: 158
- Northeast: 0
- Midwest: 16
- South: 0
- West: 0
Percentage of households with unmarried partners: 4.4%
Likely homosexual households (counted as self-reported same-sex unmarried-partner households)
- Lesbian couples: 2.9% of all households
- Gay men: 0.0% of all households
Housing units in structures:
- One, detached: 80
Housing units in Milks Grove township with a mortgage: 17 (5 second mortgage, 0 home equity loan, 0 both second mortgage and home equity loan)
Houses without a mortgage: 12
Most common first ancestries reported in Milks Grove township:
- German (55.9%)
- French (except Basque) (12.6%)
- Danish (4.9%)
- British (4.2%)
- French Canadian (4.2%)
- Irish (3.5%)
- Swedish (3.5%)
Most common places of birth for the foreign-born residents:
- Guatemala (100%)
Means of transportation to work:
- Drove a car alone: 55 (50%)
- Carpooled: 18 (17%)
- Walked: 7 (6%)
- Worked at home: 29 (27%)
Most commonly used house heating fuel:
- Bottled, tank, or LP gas (85%)
- Fuel oil, kerosene, etc. (15%)
All residents speak only English at home
Household type by relationship:
Households: 186- In family households: 174 (50 male householders, 6 female householders)
57 spouses, 61 children (49 natural, 12 adopted, 0 stepchildren), 0 grandchildren, 0 brothers or sisters, 0 parents, 0 other relatives, 0 non-relatives
- In nonfamily households: 12 (7 male householders (7 living alone)), 5 female householders (5 living alone)), 0 nonrelatives
Size of family households: 22 2-persons, 11 3-persons, 23 4-persons,
Size of nonfamily households: 12 1-person,
39 married couples with children.
2 single-parent households (1 men, 1 women).
Private vs. public school enrollment:
Students in private schools in grades 1 to 8 (elementary and middle school): 0
| Here: | 0.0% |
| Illinois: | 13.4% |
Students in private schools in grades 9 to 12 (high school): 0
| Here: | 0.0% |
| Illinois: | 11.1% |