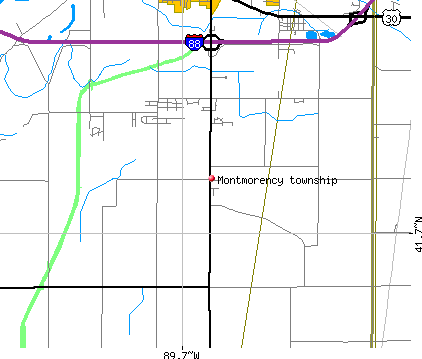
Montmorency township, Whiteside County, Illinois (IL) detailed profile
Number of foreign born residents: 3 (21% naturalized citizens)
| Montmorency township: | 3.0% |
| Whole state: | 12.3% |
66% of Montmorency township residents lived in the same house 5 years ago.
Out of people who lived in different houses, 82% lived in this county.
Out of people who lived in different counties, 60% lived in Illinois.
Place of birth for U.S.-born residents:
- This state: 1963
- Northeast: 22
- Midwest: 252
- South: 187
- West: 34
Median price asked for vacant for-sale houses in 2000: $41,300
Percentage of households with unmarried partners: 4.4%
Likely homosexual households (counted as self-reported same-sex unmarried-partner households)
- Lesbian couples: 0.2% of all households
- Gay men: 0.0% of all households
Housing units in structures:
- One, detached: 887
- One, attached: 4
- Two: 8
- 20 to 49: 3
- Mobile homes: 40
Median worth of mobile homes: $45,400
Housing units in Montmorency township with a mortgage: 456 (39 second mortgage, 75 home equity loan, 0 both second mortgage and home equity loan)
Houses without a mortgage: 293
- Metal and metal products (29%)
- Public administration (8%)
- Construction (7%)
- Accommodation and food services (5%)
- Agriculture, forestry, fishing and hunting (4%)
- Motor vehicle and parts dealers (3%)
- Department and other general merchandise stores (3%)
- Metal and metal products (18%)
- Health care (13%)
- Educational services (11%)
- Accommodation and food services (10%)
- Finance and insurance (6%)
- Department and other general merchandise stores (5%)
- Personal and laundry services (4%)
- Metal workers and plastic workers (12%)
- Electrical equipment mechanics and other installation, maintenance, and repair occupations including supervisors (7%)
- Other production occupations including supervisors (7%)
- Building and grounds cleaning and maintenance occupations (5%)
- Law enforcement workers including supervisors (4%)
- Vehicle and mobile equipment mechanics, installers, and repairers (4%)
- Driver/sales workers and truck drivers (4%)
- Other production occupations including supervisors (8%)
- Bookkeeping, accounting, and auditing clerks (5%)
- Building and grounds cleaning and maintenance occupations (5%)
- Information and record clerks except customer service representatives (4%)
- Secretaries and administrative assistants (4%)
- Metal workers and plastic workers (4%)
- Nursing, psychiatric, and home health aides (4%)
Most common first ancestries reported in Montmorency township:
- German (32.0%)
- English (10.2%)
- United States or American (10.0%)
- Irish (8.1%)
- Dutch (3.6%)
- Swedish (3.1%)
- Italian (1.7%)
Most common places of birth for the foreign-born residents:
- Mexico (77%)
- Germany (12%)
- Argentina (11%)
Means of transportation to work:
- Drove a car alone: 1,094 (84%)
- Carpooled: 138 (11%)
- Bus or trolley bus: 6 (0%)
- Walked: 12 (1%)
- Other means: 7 (1%)
- Worked at home: 51 (4%)
Most commonly used house heating fuel:
- Utility gas (76%)
- Electricity (12%)
- Bottled, tank, or LP gas (12%)
93.9% of residents of Montmorency township speak English at home.
5.4% of residents speak Spanish at home (41% speak English very well, 34% speak English well, 25% speak English not well).
0.7% of residents speak other Indo-European language at home (100% speak English very well).
Household type by relationship:
Households: 2,547- In family households: 2,387 (689 male householders, 72 female householders)
711 spouses, 811 children (716 natural, 21 adopted, 74 stepchildren), 68 grandchildren, 0 brothers or sisters, 7 parents, 12 other relatives, 17 non-relatives
- In nonfamily households: 160 (74 male householders (58 living alone)), 56 female householders (41 living alone)), 30 nonrelatives
Size of family households: 337 2-persons, 172 3-persons, 161 4-persons, 52 5-persons, 16 6-persons, 23 7-or-more-persons,
Size of nonfamily households: 99 1-person, 28 2-persons, 3 3-persons,
519 married couples with children.
77 single-parent households (30 men, 47 women).
Private vs. public school enrollment:
Students in private schools in grades 1 to 8 (elementary and middle school): 15
| Here: | 5.1% |
| Illinois: | 13.4% |
Students in private schools in grades 9 to 12 (high school): 9
| Here: | 5.7% |
| Illinois: | 11.1% |
Students in private undergraduate colleges: 9
| Here: | 9.6% |
| Illinois: | 25.8% |