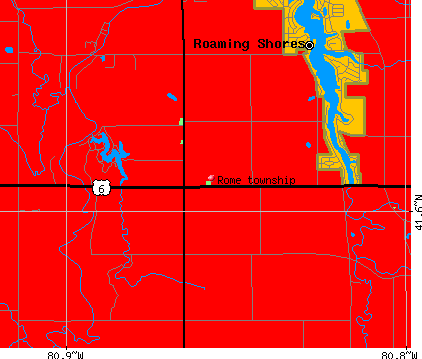
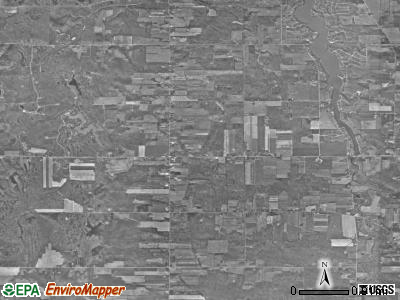
Rome township, Ashtabula County, Ohio (OH) detailed profile
Number of foreign born residents: 1 (91% naturalized citizens)
| Rome township: | 1.4% |
| Whole state: | 3.0% |
50% of Rome township residents lived in the same house 5 years ago.
Out of people who lived in different houses, 50% lived in this county.
Out of people who lived in different counties, 83% lived in Ohio.
Place of birth for U.S.-born residents:
- This state: 1322
- Northeast: 118
- Midwest: 68
- South: 81
- West: 12
Median price asked for vacant for-sale houses in 2000: $137,500
Percentage of households with unmarried partners: 4.2%
Likely homosexual households (counted as self-reported same-sex unmarried-partner households)
- Lesbian couples: 0.0% of all households
- Gay men: 0.2% of all households
Housing units in structures:
- One, detached: 669
- One, attached: 6
- Two: 7
- 3 or 4: 12
- 5 to 9: 3
- Mobile homes: 10
- Boats, RVs, vans, etc.: 6
Median worth of mobile homes: $85,000
Housing units in Rome township with a mortgage: 314 (34 second mortgage, 37 home equity loan, 0 both second mortgage and home equity loan)
Houses without a mortgage: 86
- Construction (16%)
- Agriculture, forestry, fishing and hunting (9%)
- Professional, scientific, and technical services (6%)
- Machinery (6%)
- Plastics and rubber products (5%)
- Metal and metal products (5%)
- Chemicals (4%)
- Health care (24%)
- Educational services (17%)
- Computer and electronic products (6%)
- Accommodation and food services (5%)
- Machinery (5%)
- Plastics and rubber products (4%)
- Construction (4%)
- Other production occupations including supervisors (12%)
- Electrical equipment mechanics and other installation, maintenance, and repair occupations including supervisors (8%)
- Metal workers and plastic workers (7%)
- Construction trades workers except carpenters, electricians, painters, plumbers, and construction laborers (6%)
- Driver/sales workers and truck drivers (5%)
- Agricultural workers including supervisors (5%)
- Other management occupations except farmers and farm managers (5%)
- Other production occupations including supervisors (10%)
- Secretaries and administrative assistants (9%)
- Health technologists and technicians (9%)
- Preschool, kindergarten, elementary and middle school teachers (8%)
- Assemblers and fabricators (8%)
- Registered nurses (6%)
- Building and grounds cleaning and maintenance occupations (6%)
Most common first ancestries reported in Rome township:
- German (27.3%)
- United States or American (10.8%)
- English (9.5%)
- Polish (8.6%)
- Irish (7.4%)
- Italian (5.9%)
- Hungarian (5.7%)
Most common places of birth for the foreign-born residents:
- Canada (36%)
- Germany (32%)
- Yugoslavia (32%)
Means of transportation to work:
- Drove a car alone: 661 (81%)
- Carpooled: 113 (14%)
- Walked: 1 (0%)
- Worked at home: 40 (5%)
Most commonly used house heating fuel:
- Electricity (28%)
- Fuel oil, kerosene, etc. (27%)
- Utility gas (17%)
- Bottled, tank, or LP gas (17%)
- Wood (8%)
- Other fuel (3%)
95.6% of residents of Rome township speak English at home.
1.7% of residents speak Spanish at home (50% speak English very well, 19% speak English well, 31% speak English not well).
2.6% of residents speak other Indo-European language at home (45% speak English very well, 18% speak English well, 38% speak English not well).
0.1% of residents speak other language at home (100% speak English very well).
Household type by relationship:
Households: 1,627- In family households: 1,408 (368 male householders, 79 female householders)
378 spouses, 517 children (467 natural, 19 adopted, 31 stepchildren), 19 grandchildren, 9 brothers or sisters, 6 parents, 8 other relatives, 24 non-relatives
- In nonfamily households: 219 (85 male householders (60 living alone)), 56 female householders (45 living alone)), 78 nonrelatives
Size of family households: 204 2-persons, 90 3-persons, 88 4-persons, 47 5-persons, 15 6-persons, 3 7-or-more-persons,
Size of nonfamily households: 105 1-person, 15 2-persons, 7 3-persons, 12 4-persons, 2 5-persons,
306 married couples with children.
48 single-parent households (18 men, 30 women).
Private vs. public school enrollment:
Students in private schools in grades 1 to 8 (elementary and middle school): 19
| Here: | 7.5% |
| Ohio: | 14.2% |
Students in private schools in grades 9 to 12 (high school): 0
| Here: | 0.0% |
| Ohio: | 10.9% |
Students in private undergraduate colleges: 2
| Here: | 4.4% |
| Ohio: | 23.4% |