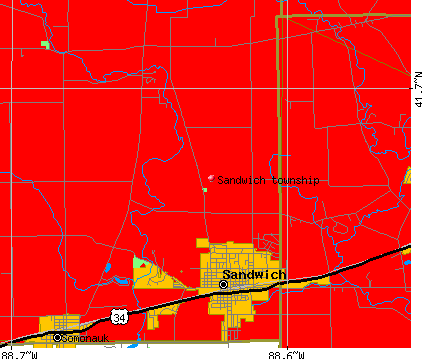
Sandwich township, DeKalb County, Illinois (IL) detailed profile
Number of foreign born residents: 5 (26% naturalized citizens)
| Sandwich township: | 5.3% |
| Whole state: | 12.3% |
50% of Sandwich township residents lived in the same house 5 years ago.
Out of people who lived in different houses, 39% lived in this county.
Out of people who lived in different counties, 84% lived in Illinois.
Place of birth for U.S.-born residents:
- This state: 5430
- Northeast: 88
- Midwest: 578
- South: 324
- West: 114
Median price asked for vacant for-sale houses in 2000: $98,600
Percentage of households with unmarried partners: 4.9%
Likely homosexual households (counted as self-reported same-sex unmarried-partner households)
- Lesbian couples: 0.0% of all households
- Gay men: 0.4% of all households
143 people in nursing homes
45 people in homes for the mentally retarded
Housing units in structures:
- One, detached: 1,830
- One, attached: 70
- Two: 178
- 3 or 4: 257
- 5 to 9: 27
- 10 to 19: 9
- 20 to 49: 43
- 50 or more: 80
- Mobile homes: 144
Median worth of mobile homes: $20,100
Housing units in Sandwich township with a mortgage: 1,064 (127 second mortgage, 208 home equity loan, 0 both second mortgage and home equity loan)
Houses without a mortgage: 526
- Construction (22%)
- Motor vehicle and parts dealers (6%)
- Machinery (5%)
- Metal and metal products (5%)
- Accommodation and food services (5%)
- Truck transportation (4%)
- Building material and garden equipment and supplies dealers (3%)
- Health care (14%)
- Educational services (10%)
- Finance and insurance (8%)
- Accommodation and food services (5%)
- Plastics and rubber products (5%)
- Social assistance (4%)
- Construction (4%)
- Metal workers and plastic workers (7%)
- Driver/sales workers and truck drivers (7%)
- Electrical equipment mechanics and other installation, maintenance, and repair occupations including supervisors (6%)
- Other sales and related workers including supervisors (6%)
- Carpenters (6%)
- Other management occupations except farmers and farm managers (5%)
- Other production occupations including supervisors (5%)
- Other office and administrative support workers including supervisors (7%)
- Secretaries and administrative assistants (7%)
- Registered nurses (6%)
- Retail sales workers except cashiers (5%)
- Other sales and related workers including supervisors (5%)
- Other production occupations including supervisors (4%)
- Assemblers and fabricators (4%)
Most common first ancestries reported in Sandwich township:
- German (30.1%)
- Irish (11.0%)
- Norwegian (10.4%)
- English (7.5%)
- United States or American (5.4%)
- Italian (4.6%)
- Swedish (3.7%)
Most common places of birth for the foreign-born residents:
- Mexico (60%)
- Other Eastern Europe (10%)
- Yugoslavia (8%)
- Canada (6%)
- Germany (3%)
- Hungary (3%)
- Other Northern Europe (3%)
Means of transportation to work:
- Drove a car alone: 2,669 (79%)
- Carpooled: 367 (11%)
- Bus or trolley bus: 16 (0%)
- Railroad: 24 (1%)
- Bicycle: 19 (1%)
- Walked: 91 (3%)
- Other means: 93 (3%)
- Worked at home: 85 (3%)
Most commonly used house heating fuel:
- Utility gas (81%)
- Electricity (15%)
- Bottled, tank, or LP gas (2%)
- Fuel oil, kerosene, etc. (1%)
143 people in nursing homes
45 people in homes for the mentally retarded
91.2% of residents of Sandwich township speak English at home.
6.0% of residents speak Spanish at home (37% speak English very well, 13% speak English well, 35% speak English not well, 15% don't speak English at all).
2.5% of residents speak other Indo-European language at home (54% speak English very well, 27% speak English well, 14% speak English not well, 5% don't speak English at all).
0.1% of residents speak Asian or Pacific Island language at home (100% speak English well).
0.2% of residents speak other language at home (100% speak English very well).
Household type by relationship:
Households: 6,745- In family households: 5,895 (1,402 male householders, 402 female householders)
1,440 spouses, 2,190 children (2,006 natural, 46 adopted, 138 stepchildren), 141 grandchildren, 47 brothers or sisters, 34 parents, 63 other relatives, 176 non-relatives
- In nonfamily households: 850 (309 male householders (243 living alone)), 425 female householders (392 living alone)), 116 nonrelatives
- In group quarters: 188 (146 institutionalized population)
Size of family households: 679 2-persons, 424 3-persons, 418 4-persons, 181 5-persons, 66 6-persons, 36 7-or-more-persons,
Size of nonfamily households: 635 1-person, 89 2-persons, 10 3-persons,
1,385 married couples with children.
358 single-parent households (116 men, 242 women).
Private vs. public school enrollment:
Students in private schools in grades 1 to 8 (elementary and middle school): 19
| Here: | 2.2% |
| Illinois: | 13.4% |
Students in private schools in grades 9 to 12 (high school): 12
| Here: | 2.9% |
| Illinois: | 11.1% |
Students in private undergraduate colleges: 14
| Here: | 6.7% |
| Illinois: | 25.8% |