Work and Jobs in Arlington, Oregon (OR) Detailed Stats
Occupations, Industries, Unemployment, Workers, Commute
Settings
X


Recent posts about work in Arlington, Oregon on our local forum with over 2,400,000 registered users:
 | Once again - Portland in the news for all the wrong reasons (100 replies) |
| Columbia River Gorge: Sun, Wind, Snow Details? (81 replies) |
| Good Salary in PDX? (78 replies) |
| Prescott vs Bend vs Spokane vs Colorado Springs :) (64 replies) |
| Hubby has new job offer...considering moving to Arlington (27 replies) |
| Housing bubble?? (114 replies) |
Latest news about work in Arlington, OR collected exclusively by city-data.com from local newspapers, TV, and radio stations
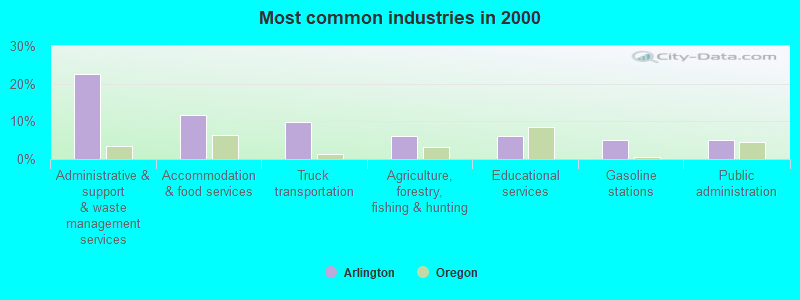
The most common industries in Arlington are: Administrative & support & waste management services (22.5% of civilian employees), Accommodation & food services (11.7% of civilian employees), Truck transportation (9.8% of civilian employees). 83.9% of workers work in Gilliam County. 75.8% of workers are employees of private companies, which is 14.3% greater than the rate of 64.9% across the entire state of Oregon.
Whole page based on the data from 2000 / 2022 when the population of Arlington, Oregon was 524 / 660
Whole page based on the data from 2000 / 2022 when the population of Arlington, Oregon was 524 / 660
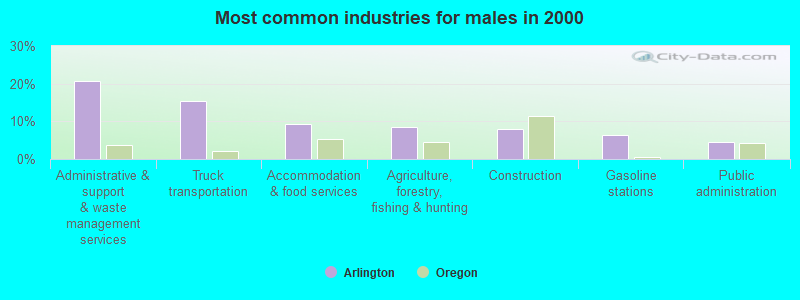
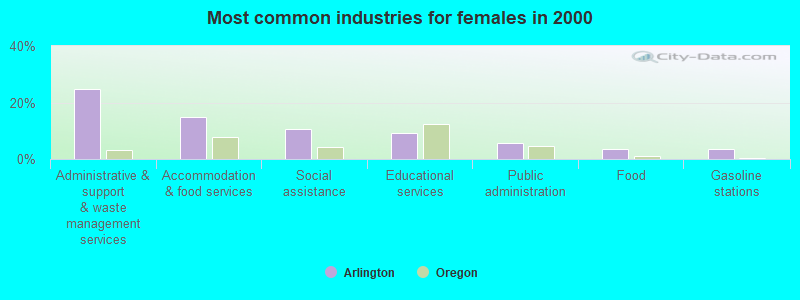
Most common industries
Most common industries | |||
|---|---|---|---|
Industry | All | Males | Females |
| Administrative and support and waste management services | 22.5% (71) | 20.7% (36) | 24.8% (35) |
| Accommodation and food services | 11.7% (37) | 9.2% (16) | 14.9% (21) |
| Truck transportation | 9.8% (31) | 15.5% (27) | 2.8% (4) |
| Agriculture, forestry, fishing and hunting | 6.0% (19) | 8.6% (15) | 2.8% (4) |
| Educational services | 6.0% (19) | 3.4% (6) | 9.2% (13) |
| Gasoline stations | 5.1% (16) | 6.3% (11) | 3.5% (5) |
| Public administration | 5.1% (16) | 4.6% (8) | 5.7% (8) |
| Social assistance | 4.8% (15) | 0.0% (0) | 10.6% (15) |
| Construction | 4.4% (14) | 8.0% (14) | 0.0% (0) |
| Food | 2.9% (9) | 2.3% (4) | 3.5% (5) |
| Professional, scientific, and technical services | 2.2% (7) | 2.3% (4) | 2.1% (3) |
| Personal and laundry services | 1.6% (5) | 0.0% (0) | 3.5% (5) |
| Repair and maintenance | 1.3% (4) | 2.3% (4) | 0.0% (0) |
| Religious, grantmaking, civic, professional, and similar organizations | 1.3% (4) | 1.1% (2) | 1.4% (2) |
| Department and other general merchandise stores | 1.3% (4) | 1.1% (2) | 1.4% (2) |
| U. S. Postal service | 1.3% (4) | 1.7% (3) | 0.7% (1) |
| Building material and garden equipment and supplies dealers | 1.3% (4) | 1.1% (2) | 1.4% (2) |
| Apparel | 1.0% (3) | 1.7% (3) | 0.0% (0) |
| Food and beverage stores | 1.0% (3) | 0.0% (0) | 2.1% (3) |
| Other transportation, and support activities, and couriers | 1.0% (3) | 1.7% (3) | 0.0% (0) |
| Broadcasting and telecommunications | 1.0% (3) | 1.7% (3) | 0.0% (0) |
| Private households | 1.0% (3) | 1.7% (3) | 0.0% (0) |
| Miscellaneous manufacturing | 0.6% (2) | 0.0% (0) | 1.4% (2) |
| Wood products | 0.6% (2) | 1.1% (2) | 0.0% (0) |
| Retail florists | 0.6% (2) | 0.0% (0) | 1.4% (2) |
| Rail transportation | 0.6% (2) | 1.1% (2) | 0.0% (0) |
| Warehousing and storage | 0.6% (2) | 0.0% (0) | 1.4% (2) |
| Data processing, libraries, and other information services | 0.6% (2) | 0.0% (0) | 1.4% (2) |
| Health care | 0.6% (2) | 0.0% (0) | 1.4% (2) |
| Arts, entertainment, and recreation | 0.6% (2) | 1.1% (2) | 0.0% (0) |
| Petroleum and petroleum products merchant wholesalers | 0.6% (2) | 0.0% (0) | 1.4% (2) |
| Farm product raw materials merchant wholesalers | 0.6% (2) | 1.1% (2) | 0.0% (0) |
| Finance and insurance | 0.3% (1) | 0.0% (0) | 0.7% (1) |
Unemployment in Arlington
- Unemployment by race in 2022
- Unemployment rate for White non-Hispanic residents
- 4.0%Males
- 5.0%Females
- Unemployment rate for Asian residents
- 100.0%Females
- Unemployment by race in 2000
- Unemployment rate for White non-Hispanic residents
- 3.7%Males
- 1.4%Females
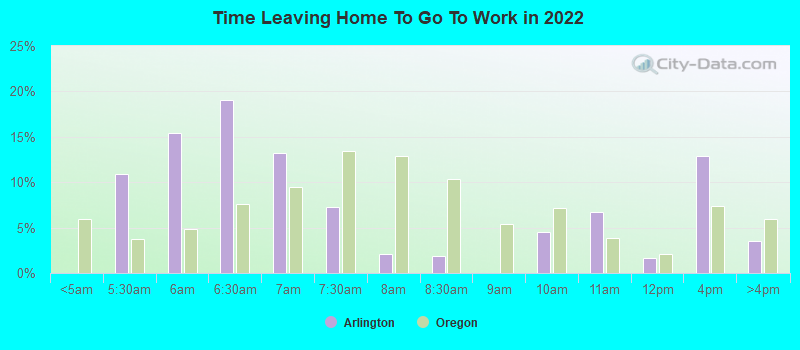
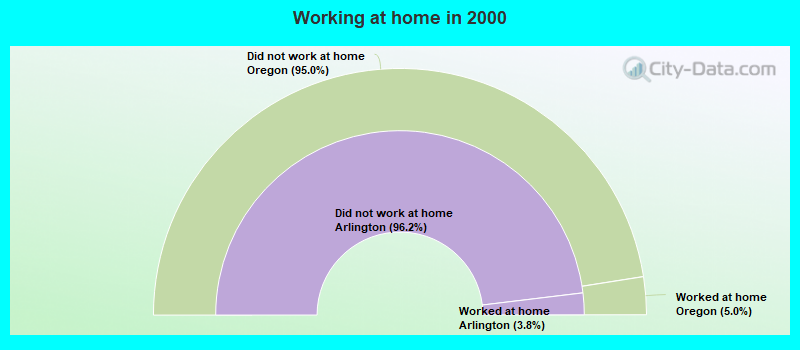
Time leaving home to go to work
5:00 a.m. to 5:29 a.m.:
| Arlington: | 10.9% (30) |
| Oregon: | 3.7% (61,686) |
5:30 a.m. to 5:59 a.m.:
| Arlington: | 15.4% (42) |
| Oregon: | 4.9% (81,016) |
6:00 a.m. to 6:29 a.m.:
| Arlington: | 19.1% (52) |
| Oregon: | 7.6% (125,831) |
6:30 a.m. to 6:59 a.m.:
| Arlington: | 13.2% (36) |
| Oregon: | 9.4% (157,114) |
7:00 a.m. to 7:29 a.m.:
| Arlington: | 7.2% (20) |
| Oregon: | 13.4% (222,929) |
7:30 a.m. to 7:59 a.m.:
| Arlington: | 2.1% (6) |
| Oregon: | 12.9% (215,364) |
8:00 a.m. to 8:29 a.m.:
| Arlington: | 1.8% (5) |
| Oregon: | 10.4% (172,765) |
9:00 a.m. to 9:59 a.m.:
| Arlington: | 4.5% (12) |
| Oregon: | 7.2% (120,009) |
10:00 a.m. to 10:59 a.m.:
| Arlington: | 6.7% (18) |
| Oregon: | 3.8% (63,360) |
11:00 a.m. to 11:59 a.m.:
| Arlington: | 1.7% (5) |
| Oregon: | 2.1% (34,334) |
12:00 p.m. to 3:59 p.m.:
| Arlington: | 12.8% (35) |
| Oregon: | 7.4% (123,119) |
4:00 p.m. to 11:59 p.m.:
| Arlington: | 3.5% (10) |
| Oregon: | 6.0% (99,745) |
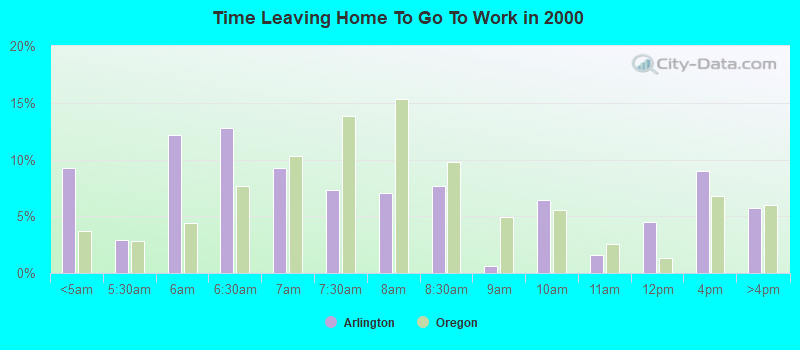
<5am:
| Arlington: | 9.3% (29) |
| Oregon: | 3.7% (58,821) |
5:30am:
| Arlington: | 2.9% (9) |
| Oregon: | 2.8% (44,872) |
6am:
| Arlington: | 12.1% (38) |
| Oregon: | 4.4% (71,163) |
6:30am:
| Arlington: | 12.8% (40) |
| Oregon: | 7.7% (122,707) |
7am:
| Arlington: | 9.3% (29) |
| Oregon: | 10.3% (165,185) |
7:30am:
| Arlington: | 7.3% (23) |
| Oregon: | 13.9% (222,209) |
8am:
| Arlington: | 7.0% (22) |
| Oregon: | 15.3% (245,415) |
8:30am:
| Arlington: | 7.7% (24) |
| Oregon: | 9.8% (156,781) |
9am:
| Arlington: | 0.6% (2) |
| Oregon: | 4.9% (78,436) |
10am:
| Arlington: | 6.4% (20) |
| Oregon: | 5.5% (88,783) |
11am:
| Arlington: | 1.6% (5) |
| Oregon: | 2.6% (41,539) |
12pm:
| Arlington: | 4.5% (14) |
| Oregon: | 1.3% (20,765) |
4pm:
| Arlington: | 8.9% (28) |
| Oregon: | 6.8% (108,927) |
>4pm:
| Arlington: | 5.8% (18) |
| Oregon: | 6.0% (95,989) |
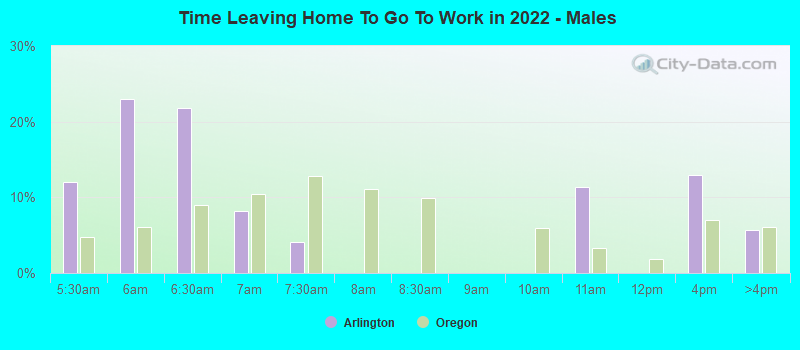
5:00 a.m. to 5:29 a.m. - Males:
| Arlington: | 12.1% (20) |
| Oregon: | 4.8% (42,985) |
5:30 a.m. to 5:59 a.m. - Males:
| Arlington: | 22.9% (38) |
| Oregon: | 6.1% (54,375) |
6:00 a.m. to 6:29 a.m. - Males:
| Arlington: | 21.9% (36) |
| Oregon: | 9.0% (80,638) |
6:30 a.m. to 6:59 a.m. - Males:
| Arlington: | 8.2% (14) |
| Oregon: | 10.4% (93,611) |
7:00 a.m. to 7:29 a.m. - Males:
| Arlington: | 4.1% (7) |
| Oregon: | 12.8% (114,794) |
10:00 a.m. to 10:59 a.m. - Males:
| Arlington: | 11.4% (19) |
| Oregon: | 3.3% (29,707) |
12:00 p.m. to 3:59 p.m. - Males:
| Arlington: | 12.9% (21) |
| Oregon: | 7.0% (62,443) |
4:00 p.m. to 11:59 p.m. - Males:
| Arlington: | 5.7% (9) |
| Oregon: | 6.0% (54,001) |
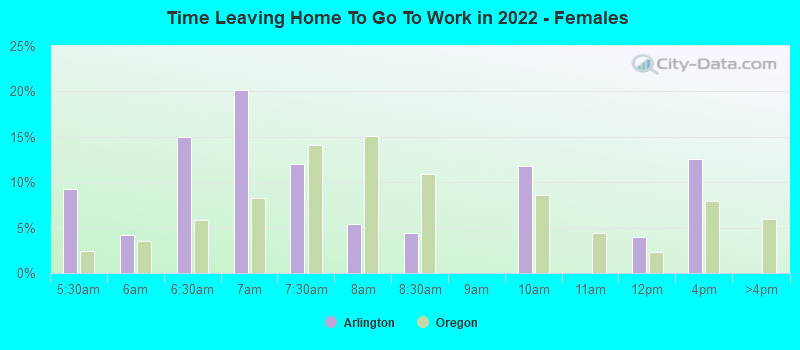
5:00 a.m. to 5:29 a.m. - Females:
| Arlington: | 9.3% (10) |
| Oregon: | 2.4% (18,701) |
5:30 a.m. to 5:59 a.m. - Females:
| Arlington: | 4.1% (4) |
| Oregon: | 3.5% (26,641) |
6:00 a.m. to 6:29 a.m. - Females:
| Arlington: | 14.9% (16) |
| Oregon: | 5.9% (45,193) |
6:30 a.m. to 6:59 a.m. - Females:
| Arlington: | 20.1% (22) |
| Oregon: | 8.3% (63,503) |
7:00 a.m. to 7:29 a.m. - Females:
| Arlington: | 12.1% (13) |
| Oregon: | 14.1% (108,135) |
7:30 a.m. to 7:59 a.m. - Females:
| Arlington: | 5.4% (6) |
| Oregon: | 15.0% (115,532) |
8:00 a.m. to 8:29 a.m. - Females:
| Arlington: | 4.4% (5) |
| Oregon: | 10.9% (83,414) |
9:00 a.m. to 9:59 a.m. - Females:
| Arlington: | 11.8% (13) |
| Oregon: | 8.6% (66,218) |
11:00 a.m. to 11:59 a.m. - Females:
| Arlington: | 3.9% (4) |
| Oregon: | 2.3% (17,550) |
12:00 p.m. to 3:59 p.m. - Females:
| Arlington: | 12.5% (13) |
| Oregon: | 7.9% (60,676) |
Travel time to work
Percentage of workers working in this county: 83.9%
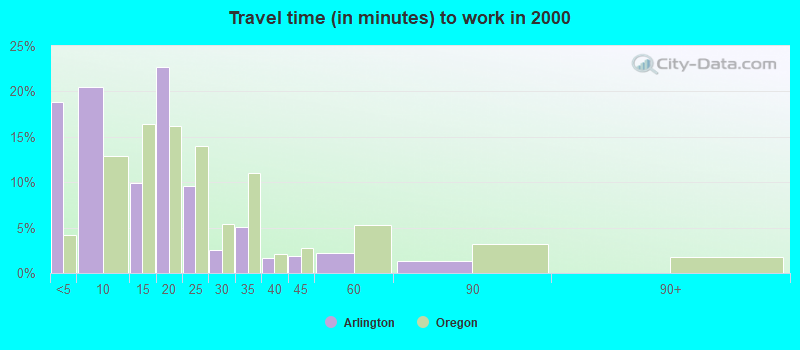
Less than 5 minutes:
| Arlington: | 18.8% (59) |
| Oregon: | 4.1% (66,369) |
5 to 9 minutes:
| Arlington: | 20.4% (64) |
| Oregon: | 12.9% (206,168) |
10 to 14 minutes:
| Arlington: | 9.9% (31) |
| Oregon: | 16.5% (263,466) |
15 to 19 minutes:
| Arlington: | 22.7% (71) |
| Oregon: | 16.1% (258,476) |
20 to 24 minutes:
| Arlington: | 9.6% (30) |
| Oregon: | 13.9% (223,370) |
25 to 29 minutes:
| Arlington: | 2.6% (8) |
| Oregon: | 5.4% (87,147) |
30 to 34 minutes:
| Arlington: | 5.1% (16) |
| Oregon: | 11.0% (176,763) |
35 to 39 minutes:
| Arlington: | 1.6% (5) |
| Oregon: | 2.0% (32,680) |
40 to 44 minutes:
| Arlington: | 1.9% (6) |
| Oregon: | 2.7% (43,262) |
45 to 59 minutes:
| Arlington: | 2.2% (7) |
| Oregon: | 5.2% (83,858) |
60 to 89 minutes:
| Arlington: | 1.3% (4) |
| Oregon: | 3.2% (51,318) |
Means of transportation to work
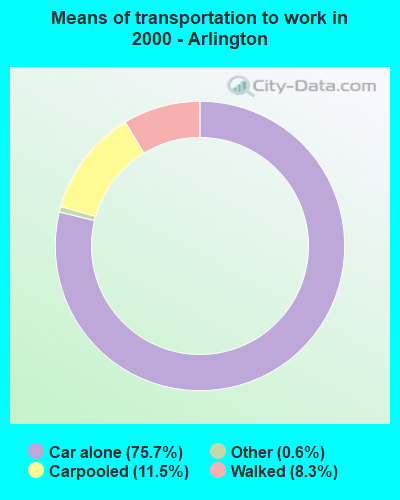

Drove car alone:
| Arlington: | 75.7% (237) |
| Oregon: | 73.2% (1,171,641) |
Carpooled:
| Arlington: | 11.5% (36) |
| Oregon: | 12.2% (195,950) |
Walked:
| Arlington: | 8.3% (26) |
| Oregon: | 3.6% (57,217) |
Other means:
| Arlington: | 0.6% (2) |
| Oregon: | 0.7% (10,882) |
Private vehicle occupancy
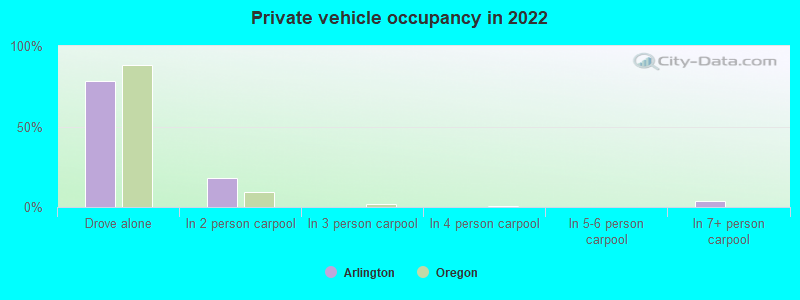
Drove alone:
| Arlington: | 78.5% (197) |
| Oregon: | 88.2% (1,317,823) |
In 2 person carpool:
| Arlington: | 18.0% (45) |
| Oregon: | 9.0% (134,621) |
In 7+ person carpool:
| Arlington: | 3.6% (9) |
| Oregon: | 0.2% (3,122) |
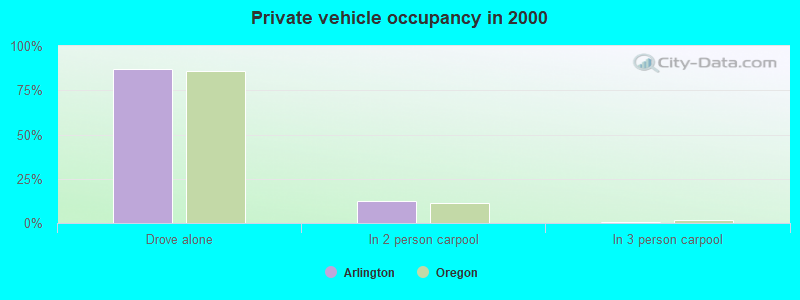
Drove alone:
| Arlington: | 86.8% (237) |
| Oregon: | 85.7% (1,171,641) |
In 2 person carpool:
| Arlington: | 12.5% (34) |
| Oregon: | 11.5% (156,754) |
In 3 person carpool:
| Arlington: | 0.7% (2) |
| Oregon: | 1.9% (25,457) |
Class of workers
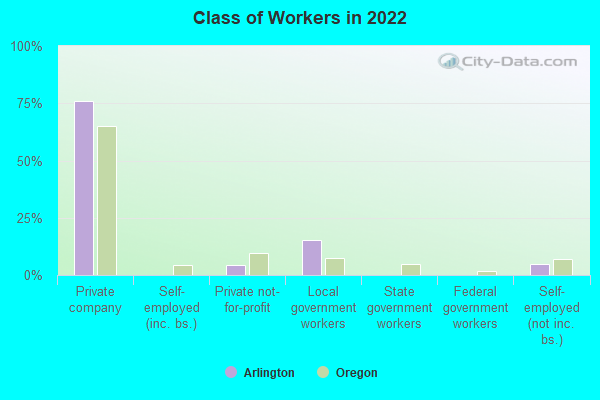
Employee of private company:
| Arlington: | 75.8% (224) |
| Oregon: | 64.9% (1,360,643) |
Private not-for-profit wage and salary workers:
| Arlington: | 4.2% (12) |
| Oregon: | 9.6% (201,342) |
Local government workers:
| Arlington: | 15.2% (45) |
| Oregon: | 7.2% (151,100) |
Self-employed workers in own not incorporated business:
| Arlington: | 4.8% (14) |
| Oregon: | 6.9% (145,422) |
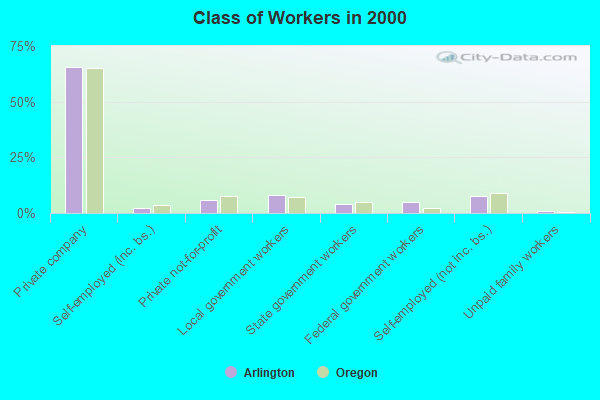
Employee of private company:
| Arlington: | 65.7% (207) |
| Oregon: | 65.1% (1,059,139) |
Self-employed in own incorporated business:
| Arlington: | 2.2% (7) |
| Oregon: | 3.8% (61,386) |
Private not-for-profit wage and salary workers:
| Arlington: | 6.0% (19) |
| Oregon: | 7.4% (120,839) |
Local government workers:
| Arlington: | 8.3% (26) |
| Oregon: | 7.2% (116,733) |
State government workers:
| Arlington: | 4.1% (13) |
| Oregon: | 5.0% (81,804) |
Federal government workers:
| Arlington: | 5.1% (16) |
| Oregon: | 2.2% (36,076) |
Self-employed workers in own not incorporated business:
| Arlington: | 7.6% (24) |
| Oregon: | 8.9% (145,020) |
Unpaid family workers:
| Arlington: | 1.0% (3) |
| Oregon: | 0.4% (6,772) |
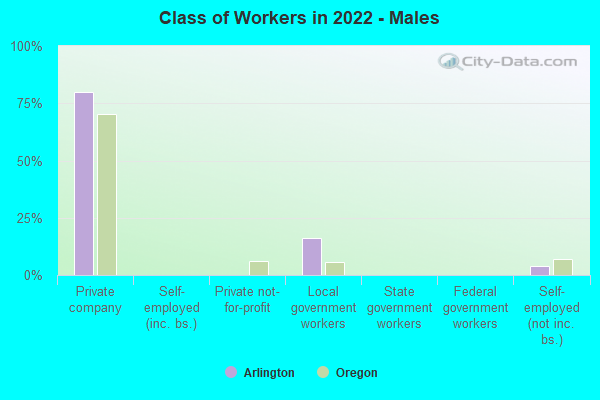
Employee of private company - Males:
| Arlington: | 79.9% (138) |
| Oregon: | 70.1% (771,769) |
Local government workers - Males:
| Arlington: | 16.0% (28) |
| Oregon: | 5.5% (60,350) |
Self-employed workers in own not incorporated business - Males:
| Arlington: | 4.1% (7) |
| Oregon: | 6.9% (76,355) |
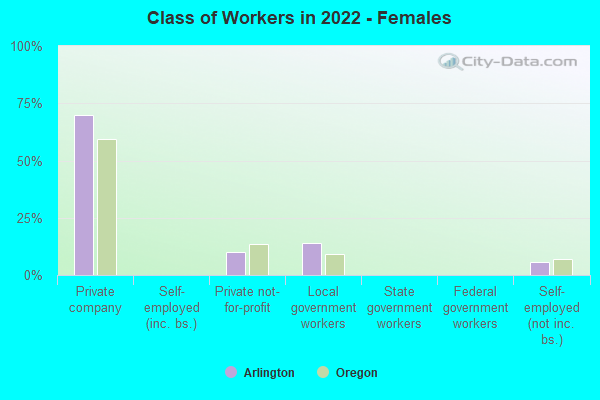
Employee of private company - Females:
| Arlington: | 70.0% (86) |
| Oregon: | 59.2% (588,874) |
Private not-for-profit wage and salary workers - Females:
| Arlington: | 10.0% (12) |
| Oregon: | 13.4% (133,183) |
Local government workers - Females:
| Arlington: | 14.2% (17) |
| Oregon: | 9.1% (90,750) |
Self-employed workers in own not incorporated business - Females:
| Arlington: | 5.8% (7) |
| Oregon: | 6.9% (69,067) |