Latest news about work in Bristol, NH collected exclusively by city-data.com from local newspapers, TV, and radio stations
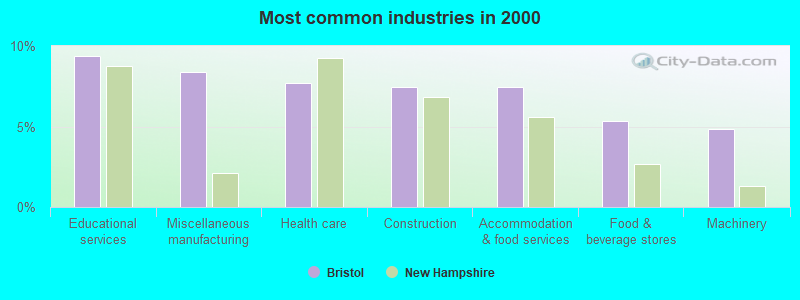
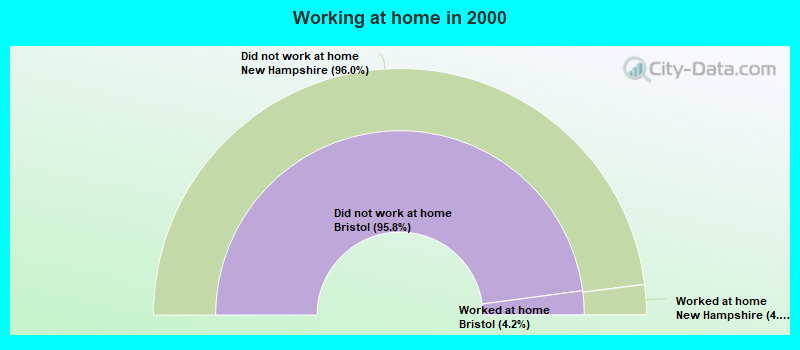
The most common industries in Bristol are: Educational services (9.4% of civilian employees), Miscellaneous manufacturing (8.4% of civilian employees), Health care (7.7% of civilian employees). 52.9% of workers work in Grafton County and 7.8% of all workers work at home. 57.3% of workers are employees of private companies, which is 14.5% less than the rate of 65.6% across the entire state of New Hampshire.
Whole page based on the data from 2000 / 2022 when the population of Bristol, New Hampshire was 1,670 / 2,102
Most common industries
Most common industries
Industry
All
Males
Females
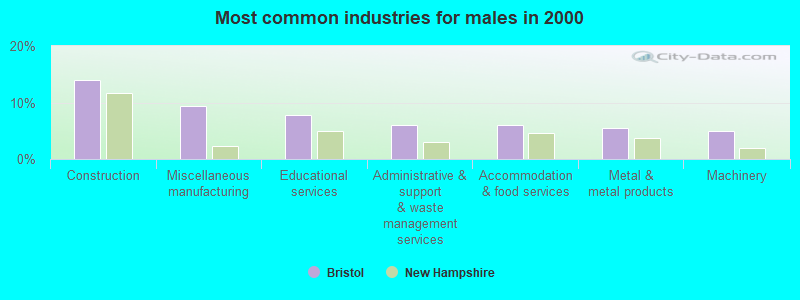
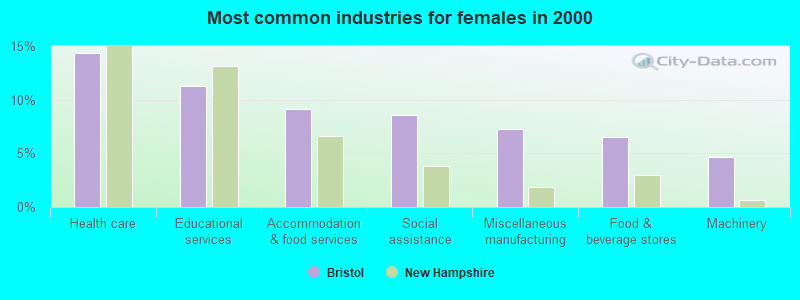
Educational services
9.4% (77)
7.8% (34)
11.2% (43)
Miscellaneous manufacturing
8.4% (69)
9.4% (41)
7.3% (28)
Health care
7.7% (63)
1.8% (8)
14.4% (55)
Construction
7.4% (61)
13.9% (61)
0.0% (0)
Accommodation and food services
7.4% (61)
5.9% (26)
9.1% (35)
Food and beverage stores
5.4% (44)
4.3% (19)
6.5% (25)
Machinery
4.9% (40)
5.0% (22)
4.7% (18)
Social assistance
4.0% (33)
0.0% (0)
8.6% (33)
Metal and metal products
3.8% (31)
5.5% (24)
1.8% (7)
Administrative and support and waste management services
3.2% (26)
5.9% (26)
0.0% (0)
Public administration
2.9% (24)
1.4% (6)
4.7% (18)
Transportation equipment
2.4% (20)
3.4% (15)
1.3% (5)
Wood products
2.2% (18)
4.1% (18)
0.0% (0)
Computer and electronic products
2.1% (17)
1.8% (8)
2.3% (9)
Religious, grantmaking, civic, professional, and similar organizations
2.1% (17)
0.0% (0)
4.4% (17)
U. S. Postal service
1.8% (15)
2.1% (9)
1.6% (6)
Professional, scientific, and technical services
1.8% (15)
1.6% (7)
2.1% (8)
Petroleum and petroleum products merchant wholesalers
1.7% (14)
2.1% (9)
1.3% (5)
Truck transportation
1.6% (13)
3.0% (13)
0.0% (0)
Utilities
1.5% (12)
1.1% (5)
1.8% (7)
Repair and maintenance
1.5% (12)
2.7% (12)
0.0% (0)
Electronic shopping and mail-order houses
1.1% (9)
0.9% (4)
1.3% (5)
Real estate and rental and leasing
1.1% (9)
1.1% (5)
1.0% (4)
Data processing, libraries, and other information services
1.0% (8)
0.0% (0)
2.1% (8)
Clothing and accessories, including shoe, stores
1.0% (8)
0.9% (4)
1.0% (4)
Finance and insurance
1.0% (8)
0.0% (0)
2.1% (8)
Other direct selling establishments
0.9% (7)
1.6% (7)
0.0% (0)
Private households
0.9% (7)
0.0% (0)
1.8% (7)
Electrical equipment, appliances, and components
0.9% (7)
0.7% (3)
1.0% (4)
Leather and allied products
0.7% (6)
0.0% (0)
1.6% (6)
Office supplies and stationery stores
0.7% (6)
0.0% (0)
1.6% (6)
Sporting goods, camera, and hobby and toy stores
0.7% (6)
1.4% (6)
0.0% (0)
Motor vehicles, parts and supplies merchant wholesalers
0.6% (5)
1.1% (5)
0.0% (0)
Printing and related support activities
0.6% (5)
1.1% (5)
0.0% (0)
Publishing, and motion picture and sound recording industries
0.6% (5)
1.1% (5)
0.0% (0)
Management of companies and enterprises
0.6% (5)
0.0% (0)
1.3% (5)
Electrical and electronic goods merchant wholesalers
0.6% (5)
1.1% (5)
0.0% (0)
Building material and garden equipment and supplies dealers
0.6% (5)
1.1% (5)
0.0% (0)
Department and other general merchandise stores
0.6% (5)
1.1% (5)
0.0% (0)
Chemicals
0.5% (4)
0.9% (4)
0.0% (0)
Air transportation
0.5% (4)
0.9% (4)
0.0% (0)
Textile mills and textile products
0.5% (4)
0.9% (4)
0.0% (0)
Personal and laundry services
0.5% (4)
0.0% (0)
1.0% (4)
Nonmetallic mineral products
0.5% (4)
0.9% (4)
0.0% (0)
Food
0.4% (3)
0.0% (0)
0.8% (3)
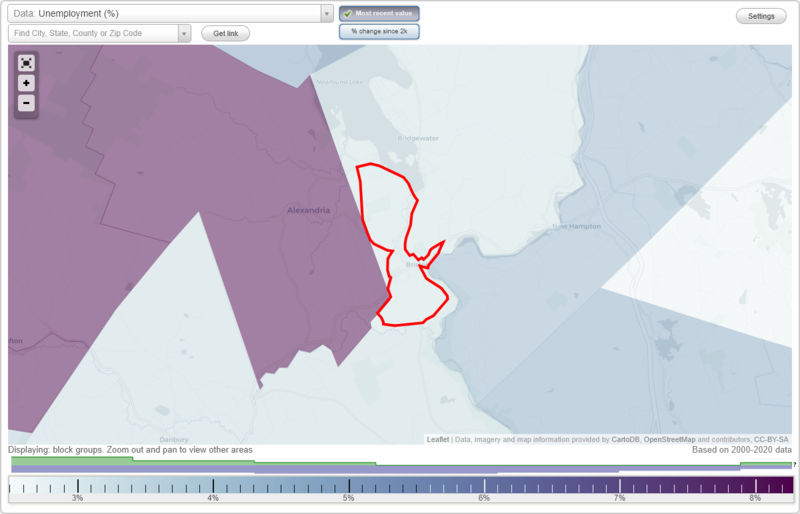
Unemployment in Bristol
Unemployment by race in 2022
Unemployment rate for White non-Hispanic residents
6.9%Males
Unemployment by race in 2000
Unemployment rate for White non-Hispanic residents
7.1%Males
5.1%Females
Unemployment rate for two or more race residents
50.0%Males
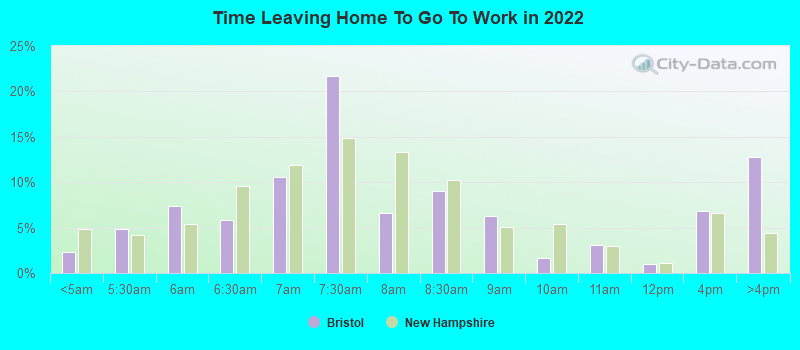
Time leaving home to go to work
12:00 a.m. to 4:59 a.m.:
Bristol:
2.3% (20)
New Hampshire:
4.8% (29,319)
5:00 a.m. to 5:29 a.m.:
Bristol:
4.9% (44)
New Hampshire:
4.2% (25,760)
5:30 a.m. to 5:59 a.m.:
Bristol:
7.4% (66)
New Hampshire:
5.4% (32,953)
6:00 a.m. to 6:29 a.m.:
Bristol:
5.8% (52)
New Hampshire:
9.6% (58,565)
6:30 a.m. to 6:59 a.m.:
Bristol:
10.6% (95)
New Hampshire:
11.9% (72,750)
7:00 a.m. to 7:29 a.m.:
Bristol:
21.7% (194)
New Hampshire:
14.9% (90,825)
7:30 a.m. to 7:59 a.m.:
Bristol:
6.6% (59)
New Hampshire:
13.3% (81,397)
8:00 a.m. to 8:29 a.m.:
Bristol:
9.0% (81)
New Hampshire:
10.2% (62,474)
8:30 a.m. to 8:59 a.m.:
Bristol:
6.3% (56)
New Hampshire:
5.0% (30,803)
9:00 a.m. to 9:59 a.m.:
Bristol:
1.6% (14)
New Hampshire:
5.4% (33,201)
10:00 a.m. to 10:59 a.m.:
Bristol:
3.1% (28)
New Hampshire:
2.9% (17,949)
11:00 a.m. to 11:59 a.m.:
Bristol:
1.0% (9)
New Hampshire:
1.1% (6,747)
12:00 p.m. to 3:59 p.m.:
Bristol:
6.8% (61)
New Hampshire:
6.6% (40,528)
4:00 p.m. to 11:59 p.m.:
Bristol:
12.8% (115)
New Hampshire:
4.4% (27,065)
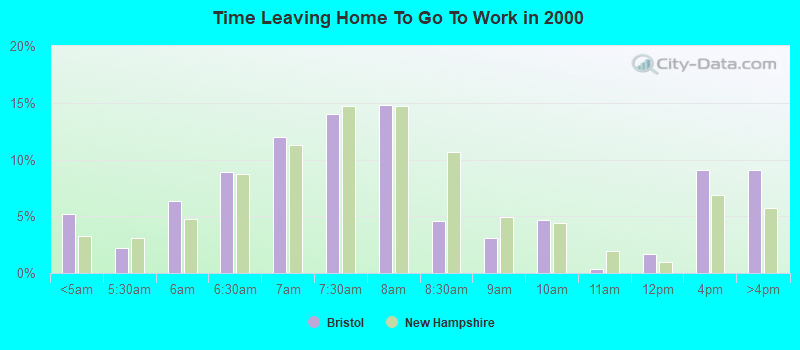
<5am:
Bristol:
5.2% (41)
New Hampshire:
3.3% (20,948)
5:30am:
Bristol:
2.2% (17)
New Hampshire:
3.1% (19,529)
6am:
Bristol:
6.4% (50)
New Hampshire:
4.8% (30,560)
6:30am:
Bristol:
8.9% (70)
New Hampshire:
8.7% (55,574)
7am:
Bristol:
12.0% (94)
New Hampshire:
11.3% (72,142)
7:30am:
Bristol:
14.0% (110)
New Hampshire:
14.7% (93,945)
8am:
Bristol:
14.8% (116)
New Hampshire:
14.7% (93,766)
8:30am:
Bristol:
4.6% (36)
New Hampshire:
10.7% (68,355)
9am:
Bristol:
3.1% (24)
New Hampshire:
4.9% (31,547)
10am:
Bristol:
4.7% (37)
New Hampshire:
4.4% (28,251)
11am:
Bristol:
0.4% (3)
New Hampshire:
1.9% (12,237)
12pm:
Bristol:
1.7% (13)
New Hampshire:
0.9% (5,974)
4pm:
Bristol:
9.0% (71)
New Hampshire:
6.8% (43,620)
>4pm:
Bristol:
9.0% (71)
New Hampshire:
5.8% (36,810)
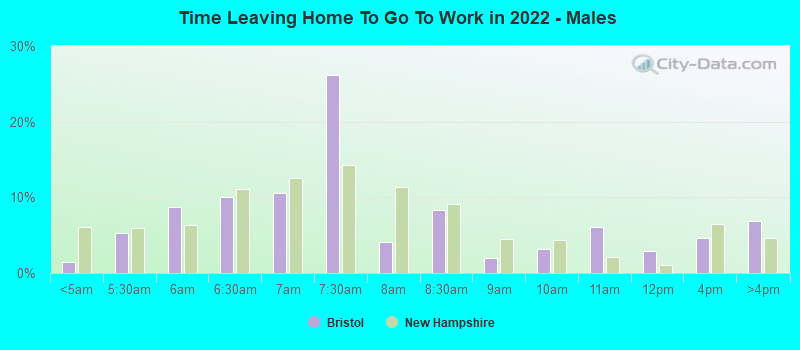
12:00 a.m. to 4:59 a.m. - Males:
Bristol:
1.4% (6)
New Hampshire:
6.1% (19,706)
5:00 a.m. to 5:29 a.m. - Males:
Bristol:
5.3% (24)
New Hampshire:
5.9% (19,141)
5:30 a.m. to 5:59 a.m. - Males:
Bristol:
8.7% (39)
New Hampshire:
6.4% (20,537)
6:00 a.m. to 6:29 a.m. - Males:
Bristol:
10.0% (45)
New Hampshire:
11.1% (35,908)
6:30 a.m. to 6:59 a.m. - Males:
Bristol:
10.6% (48)
New Hampshire:
12.6% (40,521)
7:00 a.m. to 7:29 a.m. - Males:
Bristol:
26.2% (118)
New Hampshire:
14.3% (46,086)
7:30 a.m. to 7:59 a.m. - Males:
Bristol:
4.0% (18)
New Hampshire:
11.3% (36,510)
8:00 a.m. to 8:29 a.m. - Males:
Bristol:
8.3% (37)
New Hampshire:
9.2% (29,527)
8:30 a.m. to 8:59 a.m. - Males:
Bristol:
2.0% (9)
New Hampshire:
4.5% (14,607)
9:00 a.m. to 9:59 a.m. - Males:
Bristol:
3.1% (14)
New Hampshire:
4.3% (13,997)
10:00 a.m. to 10:59 a.m. - Males:
Bristol:
6.1% (27)
New Hampshire:
2.1% (6,725)
11:00 a.m. to 11:59 a.m. - Males:
Bristol:
3.0% (13)
New Hampshire:
1.1% (3,403)
12:00 p.m. to 3:59 p.m. - Males:
Bristol:
4.6% (21)
New Hampshire:
6.4% (20,714)
4:00 p.m. to 11:59 p.m. - Males:
Bristol:
6.8% (31)
New Hampshire:
4.6% (14,680)
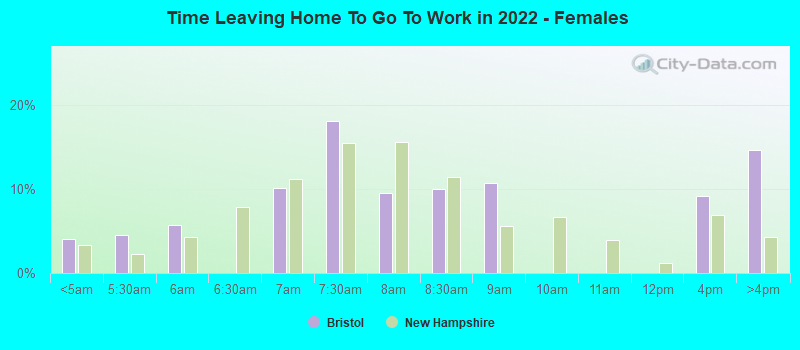
12:00 a.m. to 4:59 a.m. - Females:
Bristol:
4.1% (18)
New Hampshire:
3.3% (9,613)
5:00 a.m. to 5:29 a.m. - Females:
Bristol:
4.5% (20)
New Hampshire:
2.3% (6,619)
5:30 a.m. to 5:59 a.m. - Females:
Bristol:
5.7% (25)
New Hampshire:
4.3% (12,416)
6:30 a.m. to 6:59 a.m. - Females:
Bristol:
10.1% (45)
New Hampshire:
11.2% (32,229)
7:00 a.m. to 7:29 a.m. - Females:
Bristol:
18.0% (80)
New Hampshire:
15.5% (44,739)
7:30 a.m. to 7:59 a.m. - Females:
Bristol:
9.5% (42)
New Hampshire:
15.6% (44,887)
8:00 a.m. to 8:29 a.m. - Females:
Bristol:
10.0% (44)
New Hampshire:
11.4% (32,947)
8:30 a.m. to 8:59 a.m. - Females:
Bristol:
10.7% (47)
New Hampshire:
5.6% (16,196)
12:00 p.m. to 3:59 p.m. - Females:
Bristol:
9.2% (41)
New Hampshire:
6.9% (19,814)
4:00 p.m. to 11:59 p.m. - Females:
Bristol:
14.6% (65)
New Hampshire:
4.3% (12,385)
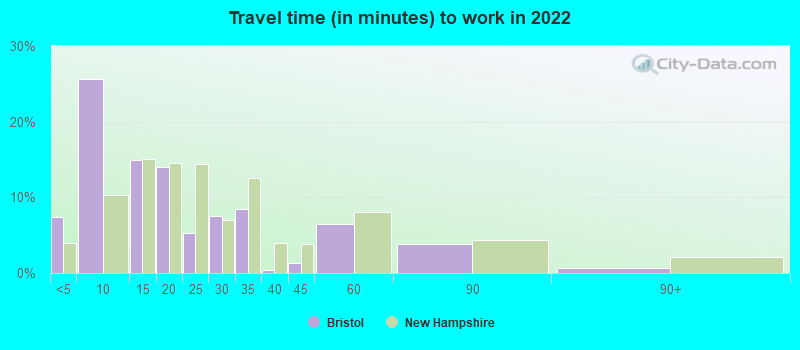
Travel time to work
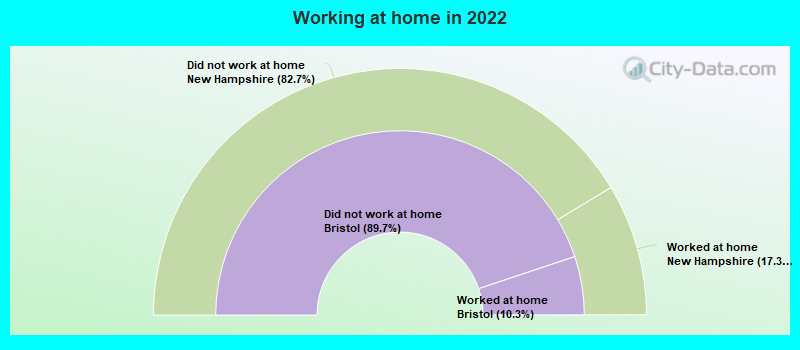
Percentage of workers working in this county: 52.9% Number of people working at home: 81 (7.8% of all workers)
Less than 5 minutes:
Bristol:
7.5% (106)
New Hampshire:
3.9% (23,094)
5 to 9 minutes:
Bristol:
25.6% (363)
New Hampshire:
10.3% (60,708)
10 to 14 minutes:
Bristol:
14.9% (211)
New Hampshire:
15.1% (88,593)
15 to 19 minutes:
Bristol:
14.0% (198)
New Hampshire:
14.5% (85,050)
20 to 24 minutes:
Bristol:
5.3% (74)
New Hampshire:
14.4% (84,732)
25 to 29 minutes:
Bristol:
7.5% (107)
New Hampshire:
7.0% (41,308)
30 to 34 minutes:
Bristol:
8.4% (119)
New Hampshire:
12.5% (73,397)
35 to 39 minutes:
Bristol:
0.4% (5)
New Hampshire:
3.9% (22,895)
40 to 44 minutes:
Bristol:
1.4% (19)
New Hampshire:
3.9% (22,795)
45 to 59 minutes:
Bristol:
6.5% (93)
New Hampshire:
8.0% (46,971)
60 to 89 minutes:
Bristol:
3.8% (54)
New Hampshire:
4.4% (25,610)
90 or more minutes:
Bristol:
0.7% (10)
New Hampshire:
2.1% (12,294)
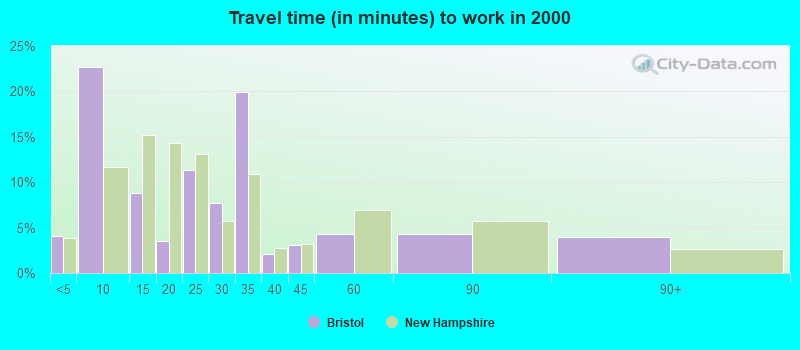
Less than 5 minutes:
Bristol:
4.1% (32)
New Hampshire:
3.9% (24,932)
5 to 9 minutes:
Bristol:
22.6% (178)
New Hampshire:
11.7% (74,466)
10 to 14 minutes:
Bristol:
8.8% (69)
New Hampshire:
15.2% (97,185)
15 to 19 minutes:
Bristol:
3.6% (28)
New Hampshire:
14.3% (91,417)
20 to 24 minutes:
Bristol:
11.3% (89)
New Hampshire:
13.1% (83,562)
25 to 29 minutes:
Bristol:
7.8% (61)
New Hampshire:
5.7% (36,290)
30 to 34 minutes:
Bristol:
20.0% (157)
New Hampshire:
10.9% (69,722)
35 to 39 minutes:
Bristol:
2.0% (16)
New Hampshire:
2.7% (17,218)
40 to 44 minutes:
Bristol:
3.1% (24)
New Hampshire:
3.2% (20,648)
45 to 59 minutes:
Bristol:
4.3% (34)
New Hampshire:
6.9% (44,234)
60 to 89 minutes:
Bristol:
4.3% (34)
New Hampshire:
5.7% (36,458)
90 or more minutes:
Bristol:
3.9% (31)
New Hampshire:
2.7% (17,126)
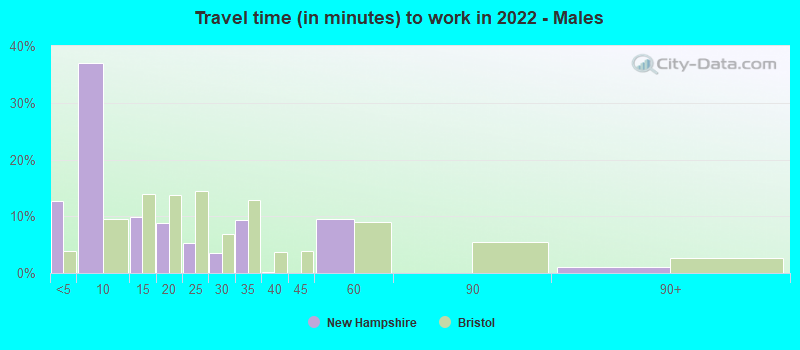
Less than 5 minutes - Males:
Bristol:
12.7% (106)
New Hampshire:
3.9% (11,849)
5 to 9 minutes - Males:
Bristol:
37.0% (307)
New Hampshire:
9.6% (29,124)
10 to 14 minutes - Males:
Bristol:
9.9% (82)
New Hampshire:
13.8% (42,141)
15 to 19 minutes - Males:
Bristol:
8.9% (74)
New Hampshire:
13.7% (41,848)
20 to 24 minutes - Males:
Bristol:
5.3% (44)
New Hampshire:
14.5% (44,251)
25 to 29 minutes - Males:
Bristol:
3.5% (29)
New Hampshire:
6.9% (20,932)
30 to 34 minutes - Males:
Bristol:
9.4% (78)
New Hampshire:
12.9% (39,260)
35 to 39 minutes - Males:
Bristol:
0.3% (2)
New Hampshire:
3.6% (11,087)
45 to 59 minutes - Males:
Bristol:
9.4% (79)
New Hampshire:
9.0% (27,389)
90 or more minutes - Males:
Bristol:
1.0% (9)
New Hampshire:
2.6% (7,977)
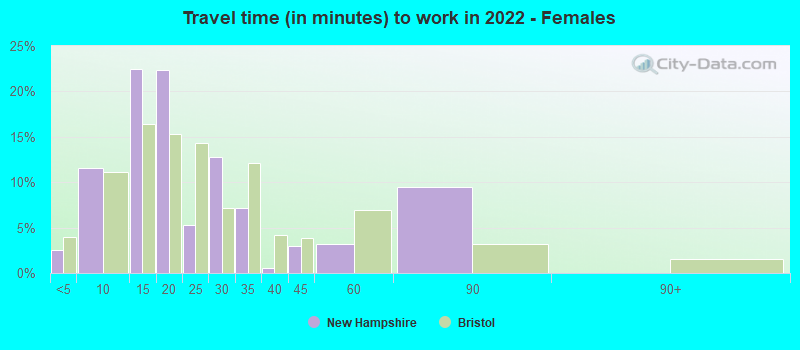
Less than 5 minutes - Females:
Bristol:
2.5% (15)
New Hampshire:
4.0% (11,245)
5 to 9 minutes - Females:
Bristol:
11.6% (67)
New Hampshire:
11.2% (31,584)
10 to 14 minutes - Females:
Bristol:
22.5% (130)
New Hampshire:
16.4% (46,452)
15 to 19 minutes - Females:
Bristol:
22.3% (129)
New Hampshire:
15.3% (43,202)
20 to 24 minutes - Females:
Bristol:
5.3% (31)
New Hampshire:
14.3% (40,481)
25 to 29 minutes - Females:
Bristol:
12.8% (74)
New Hampshire:
7.2% (20,376)
30 to 34 minutes - Females:
Bristol:
7.2% (42)
New Hampshire:
12.1% (34,137)
35 to 39 minutes - Females:
Bristol:
0.6% (3)
New Hampshire:
4.2% (11,808)
40 to 44 minutes - Females:
Bristol:
3.0% (17)
New Hampshire:
3.8% (10,745)
45 to 59 minutes - Females:
Bristol:
3.2% (19)
New Hampshire:
6.9% (19,582)
60 to 89 minutes - Females:
Bristol:
9.4% (55)
New Hampshire:
3.2% (8,935)
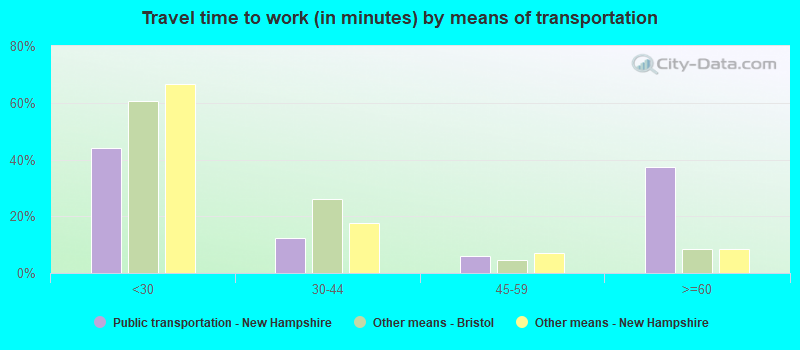
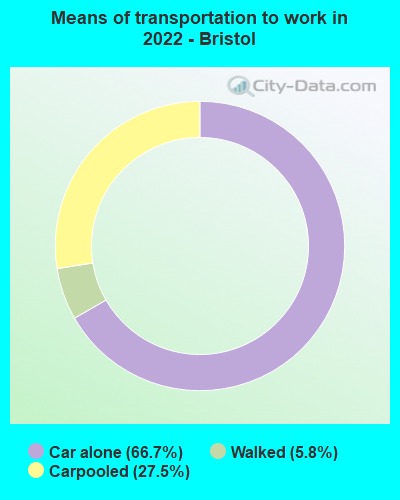
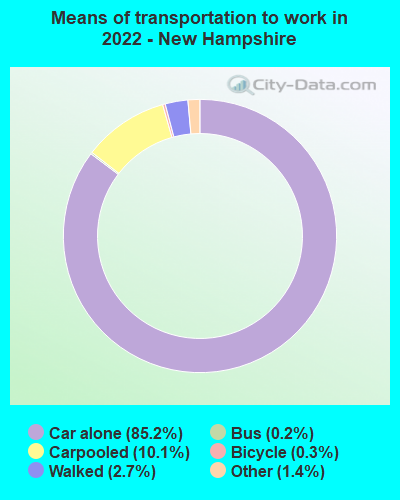
Means of transportation to work
Drove car alone:
Bristol:
66.7% (1,001)
New Hampshire:
85.2% (239,735)
Carpooled:
Bristol:
27.5% (413)
New Hampshire:
10.1% (29,506)
Walked:
Bristol:
5.8% (87)
New Hampshire:
2.7% (8,029)
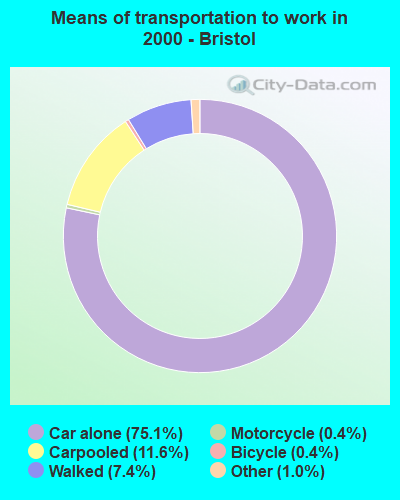
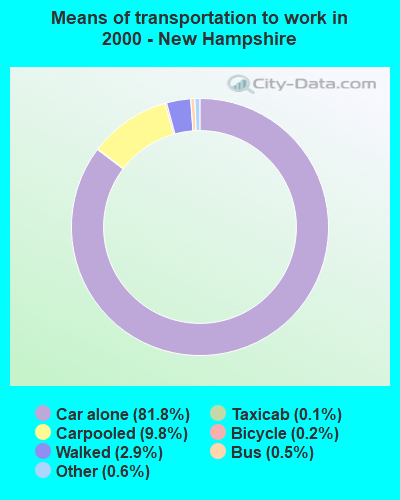
Drove car alone:
Bristol:
75.1% (590)
New Hampshire:
81.8% (522,043)
Carpooled:
Bristol:
11.6% (91)
New Hampshire:
9.8% (62,763)
Motorcycle:
Bristol:
0.4% (3)
New Hampshire:
0.1% (388)
Bicycle:
Bristol:
0.4% (3)
New Hampshire:
0.2% (1,218)
Walked:
Bristol:
7.4% (58)
New Hampshire:
2.9% (18,545)
Other means:
Bristol:
1.0% (8)
New Hampshire:
0.6% (3,656)
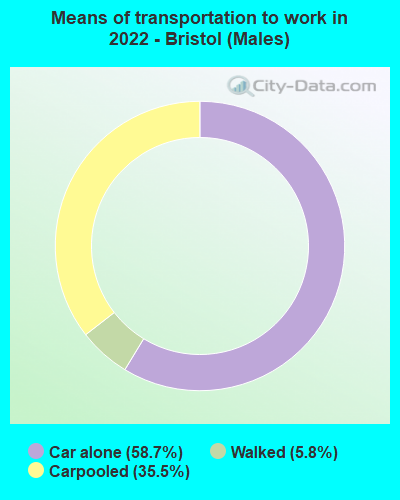
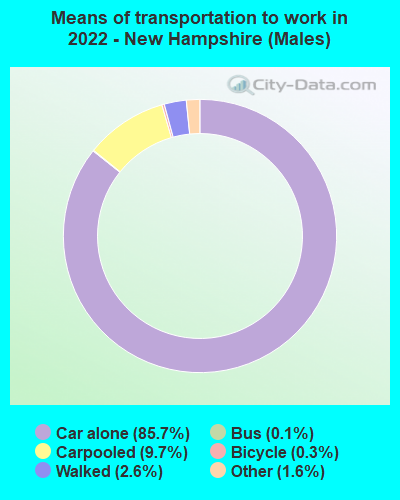
Drove car alone - Males:
Bristol:
58.7% (523)
New Hampshire:
85.7% (239,735)
Carpooled - Males:
Bristol:
35.5% (316)
New Hampshire:
9.7% (29,506)
Walked - Males:
Bristol:
5.8% (52)
New Hampshire:
2.6% (8,029)
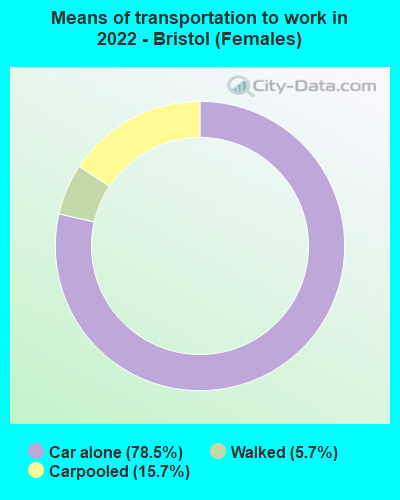
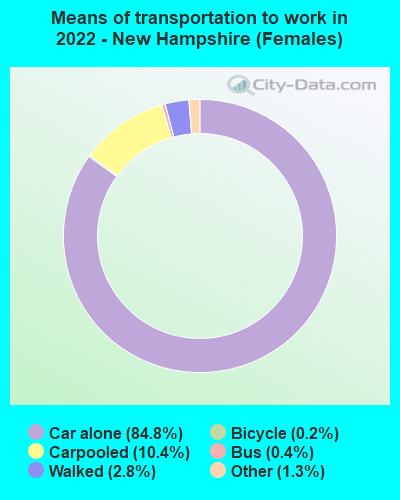
Drove car alone - Females:
Bristol:
78.5% (479)
New Hampshire:
84.8% (239,735)
Carpooled - Females:
Bristol:
15.7% (96)
New Hampshire:
10.4% (29,506)
Walked - Females:
Bristol:
5.7% (35)
New Hampshire:
2.8% (8,029)
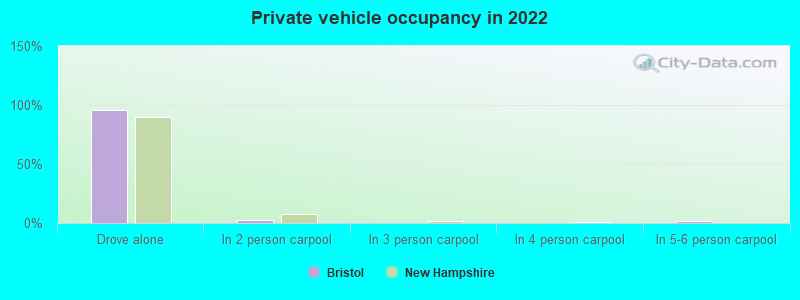
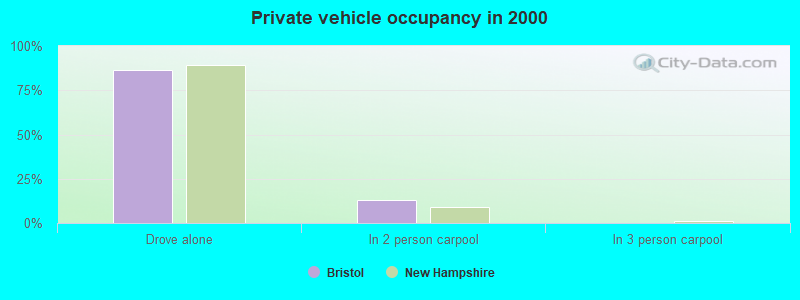
Private vehicle occupancy
Drove alone:
Bristol:
95.5% (793)
New Hampshire:
90.0% (524,218)
In 2 person carpool:
Bristol:
2.5% (20)
New Hampshire:
7.5% (43,431)
In 5-6 person carpool:
Bristol:
1.3% (11)
New Hampshire:
0.4% (2,385)
Drove alone:
Bristol:
86.6% (590)
New Hampshire:
89.3% (522,043)
In 2 person carpool:
Bristol:
12.8% (87)
New Hampshire:
9.0% (52,861)
In 4 person carpool:
Bristol:
0.6% (4)
New Hampshire:
0.3% (1,588)
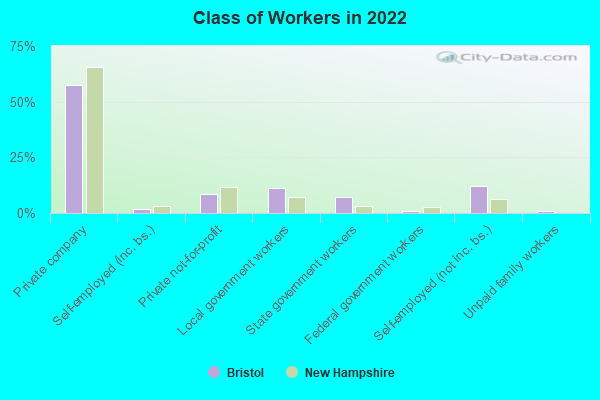
Class of workers
Employee of private company:
Bristol:
57.3% (583)
New Hampshire:
65.6% (494,474)
Self-employed in own incorporated business:
Bristol:
1.9% (19)
New Hampshire:
3.1% (23,693)
Private not-for-profit wage and salary workers:
Bristol:
8.4% (85)
New Hampshire:
11.6% (87,270)
Local government workers:
Bristol:
11.3% (115)
New Hampshire:
7.4% (55,873)
State government workers:
Bristol:
7.1% (72)
New Hampshire:
3.3% (25,109)
Federal government workers:
Bristol:
0.9% (9)
New Hampshire:
2.6% (19,328)
Self-employed workers in own not incorporated business:
Bristol:
12.1% (123)
New Hampshire:
6.2% (46,844)
Unpaid family workers:
Bristol:
1.1% (11)
New Hampshire:
0.2% (1,139)
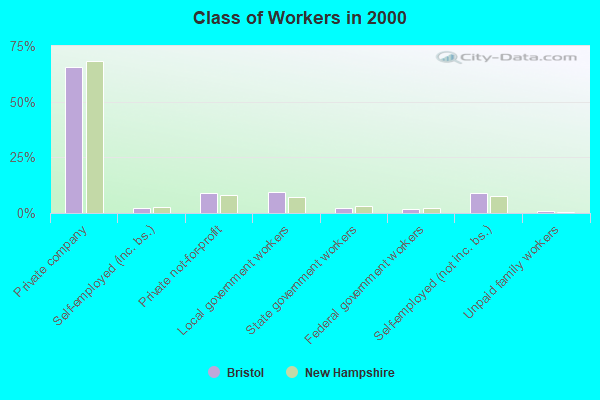
Employee of private company:
Bristol:
65.4% (537)
New Hampshire:
68.4% (445,255)
Self-employed in own incorporated business:
Bristol:
2.2% (18)
New Hampshire:
2.9% (18,595)
Private not-for-profit wage and salary workers:
Bristol:
9.0% (74)
New Hampshire:
8.1% (52,725)
Local government workers:
Bristol:
9.4% (77)
New Hampshire:
7.2% (46,607)
State government workers:
Bristol:
2.3% (19)
New Hampshire:
3.3% (21,558)
Federal government workers:
Bristol:
1.8% (15)
New Hampshire:
2.3% (15,106)
Self-employed workers in own not incorporated business:
Bristol:
8.9% (73)
New Hampshire:
7.6% (49,520)
Unpaid family workers:
Bristol:
1.0% (8)
New Hampshire:
0.2% (1,505)
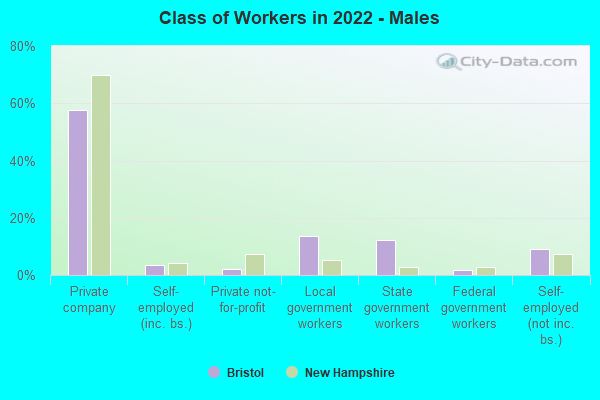
Employee of private company - Males:
Bristol:
57.7% (308)
New Hampshire:
70.0% (277,841)
Self-employed in own incorporated business - Males:
Bristol:
3.5% (19)
New Hampshire:
4.2% (16,657)
Private not-for-profit wage and salary workers - Males:
Bristol:
2.2% (12)
New Hampshire:
7.3% (28,976)
Local government workers - Males:
Bristol:
13.6% (72)
New Hampshire:
5.2% (20,581)
State government workers - Males:
Bristol:
12.1% (64)
New Hampshire:
2.7% (10,753)
Federal government workers - Males:
Bristol:
1.7% (9)
New Hampshire:
2.9% (11,702)
Self-employed workers in own not incorporated business - Males:
Bristol:
9.1% (49)
New Hampshire:
7.5% (29,631)
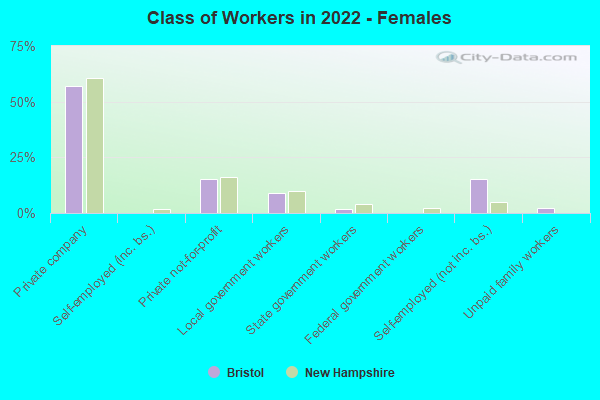
Employee of private company - Females:
Bristol:
56.9% (276)
New Hampshire:
60.7% (216,633)
Private not-for-profit wage and salary workers - Females:
Bristol:
15.1% (73)
New Hampshire:
16.3% (58,294)
Local government workers - Females:
Bristol:
8.8% (43)
New Hampshire:
9.9% (35,292)
State government workers - Females:
Bristol:
1.6% (8)
New Hampshire:
4.0% (14,356)
Self-employed workers in own not incorporated business - Females:
Bristol:
15.3% (74)
New Hampshire:
4.8% (17,213)
Unpaid family workers - Females:
Bristol:
2.2% (11)
New Hampshire:
0.2% (583)
Discuss Bristol, New Hampshire (NH) on our hugely popular New Hampshire forum.