Work and Jobs in Buena Vista, California (CA) Detailed Stats
Occupations, Industries, Unemployment, Workers, Commute
Settings
X


Recent posts about work in Buena Vista, California on our local forum with over 2,400,000 registered users:
 | SF could be in for a big 'doom loop' (349 replies) |
| Family of 4 wanting to move to SD. Is oceanside family friendly? What other areas would you recommend? (30 replies) |
| Does it strike you as odd that we have no party-like beach town in the state? (52 replies) |
| Why I love living in SF (291 replies) |
| Renting a car vs public transportation? (18 replies) |
| Potential Move to Bakersfield: Questions (20 replies) |
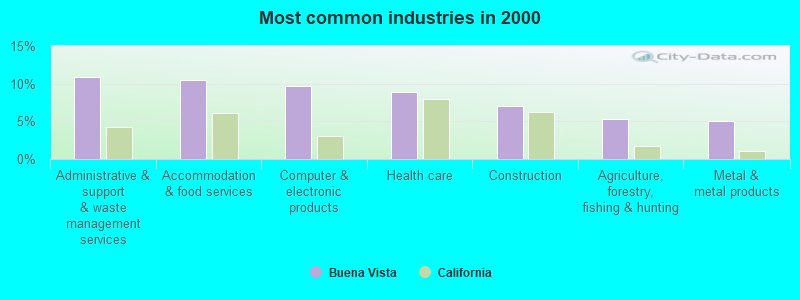
The most common industries in Buena Vista are: Administrative & support & waste management services (10.9% of civilian employees), Accommodation & food services (10.5% of civilian employees), Computer & electronic products (9.6% of civilian employees). 90.1% of workers are employees of private companies, which is 24.5% greater than the rate of 68.0% across the entire state of California.
Most common industries
Most common industries | |||
|---|---|---|---|
Industry | All | Males | Females |
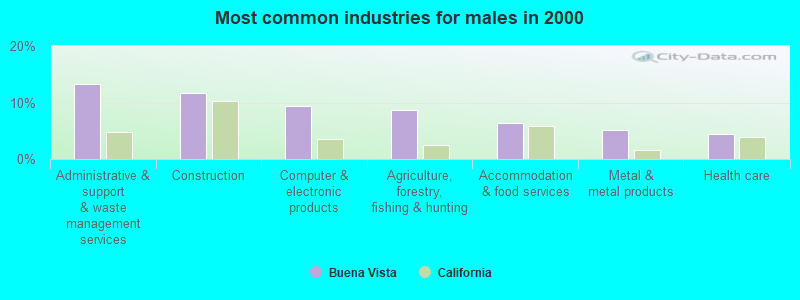
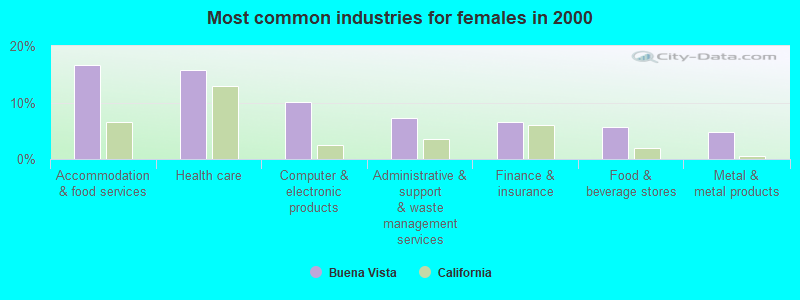
| Administrative and support and waste management services | 10.9% (87) | 13.3% (64) | 7.3% (23) |
| Accommodation and food services | 10.5% (84) | 6.4% (31) | 16.7% (53) |
| Computer and electronic products | 9.6% (77) | 9.4% (45) | 10.1% (32) |
| Health care | 8.9% (71) | 4.4% (21) | 15.8% (50) |
| Construction | 7.0% (56) | 11.6% (56) | 0.0% (0) |
| Agriculture, forestry, fishing and hunting | 5.3% (42) | 8.7% (42) | 0.0% (0) |
| Metal and metal products | 5.0% (40) | 5.2% (25) | 4.7% (15) |
| Finance and insurance | 3.9% (31) | 2.1% (10) | 6.6% (21) |
| Food and beverage stores | 3.6% (29) | 2.3% (11) | 5.7% (18) |
| Department and other general merchandise stores | 3.4% (27) | 2.9% (14) | 4.1% (13) |
| Professional, scientific, and technical services | 2.9% (23) | 2.7% (13) | 3.2% (10) |
| Textile mills and textile products | 2.5% (20) | 4.2% (20) | 0.0% (0) |
| Other transportation, and support activities, and couriers | 2.5% (20) | 4.2% (20) | 0.0% (0) |
| Miscellaneous manufacturing | 2.3% (18) | 3.7% (18) | 0.0% (0) |
| Educational services | 2.0% (16) | 1.9% (9) | 2.2% (7) |
| Social assistance | 1.9% (15) | 0.0% (0) | 4.7% (15) |
| Used merchandise, gift, novelty, and souvenir, and other miscellaneous stores | 1.6% (13) | 0.0% (0) | 4.1% (13) |
| Broadcasting and telecommunications | 1.6% (13) | 0.0% (0) | 4.1% (13) |
| Furniture and home furnishings, and household appliance stores | 1.5% (12) | 2.5% (12) | 0.0% (0) |
| Electrical and electronic goods merchant wholesalers | 1.3% (10) | 2.1% (10) | 0.0% (0) |
| Utilities | 1.3% (10) | 0.0% (0) | 3.2% (10) |
| Printing and related support activities | 1.1% (9) | 1.9% (9) | 0.0% (0) |
| Real estate and rental and leasing | 1.1% (9) | 0.0% (0) | 2.8% (9) |
| Repair and maintenance | 1.1% (9) | 1.9% (9) | 0.0% (0) |
| Wood products | 1.0% (8) | 1.7% (8) | 0.0% (0) |
| Other direct selling establishments | 1.0% (8) | 0.0% (0) | 2.5% (8) |
| Radio, TV, and computer stores | 0.9% (7) | 1.5% (7) | 0.0% (0) |
| Groceries and related products merchant wholesalers | 0.9% (7) | 1.5% (7) | 0.0% (0) |
| Truck transportation | 0.9% (7) | 1.5% (7) | 0.0% (0) |
| Publishing, and motion picture and sound recording industries | 0.9% (7) | 0.0% (0) | 2.2% (7) |
| Personal and laundry services | 0.9% (7) | 1.5% (7) | 0.0% (0) |
| Plastics and rubber products | 0.8% (6) | 1.2% (6) | 0.0% (0) |
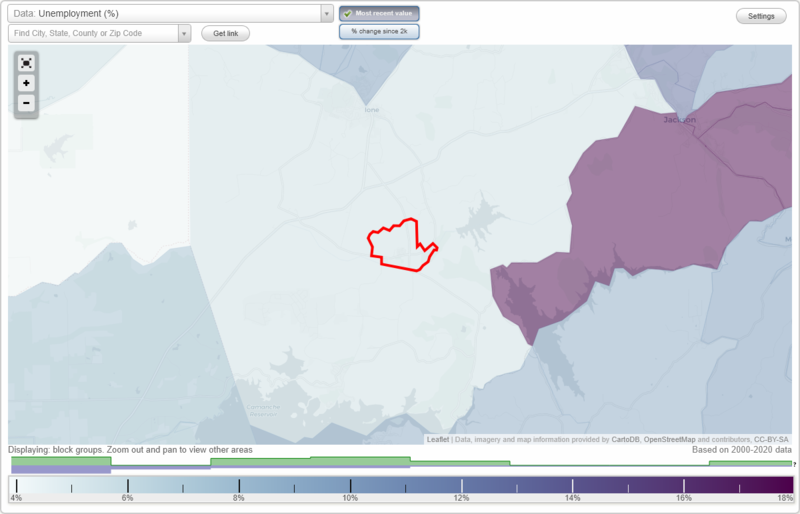
Unemployment in Buena Vista
- Unemployment by race in 2000
- Unemployment rate for White non-Hispanic residents
- 9.8%Males
- 12.1%Females
- Unemployment rate for Black residents
- 7.2%Males
- Unemployment rate for other race residents
- 6.9%Males
- 17.3%Females
- Unemployment rate for two or more race residents
- 30.4%Females
- Unemployment rate for Hispanic or Latino residents
- 4.9%Males
- 13.3%Females
Time leaving home to go to work
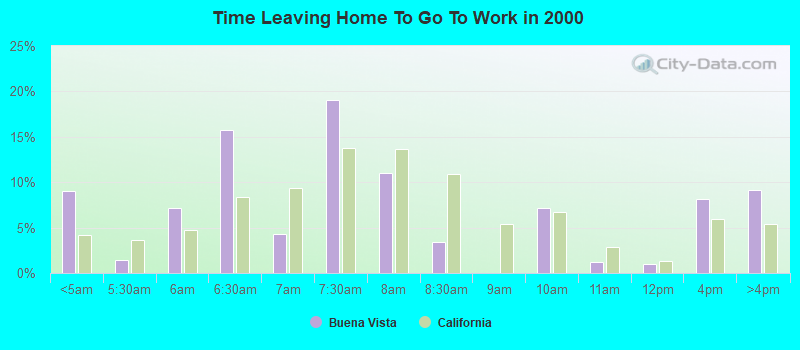
<5am:
| Buena Vista: | 9.0% (72) |
| California: | 4.2% (606,086) |
5:30am:
| Buena Vista: | 1.4% (11) |
| California: | 3.6% (523,209) |
6am:
| Buena Vista: | 7.1% (57) |
| California: | 4.8% (692,256) |
6:30am:
| Buena Vista: | 15.8% (126) |
| California: | 8.4% (1,216,867) |
7am:
| Buena Vista: | 4.3% (34) |
| California: | 9.4% (1,362,830) |
7:30am:
| Buena Vista: | 19.0% (152) |
| California: | 13.8% (2,006,950) |
8am:
| Buena Vista: | 11.0% (88) |
| California: | 13.7% (1,986,831) |
8:30am:
| Buena Vista: | 3.4% (27) |
| California: | 10.9% (1,577,815) |
10am:
| Buena Vista: | 7.1% (57) |
| California: | 6.7% (972,355) |
11am:
| Buena Vista: | 1.3% (10) |
| California: | 2.9% (414,479) |
12pm:
| Buena Vista: | 1.0% (8) |
| California: | 1.3% (189,005) |
4pm:
| Buena Vista: | 8.1% (65) |
| California: | 6.0% (865,284) |
>4pm:
| Buena Vista: | 9.1% (73) |
| California: | 5.3% (776,167) |
Travel time to work
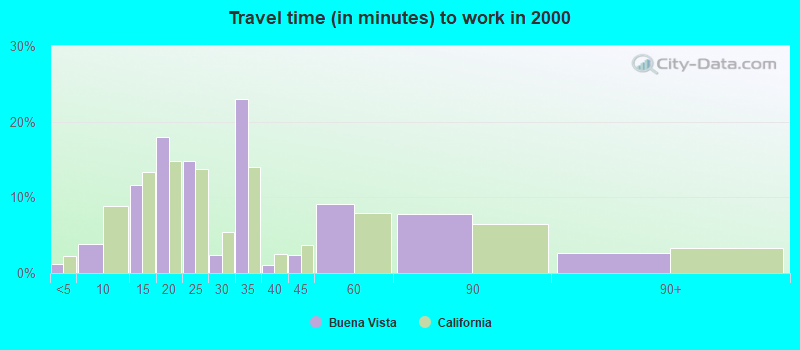
Less than 5 minutes:
| Buena Vista: | 1.1% (9) |
| California: | 2.2% (324,703) |
5 to 9 minutes:
| Buena Vista: | 3.9% (31) |
| California: | 8.8% (1,280,443) |
10 to 14 minutes:
| Buena Vista: | 11.7% (93) |
| California: | 13.3% (1,930,263) |
15 to 19 minutes:
| Buena Vista: | 17.9% (143) |
| California: | 14.9% (2,157,970) |
20 to 24 minutes:
| Buena Vista: | 14.8% (118) |
| California: | 13.8% (2,004,060) |
25 to 29 minutes:
| Buena Vista: | 2.4% (19) |
| California: | 5.4% (782,241) |
30 to 34 minutes:
| Buena Vista: | 23.1% (184) |
| California: | 13.9% (2,025,657) |
35 to 39 minutes:
| Buena Vista: | 1.0% (8) |
| California: | 2.5% (366,487) |
40 to 44 minutes:
| Buena Vista: | 2.4% (19) |
| California: | 3.6% (528,043) |
45 to 59 minutes:
| Buena Vista: | 9.1% (73) |
| California: | 7.9% (1,151,598) |
60 to 89 minutes:
| Buena Vista: | 7.8% (62) |
| California: | 6.4% (933,123) |
90 or more minutes:
| Buena Vista: | 2.6% (21) |
| California: | 3.3% (483,698) |
Means of transportation to work
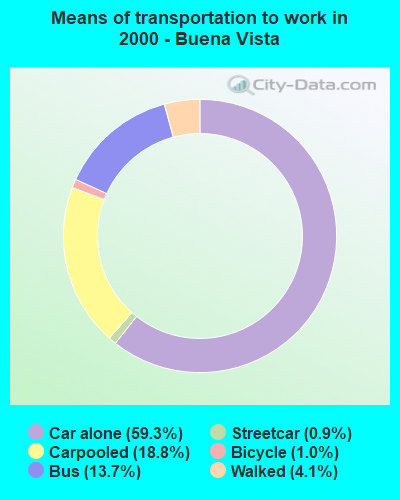

Drove car alone:
| Buena Vista: | 59.3% (473) |
| California: | 71.8% (10,432,462) |
Carpooled:
| Buena Vista: | 18.8% (150) |
| California: | 14.5% (2,113,313) |
Bus or trolley bus:
| Buena Vista: | 13.7% (109) |
| California: | 3.8% (549,425) |
Streetcar or trolley car:
| Buena Vista: | 0.9% (7) |
| California: | 0.1% (21,158) |
Bicycle:
| Buena Vista: | 1.0% (8) |
| California: | 0.8% (120,567) |
Walked:
| Buena Vista: | 4.1% (33) |
| California: | 2.9% (414,581) |
Private vehicle occupancy
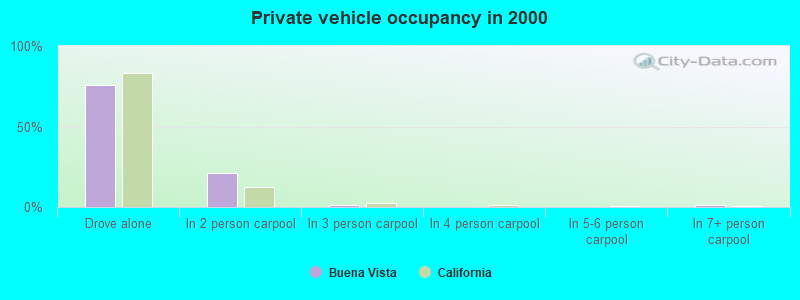
Drove alone:
| Buena Vista: | 75.9% (473) |
| California: | 83.2% (10,432,462) |
In 2 person carpool:
| Buena Vista: | 21.2% (132) |
| California: | 12.5% (1,564,905) |
In 3 person carpool:
| Buena Vista: | 1.4% (9) |
| California: | 2.6% (330,732) |
In 7+ person carpool:
| Buena Vista: | 1.4% (9) |
| California: | 0.3% (41,276) |
Class of workers
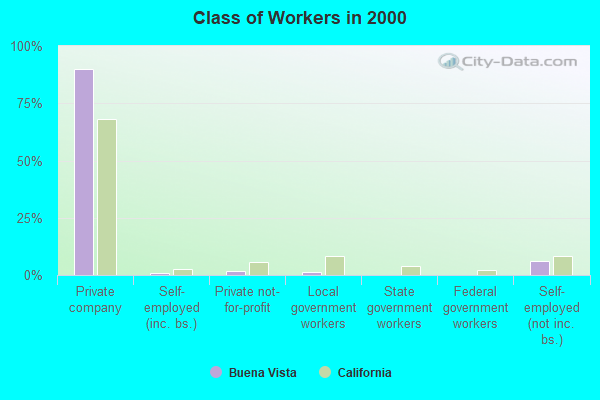
Employee of private company:
| Buena Vista: | 90.1% (719) |
| California: | 68.0% (10,009,465) |
Self-employed in own incorporated business:
| Buena Vista: | 1.0% (8) |
| California: | 2.7% (402,392) |
Private not-for-profit wage and salary workers:
| Buena Vista: | 1.8% (14) |
| California: | 5.7% (845,536) |
Local government workers:
| Buena Vista: | 1.1% (9) |
| California: | 8.3% (1,218,764) |
Self-employed workers in own not incorporated business:
| Buena Vista: | 6.0% (48) |
| California: | 8.5% (1,249,530) |
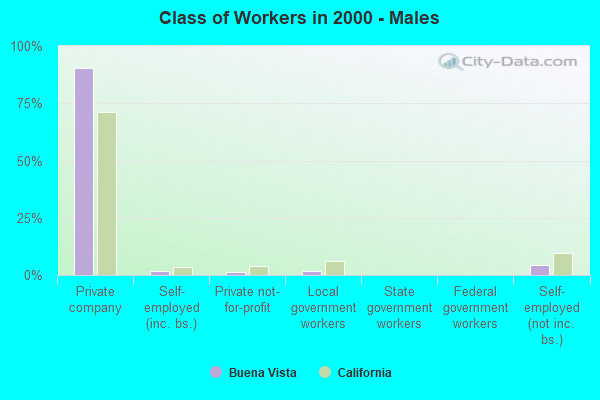
Employee of private company - Males:
| Buena Vista: | 90.4% (435) |
| California: | 71.1% (5,716,697) |
Self-employed in own incorporated business - Males:
| Buena Vista: | 1.7% (8) |
| California: | 3.6% (290,657) |
Private not-for-profit wage and salary workers - Males:
| Buena Vista: | 1.5% (7) |
| California: | 3.8% (303,997) |
Local government workers - Males:
| Buena Vista: | 1.9% (9) |
| California: | 6.2% (495,927) |
Self-employed workers in own not incorporated business - Males:
| Buena Vista: | 4.6% (22) |
| California: | 9.5% (760,853) |
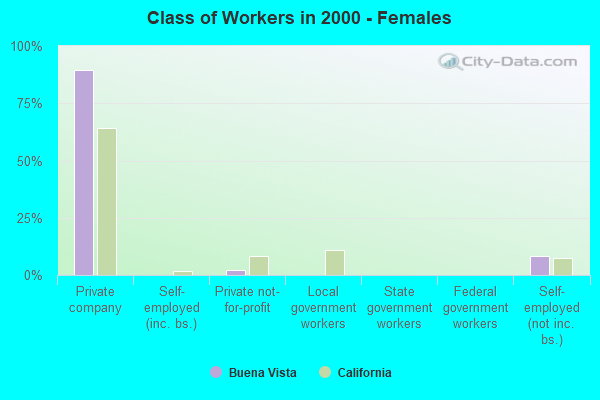
Employee of private company - Females:
| Buena Vista: | 89.6% (284) |
| California: | 64.3% (4,292,768) |
Private not-for-profit wage and salary workers - Females:
| Buena Vista: | 2.2% (7) |
| California: | 8.1% (541,539) |
Self-employed workers in own not incorporated business - Females:
| Buena Vista: | 8.2% (26) |
| California: | 7.3% (488,677) |