Work and Jobs in Burbank, Illinois (IL) Detailed Stats
Occupations, Industries, Unemployment, Workers, Commute
Settings
X


Recent posts about work in Burbank, Illinois on our local forum with over 2,400,000 registered users:
 | Western Suburbs that are easier to work with (4 replies) |
| Info on Oak Lawn & surrounding areas? (12 replies) |
| Oak Lawn, Midlothian, Palos [Insert Noun Here], Worth (16 replies) |
| Which suburbs will go down in value most in the next 10 years? (58 replies) |
| History of Central Stickney (10 replies) |
| Best places to live outside Chicago for young female? (20 replies) |
Latest news about work in Burbank, IL collected exclusively by city-data.com from local newspapers, TV, and radio stations
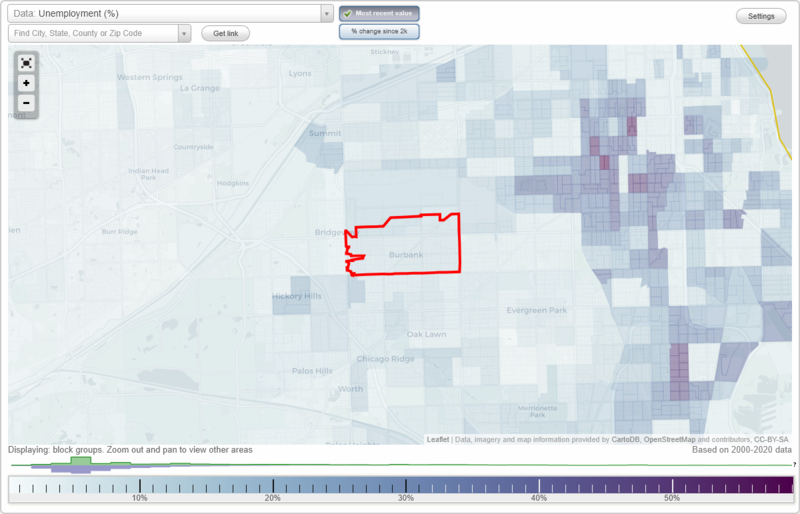
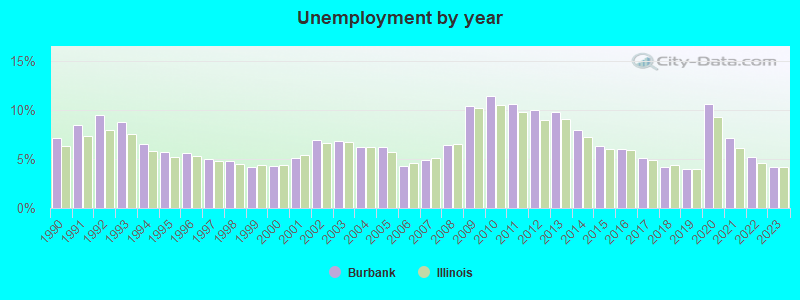
The unemployment rate in 2023 in Burbank, IL was 4.2%, which was about the same as the unemployment rate of 4.2% across the entire state of Illinois. Compared to the unemployment rate of 9.8% in 2013, this represents a decrease of 133.3%. The most common industries in Burbank are: Health care (7.1% of civilian employees), Construction (6.2% of civilian employees), Finance & insurance (5.6% of civilian employees). 88.4% of workers work in Cook County and 4.3% of all workers work at home. 76.2% of workers are employees of private companies, which is 10.4% greater than the rate of 68.3% across the entire state of Illinois.
Whole page based on the data from 2000 / 2022 when the population of Burbank, Illinois was 27,902 / 28,475
Whole page based on the data from 2000 / 2022 when the population of Burbank, Illinois was 27,902 / 28,475
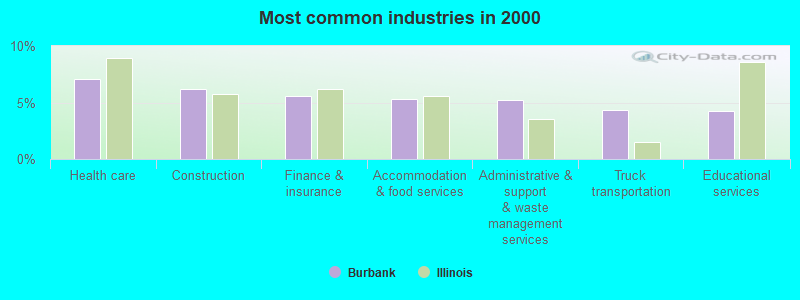
Most common industries
Most common industries | |||
|---|---|---|---|
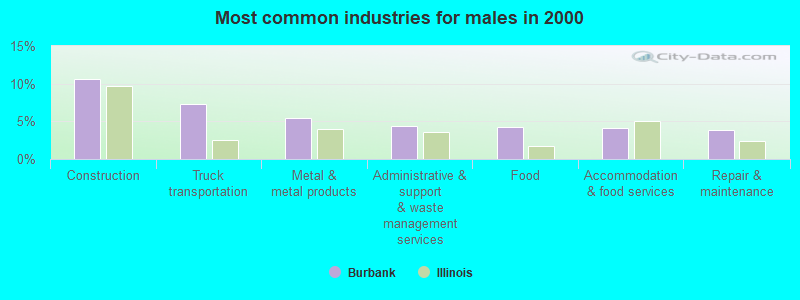
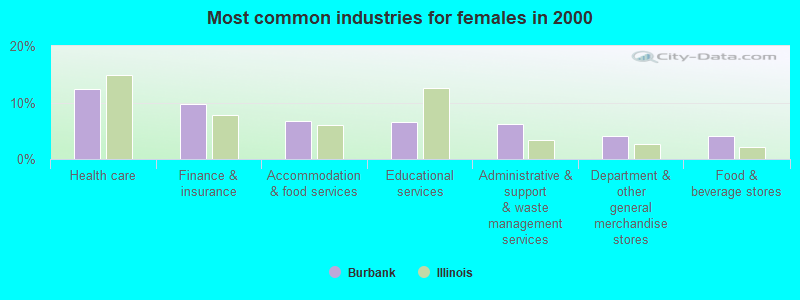
Industry | All | Males | Females |
| Health care | 7.1% (947) | 2.8% (201) | 12.4% (746) |
| Construction | 6.2% (823) | 10.6% (777) | 0.8% (46) |
| Finance and insurance | 5.6% (743) | 2.2% (159) | 9.7% (584) |
| Accommodation and food services | 5.3% (703) | 4.1% (303) | 6.7% (400) |
| Administrative and support and waste management services | 5.2% (695) | 4.4% (320) | 6.2% (375) |
| Truck transportation | 4.4% (580) | 7.3% (532) | 0.8% (48) |
| Educational services | 4.2% (560) | 2.2% (162) | 6.6% (398) |
| Food and beverage stores | 4.0% (527) | 3.9% (282) | 4.1% (245) |
| Metal and metal products | 3.8% (500) | 5.4% (398) | 1.7% (102) |
| Food | 3.7% (489) | 4.2% (309) | 3.0% (180) |
| Professional, scientific, and technical services | 3.1% (412) | 2.5% (184) | 3.8% (228) |
| Department and other general merchandise stores | 2.7% (361) | 1.5% (113) | 4.1% (248) |
| Public administration | 2.7% (361) | 2.9% (212) | 2.5% (149) |
| Repair and maintenance | 2.6% (350) | 3.9% (283) | 1.1% (67) |
| Other transportation, and support activities, and couriers | 2.4% (315) | 3.1% (227) | 1.5% (88) |
| Miscellaneous manufacturing | 1.9% (252) | 1.8% (134) | 2.0% (118) |
| Machinery | 1.8% (244) | 3.0% (218) | 0.4% (26) |
| Printing and related support activities | 1.7% (227) | 1.7% (121) | 1.8% (106) |
| Motor vehicle and parts dealers | 1.6% (216) | 2.5% (185) | 0.5% (31) |
| Religious, grantmaking, civic, professional, and similar organizations | 1.4% (180) | 1.0% (71) | 1.8% (109) |
| Personal and laundry services | 1.3% (179) | 0.4% (32) | 2.4% (147) |
| Paper | 1.3% (170) | 1.4% (100) | 1.2% (70) |
| Rail transportation | 1.3% (167) | 1.9% (141) | 0.4% (26) |
| Social assistance | 1.2% (161) | 0.5% (40) | 2.0% (121) |
| Real estate and rental and leasing | 1.1% (143) | 1.4% (101) | 0.7% (42) |
| U. S. Postal service | 1.0% (138) | 1.0% (76) | 1.0% (62) |
| Groceries and related products merchant wholesalers | 1.0% (129) | 1.5% (108) | 0.3% (21) |
| Clothing and accessories, including shoe, stores | 0.9% (124) | 0.1% (6) | 2.0% (118) |
| Building material and garden equipment and supplies dealers | 0.9% (122) | 1.0% (72) | 0.8% (50) |
| Arts, entertainment, and recreation | 0.9% (122) | 1.1% (78) | 0.7% (44) |
| Computer and electronic products | 0.8% (108) | 0.5% (38) | 1.2% (70) |
| Chemicals | 0.8% (106) | 1.1% (80) | 0.4% (26) |
| Plastics and rubber products | 0.8% (104) | 0.9% (64) | 0.7% (40) |
| Broadcasting and telecommunications | 0.8% (101) | 1.0% (75) | 0.4% (26) |
| Publishing, and motion picture and sound recording industries | 0.8% (100) | 0.8% (58) | 0.7% (42) |
| Other direct selling establishments | 0.8% (100) | 0.2% (18) | 1.4% (82) |
| Electrical equipment, appliances, and components | 0.8% (100) | 0.8% (61) | 0.6% (39) |
| Pharmacies and drug stores | 0.7% (96) | 0.6% (43) | 0.9% (53) |
| Furniture and related product manufacturing | 0.7% (88) | 0.7% (48) | 0.7% (40) |
| Metals and minerals, except petroleum, merchant wholesalers | 0.7% (87) | 0.9% (66) | 0.3% (21) |
| Machinery, equipment, and supplies merchant wholesalers | 0.6% (85) | 0.7% (50) | 0.6% (35) |
| Private households | 0.6% (82) | 0.1% (9) | 1.2% (73) |
| Transportation equipment | 0.6% (81) | 0.6% (41) | 0.7% (40) |
| Warehousing and storage | 0.6% (76) | 0.9% (64) | 0.2% (12) |
| Data processing, libraries, and other information services | 0.6% (74) | 0.7% (54) | 0.3% (20) |
| Furniture and home furnishings, and household appliance stores | 0.5% (66) | 0.6% (47) | 0.3% (19) |
| Utilities | 0.5% (65) | 0.8% (57) | 0.1% (8) |
| Used merchandise, gift, novelty, and souvenir, and other miscellaneous stores | 0.5% (63) | 0.1% (5) | 1.0% (58) |
| Air transportation | 0.4% (59) | 0.5% (36) | 0.4% (23) |
| Apparel | 0.4% (52) | 0.1% (6) | 0.8% (46) |
| Gasoline stations | 0.4% (52) | 0.6% (41) | 0.2% (11) |
| Radio, TV, and computer stores | 0.4% (49) | 0.4% (31) | 0.3% (18) |
| Motor vehicles, parts and supplies merchant wholesalers | 0.4% (48) | 0.5% (40) | 0.1% (8) |
| Beverage and tobacco products | 0.3% (45) | 0.6% (45) | 0.0% (0) |
| Electrical and electronic goods merchant wholesalers | 0.3% (44) | 0.5% (40) | 0.1% (4) |
| Nonmetallic mineral products | 0.3% (40) | 0.4% (32) | 0.1% (8) |
| Miscellaneous nondurable goods merchant wholesalers | 0.3% (35) | 0.2% (11) | 0.4% (24) |
| Leather and allied products | 0.2% (30) | 0.1% (9) | 0.3% (21) |
| Professional and commercial equipment and supplies merchant wholesalers | 0.2% (28) | 0.2% (15) | 0.2% (13) |
| Drugs, sundries, and chemical and allied products merchant wholesalers | 0.2% (27) | 0.1% (8) | 0.3% (19) |
| Wood products | 0.2% (25) | 0.3% (25) | 0.0% (0) |
| Electronic shopping and mail-order houses | 0.2% (24) | 0.2% (13) | 0.2% (11) |
| Miscellaneous durable goods merchant wholesalers | 0.2% (24) | 0.2% (17) | 0.1% (7) |
| Alcoholic beverages merchant wholesalers | 0.2% (22) | 0.2% (11) | 0.2% (11) |
| Health and personal care, except drug, stores | 0.2% (20) | 0.2% (14) | 0.1% (6) |
| Lumber and other construction materials merchant wholesalers | 0.2% (20) | 0.3% (20) | 0.0% (0) |
| Textile mills and textile products | 0.1% (19) | 0.0% (0) | 0.3% (19) |
| Hardware, plumbing and heating equipment, and supplies merchant wholesalers | 0.1% (19) | 0.1% (7) | 0.2% (12) |
| Recyclable material merchant wholesalers | 0.1% (19) | 0.3% (19) | 0.0% (0) |
| Vending machine operators | 0.1% (18) | 0.2% (11) | 0.1% (7) |
| Jewelry, luggage, and leather goods stores | 0.1% (17) | 0.1% (5) | 0.2% (12) |
Unemployment in Burbank
- Unemployment by race in 2022
- Unemployment rate for White non-Hispanic residents
- 5.2%Males
- 4.0%Females
- Unemployment rate for Black residents
- 26.5%Males
- 26.6%Females
- Unemployment rate for Asian residents
- 4.7%Males
- Unemployment rate for other race residents
- 16.2%Males
- 0.8%Females
- Unemployment rate for two or more race residents
- 8.2%Males
- 10.0%Females
- Unemployment rate for Hispanic or Latino residents
- 9.2%Males
- 5.7%Females
- Unemployment by race in 2000
- Unemployment rate for White non-Hispanic residents
- 4.2%Males
- 6.2%Females
- Unemployment rate for American Indian and Alaska Native residents
- 17.6%Females
- Unemployment rate for Asian residents
- 3.5%Males
- Unemployment rate for other race residents
- 6.8%Males
- 1.8%Females
- Unemployment rate for two or more race residents
- 4.0%Males
- 3.7%Females
- Unemployment rate for Hispanic or Latino residents
- 9.3%Males
- 7.1%Females
Unemployment in 2023:
| Burbank: | 4.2% |
| Illinois: | 4.2% |
Unemployment in 2022:
| Burbank: | 5.2% |
| Illinois: | 4.6% |
Unemployment in 2021:
| Burbank: | 7.1% |
| Illinois: | 6.1% |
Unemployment in 2020:
| Burbank: | 10.6% |
| Illinois: | 9.3% |
Unemployment in 2019:
| Burbank: | 4.0% |
| Illinois: | 4.0% |
Unemployment in 2018:
| Burbank: | 4.2% |
| Illinois: | 4.4% |
Unemployment in 2017:
| Burbank: | 5.1% |
| Illinois: | 4.9% |
Unemployment in 2016:
| Burbank: | 6.0% |
| Illinois: | 5.9% |
Unemployment in 2015:
| Burbank: | 6.3% |
| Illinois: | 6.0% |
Unemployment in 2014:
| Burbank: | 7.9% |
| Illinois: | 7.2% |
Unemployment in 2013:
| Burbank: | 9.8% |
| Illinois: | 9.1% |
Unemployment in 2012:
| Burbank: | 10.0% |
| Illinois: | 9.0% |
Unemployment in 2011:
| Burbank: | 10.6% |
| Illinois: | 9.8% |
Unemployment in 2010:
| Burbank: | 11.4% |
| Illinois: | 10.5% |
Unemployment in 2009:
| Burbank: | 10.4% |
| Illinois: | 10.2% |
Unemployment in 2008:
| Burbank: | 6.4% |
| Illinois: | 6.5% |
Unemployment in 2007:
| Burbank: | 4.9% |
| Illinois: | 5.1% |
Unemployment in 2006:
| Burbank: | 4.3% |
| Illinois: | 4.6% |
Unemployment in 2005:
| Burbank: | 6.2% |
| Illinois: | 5.7% |
Unemployment in 2004:
| Burbank: | 6.2% |
| Illinois: | 6.2% |
Unemployment in 2003:
| Burbank: | 6.8% |
| Illinois: | 6.7% |
Unemployment in 2002:
| Burbank: | 6.9% |
| Illinois: | 6.6% |
Unemployment in 2001:
| Burbank: | 5.1% |
| Illinois: | 5.4% |
Unemployment in 2000:
| Burbank: | 4.3% |
| Illinois: | 4.4% |
Unemployment in 1999:
| Burbank: | 4.2% |
| Illinois: | 4.4% |
Unemployment in 1998:
| Burbank: | 4.8% |
| Illinois: | 4.5% |
Unemployment in 1997:
| Burbank: | 5.0% |
| Illinois: | 4.8% |
Unemployment in 1996:
| Burbank: | 5.6% |
| Illinois: | 5.3% |
Unemployment in 1995:
| Burbank: | 5.7% |
| Illinois: | 5.2% |
Unemployment in 1994:
| Burbank: | 6.5% |
| Illinois: | 5.8% |
Unemployment in 1993:
| Burbank: | 8.8% |
| Illinois: | 7.5% |
Unemployment in 1992:
| Burbank: | 9.5% |
| Illinois: | 7.9% |
Unemployment in 1991:
| Burbank: | 8.5% |
| Illinois: | 7.3% |
Unemployment in 1990:
| Burbank: | 7.1% |
| Illinois: | 6.3% |
Time leaving home to go to work
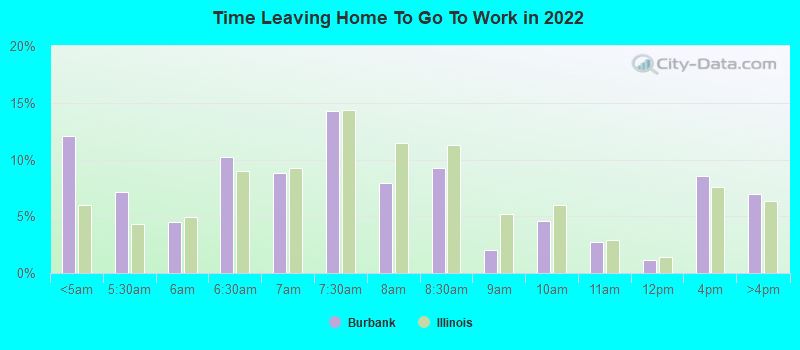
12:00 a.m. to 4:59 a.m.:
| Burbank: | 12.1% (1,422) |
| Illinois: | 6.0% (313,385) |
5:00 a.m. to 5:29 a.m.:
| Burbank: | 7.2% (844) |
| Illinois: | 4.3% (226,583) |
5:30 a.m. to 5:59 a.m.:
| Burbank: | 4.5% (528) |
| Illinois: | 4.9% (254,951) |
6:00 a.m. to 6:29 a.m.:
| Burbank: | 10.3% (1,205) |
| Illinois: | 8.9% (466,416) |
6:30 a.m. to 6:59 a.m.:
| Burbank: | 8.8% (1,039) |
| Illinois: | 9.3% (484,300) |
7:00 a.m. to 7:29 a.m.:
| Burbank: | 14.3% (1,678) |
| Illinois: | 14.3% (746,798) |
7:30 a.m. to 7:59 a.m.:
| Burbank: | 7.9% (930) |
| Illinois: | 11.5% (597,236) |
8:00 a.m. to 8:29 a.m.:
| Burbank: | 9.2% (1,083) |
| Illinois: | 11.2% (585,810) |
8:30 a.m. to 8:59 a.m.:
| Burbank: | 2.0% (240) |
| Illinois: | 5.2% (271,981) |
9:00 a.m. to 9:59 a.m.:
| Burbank: | 4.6% (539) |
| Illinois: | 6.0% (310,820) |
10:00 a.m. to 10:59 a.m.:
| Burbank: | 2.7% (321) |
| Illinois: | 2.9% (153,745) |
11:00 a.m. to 11:59 a.m.:
| Burbank: | 1.2% (140) |
| Illinois: | 1.4% (74,140) |
12:00 p.m. to 3:59 p.m.:
| Burbank: | 8.6% (1,007) |
| Illinois: | 7.6% (397,128) |
4:00 p.m. to 11:59 p.m.:
| Burbank: | 6.9% (814) |
| Illinois: | 6.3% (328,692) |
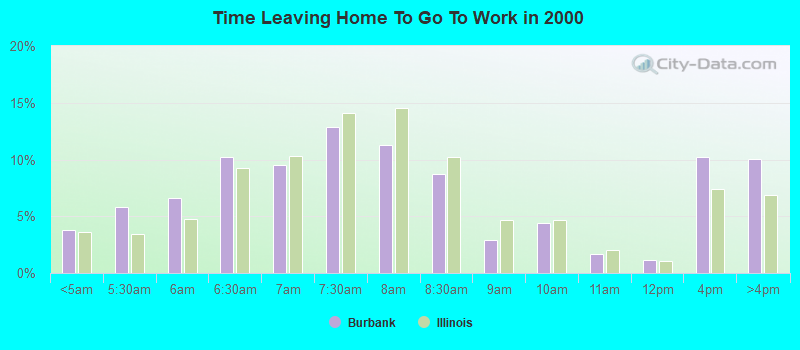
<5am:
| Burbank: | 3.8% (494) |
| Illinois: | 3.6% (205,429) |
5:30am:
| Burbank: | 5.8% (755) |
| Illinois: | 3.5% (199,483) |
6am:
| Burbank: | 6.6% (858) |
| Illinois: | 4.8% (274,395) |
6:30am:
| Burbank: | 10.2% (1,331) |
| Illinois: | 9.3% (532,224) |
7am:
| Burbank: | 9.5% (1,232) |
| Illinois: | 10.3% (593,196) |
7:30am:
| Burbank: | 12.9% (1,674) |
| Illinois: | 14.1% (808,399) |
8am:
| Burbank: | 11.3% (1,465) |
| Illinois: | 14.5% (834,444) |
8:30am:
| Burbank: | 8.7% (1,131) |
| Illinois: | 10.2% (588,282) |
9am:
| Burbank: | 2.9% (380) |
| Illinois: | 4.6% (266,648) |
10am:
| Burbank: | 4.4% (570) |
| Illinois: | 4.7% (269,854) |
11am:
| Burbank: | 1.6% (212) |
| Illinois: | 2.1% (118,418) |
12pm:
| Burbank: | 1.2% (154) |
| Illinois: | 1.0% (59,913) |
4pm:
| Burbank: | 10.2% (1,327) |
| Illinois: | 7.4% (425,049) |
>4pm:
| Burbank: | 10.1% (1,310) |
| Illinois: | 6.8% (393,506) |
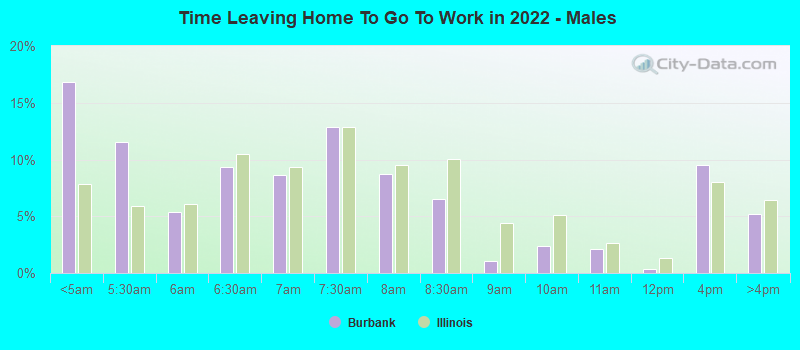
12:00 a.m. to 4:59 a.m. - Males:
| Burbank: | 16.9% (1,158) |
| Illinois: | 7.8% (217,984) |
5:00 a.m. to 5:29 a.m. - Males:
| Burbank: | 11.6% (794) |
| Illinois: | 5.9% (165,953) |
5:30 a.m. to 5:59 a.m. - Males:
| Burbank: | 5.4% (372) |
| Illinois: | 6.1% (170,969) |
6:00 a.m. to 6:29 a.m. - Males:
| Burbank: | 9.4% (644) |
| Illinois: | 10.5% (292,003) |
6:30 a.m. to 6:59 a.m. - Males:
| Burbank: | 8.6% (593) |
| Illinois: | 9.4% (261,362) |
7:00 a.m. to 7:29 a.m. - Males:
| Burbank: | 12.8% (881) |
| Illinois: | 12.9% (360,098) |
7:30 a.m. to 7:59 a.m. - Males:
| Burbank: | 8.7% (596) |
| Illinois: | 9.5% (265,464) |
8:00 a.m. to 8:29 a.m. - Males:
| Burbank: | 6.5% (447) |
| Illinois: | 10.1% (280,890) |
8:30 a.m. to 8:59 a.m. - Males:
| Burbank: | 1.1% (72) |
| Illinois: | 4.4% (122,100) |
9:00 a.m. to 9:59 a.m. - Males:
| Burbank: | 2.4% (166) |
| Illinois: | 5.1% (141,789) |
10:00 a.m. to 10:59 a.m. - Males:
| Burbank: | 2.1% (142) |
| Illinois: | 2.6% (72,802) |
11:00 a.m. to 11:59 a.m. - Males:
| Burbank: | 0.4% (26) |
| Illinois: | 1.4% (38,018) |
12:00 p.m. to 3:59 p.m. - Males:
| Burbank: | 9.5% (655) |
| Illinois: | 8.0% (224,733) |
4:00 p.m. to 11:59 p.m. - Males:
| Burbank: | 5.2% (357) |
| Illinois: | 6.4% (179,820) |
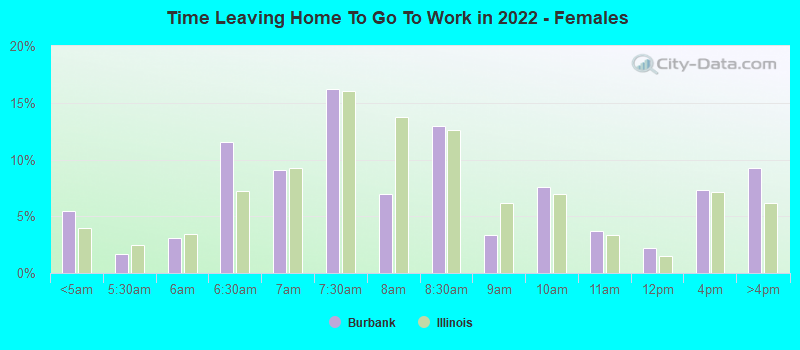
12:00 a.m. to 4:59 a.m. - Females:
| Burbank: | 5.4% (266) |
| Illinois: | 3.9% (95,401) |
5:00 a.m. to 5:29 a.m. - Females:
| Burbank: | 1.7% (81) |
| Illinois: | 2.5% (60,630) |
5:30 a.m. to 5:59 a.m. - Females:
| Burbank: | 3.1% (153) |
| Illinois: | 3.5% (83,982) |
6:00 a.m. to 6:29 a.m. - Females:
| Burbank: | 11.5% (565) |
| Illinois: | 7.2% (174,413) |
6:30 a.m. to 6:59 a.m. - Females:
| Burbank: | 9.1% (445) |
| Illinois: | 9.2% (222,938) |
7:00 a.m. to 7:29 a.m. - Females:
| Burbank: | 16.2% (792) |
| Illinois: | 16.0% (386,700) |
7:30 a.m. to 7:59 a.m. - Females:
| Burbank: | 7.0% (341) |
| Illinois: | 13.7% (331,772) |
8:00 a.m. to 8:29 a.m. - Females:
| Burbank: | 13.0% (634) |
| Illinois: | 12.6% (304,920) |
8:30 a.m. to 8:59 a.m. - Females:
| Burbank: | 3.4% (165) |
| Illinois: | 6.2% (149,881) |
9:00 a.m. to 9:59 a.m. - Females:
| Burbank: | 7.6% (372) |
| Illinois: | 7.0% (169,031) |
10:00 a.m. to 10:59 a.m. - Females:
| Burbank: | 3.7% (180) |
| Illinois: | 3.3% (80,943) |
11:00 a.m. to 11:59 a.m. - Females:
| Burbank: | 2.2% (108) |
| Illinois: | 1.5% (36,122) |
12:00 p.m. to 3:59 p.m. - Females:
| Burbank: | 7.3% (359) |
| Illinois: | 7.1% (172,395) |
4:00 p.m. to 11:59 p.m. - Females:
| Burbank: | 9.3% (454) |
| Illinois: | 6.2% (148,872) |
Travel time to work
Percentage of workers working in this county: 88.4%
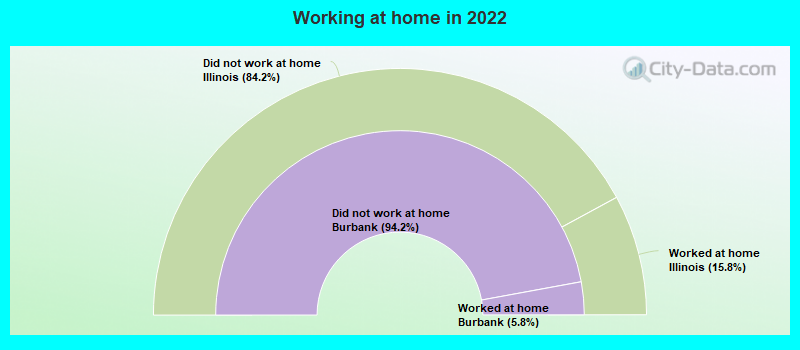
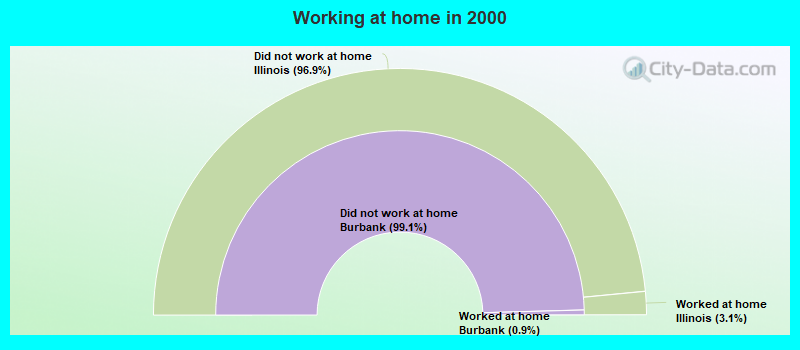
Number of people working at home: 554 (4.3% of all workers)
Daytime population change due to commuting: -7,670 (-27.5%)
Workers who live and work in this city: 1,303 (10.0%)
Number of people working at home: 554 (4.3% of all workers)
Daytime population change due to commuting: -7,670 (-27.5%)
Workers who live and work in this city: 1,303 (10.0%)
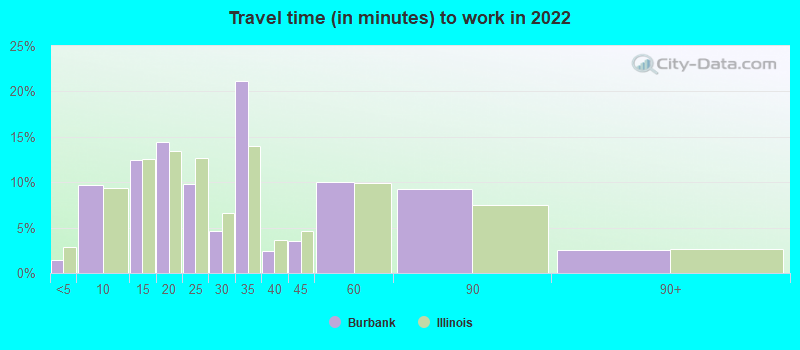
Less than 5 minutes:
| Burbank: | 1.5% (76) |
| Illinois: | 2.9% (151,500) |
5 to 9 minutes:
| Burbank: | 9.7% (504) |
| Illinois: | 9.3% (484,780) |
10 to 14 minutes:
| Burbank: | 12.5% (648) |
| Illinois: | 12.6% (654,154) |
15 to 19 minutes:
| Burbank: | 14.5% (750) |
| Illinois: | 13.4% (697,690) |
20 to 24 minutes:
| Burbank: | 9.8% (510) |
| Illinois: | 12.7% (661,266) |
25 to 29 minutes:
| Burbank: | 4.6% (240) |
| Illinois: | 6.6% (345,772) |
30 to 34 minutes:
| Burbank: | 21.1% (1,095) |
| Illinois: | 14.0% (729,633) |
35 to 39 minutes:
| Burbank: | 2.5% (127) |
| Illinois: | 3.6% (189,131) |
40 to 44 minutes:
| Burbank: | 3.5% (180) |
| Illinois: | 4.6% (241,655) |
45 to 59 minutes:
| Burbank: | 10.0% (519) |
| Illinois: | 9.9% (515,517) |
60 to 89 minutes:
| Burbank: | 9.3% (481) |
| Illinois: | 7.5% (392,412) |
90 or more minutes:
| Burbank: | 2.5% (129) |
| Illinois: | 2.7% (139,001) |
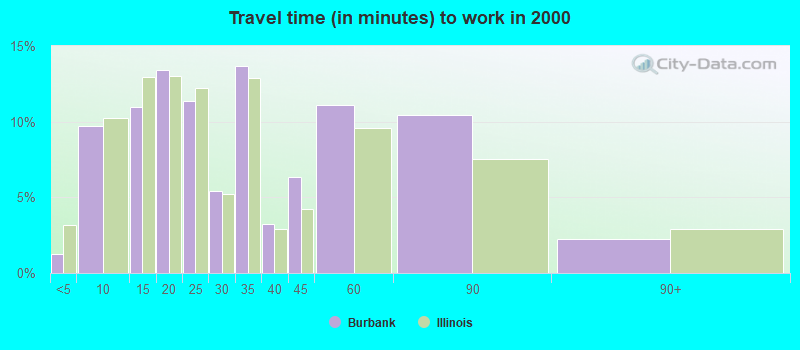
Less than 5 minutes:
| Burbank: | 1.2% (160) |
| Illinois: | 3.2% (183,600) |
5 to 9 minutes:
| Burbank: | 9.7% (1,267) |
| Illinois: | 10.2% (587,746) |
10 to 14 minutes:
| Burbank: | 11.0% (1,430) |
| Illinois: | 12.9% (743,149) |
15 to 19 minutes:
| Burbank: | 13.4% (1,748) |
| Illinois: | 13.0% (748,578) |
20 to 24 minutes:
| Burbank: | 11.3% (1,475) |
| Illinois: | 12.2% (703,743) |
25 to 29 minutes:
| Burbank: | 5.4% (702) |
| Illinois: | 5.2% (298,361) |
30 to 34 minutes:
| Burbank: | 13.6% (1,775) |
| Illinois: | 12.9% (741,188) |
35 to 39 minutes:
| Burbank: | 3.2% (421) |
| Illinois: | 2.9% (165,521) |
40 to 44 minutes:
| Burbank: | 6.3% (825) |
| Illinois: | 4.3% (244,350) |
45 to 59 minutes:
| Burbank: | 11.1% (1,445) |
| Illinois: | 9.6% (551,290) |
60 to 89 minutes:
| Burbank: | 10.4% (1,357) |
| Illinois: | 7.5% (432,921) |
90 or more minutes:
| Burbank: | 2.2% (288) |
| Illinois: | 2.9% (168,793) |
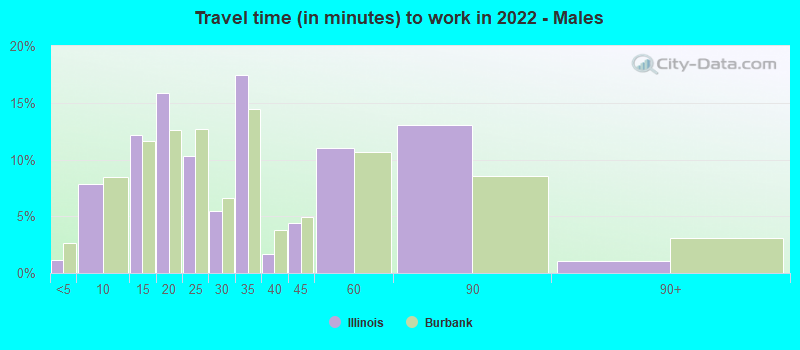
Less than 5 minutes - Males:
| Burbank: | 1.2% (27) |
| Illinois: | 2.6% (74,189) |
5 to 9 minutes - Males:
| Burbank: | 7.8% (182) |
| Illinois: | 8.4% (236,590) |
10 to 14 minutes - Males:
| Burbank: | 12.2% (285) |
| Illinois: | 11.7% (327,032) |
15 to 19 minutes - Males:
| Burbank: | 15.9% (371) |
| Illinois: | 12.6% (352,436) |
20 to 24 minutes - Males:
| Burbank: | 10.3% (241) |
| Illinois: | 12.7% (354,987) |
25 to 29 minutes - Males:
| Burbank: | 5.5% (128) |
| Illinois: | 6.6% (186,300) |
30 to 34 minutes - Males:
| Burbank: | 17.4% (407) |
| Illinois: | 14.4% (404,047) |
35 to 39 minutes - Males:
| Burbank: | 1.7% (39) |
| Illinois: | 3.8% (105,284) |
40 to 44 minutes - Males:
| Burbank: | 4.4% (103) |
| Illinois: | 4.9% (137,110) |
45 to 59 minutes - Males:
| Burbank: | 11.0% (256) |
| Illinois: | 10.7% (299,173) |
60 to 89 minutes - Males:
| Burbank: | 13.0% (305) |
| Illinois: | 8.5% (238,838) |
90 or more minutes - Males:
| Burbank: | 1.1% (25) |
| Illinois: | 3.1% (85,766) |
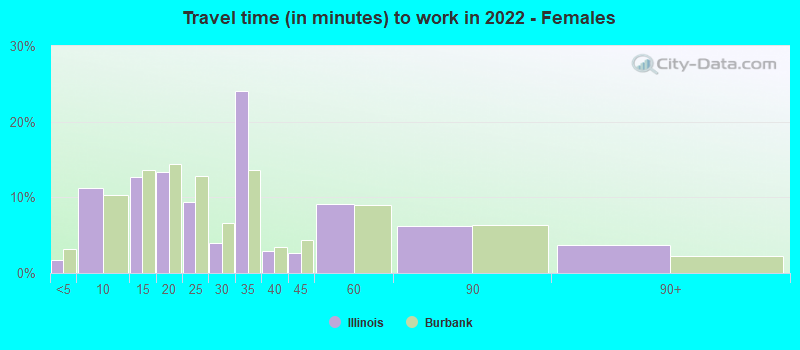
Less than 5 minutes - Females:
| Burbank: | 1.8% (51) |
| Illinois: | 3.2% (77,311) |
5 to 9 minutes - Females:
| Burbank: | 11.2% (319) |
| Illinois: | 10.3% (248,190) |
10 to 14 minutes - Females:
| Burbank: | 12.7% (362) |
| Illinois: | 13.6% (327,122) |
15 to 19 minutes - Females:
| Burbank: | 13.3% (379) |
| Illinois: | 14.4% (345,254) |
20 to 24 minutes - Females:
| Burbank: | 9.4% (268) |
| Illinois: | 12.8% (306,279) |
25 to 29 minutes - Females:
| Burbank: | 3.9% (112) |
| Illinois: | 6.6% (159,472) |
30 to 34 minutes - Females:
| Burbank: | 24.1% (686) |
| Illinois: | 13.6% (325,586) |
35 to 39 minutes - Females:
| Burbank: | 2.9% (84) |
| Illinois: | 3.5% (83,847) |
40 to 44 minutes - Females:
| Burbank: | 2.7% (77) |
| Illinois: | 4.4% (104,545) |
45 to 59 minutes - Females:
| Burbank: | 9.2% (261) |
| Illinois: | 9.0% (216,344) |
60 to 89 minutes - Females:
| Burbank: | 6.2% (177) |
| Illinois: | 6.4% (153,574) |
90 or more minutes - Females:
| Burbank: | 3.7% (105) |
| Illinois: | 2.2% (53,235) |
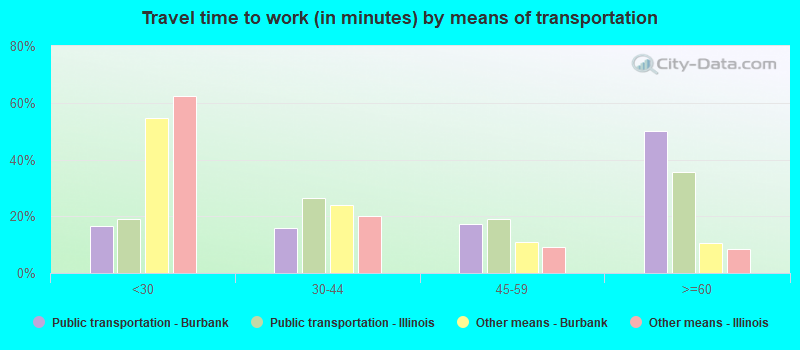
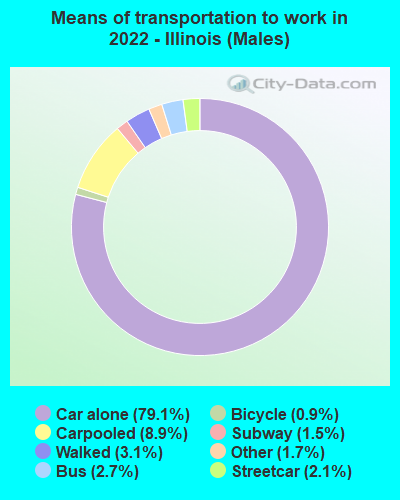
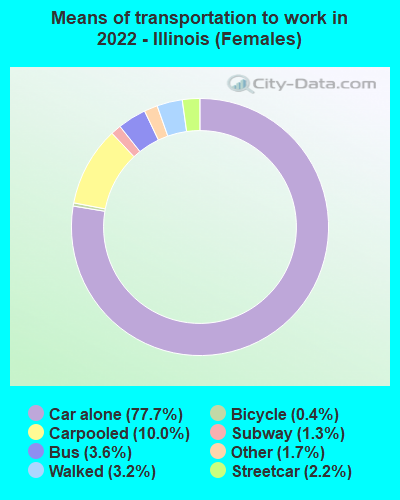
Means of transportation to work
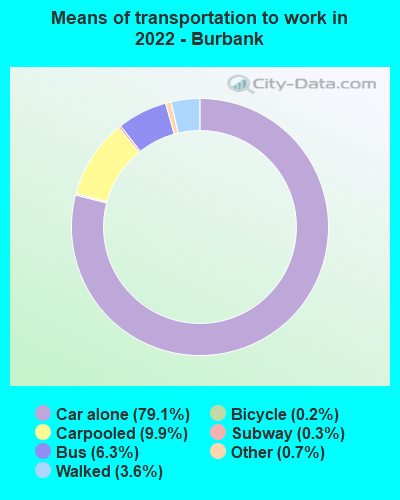
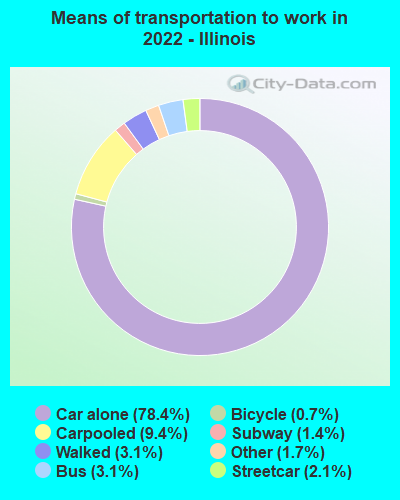
Drove car alone:
| Burbank: | 79.1% (4,352) |
| Illinois: | 78.4% (1,864,540) |
Carpooled:
| Burbank: | 9.9% (544) |
| Illinois: | 9.4% (240,564) |
Bus:
| Burbank: | 6.3% (345) |
| Illinois: | 3.1% (85,770) |
Long-distance train or commuter rail:
| Burbank: | 0.3% (18) |
| Illinois: | 1.4% (30,291) |
Bicycle:
| Burbank: | 0.2% (10) |
| Illinois: | 0.7% (8,982) |
Walked:
| Burbank: | 3.6% (199) |
| Illinois: | 3.1% (75,886) |
Other means:
| Burbank: | 0.7% (37) |
| Illinois: | 1.7% (40,328) |
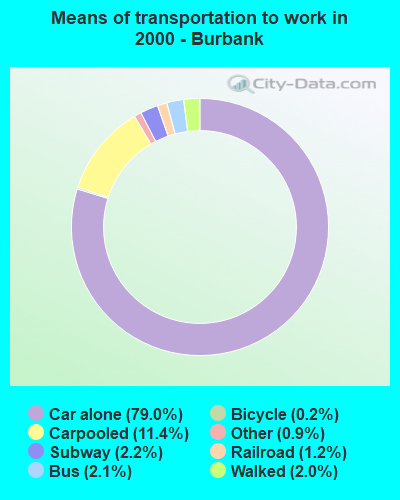
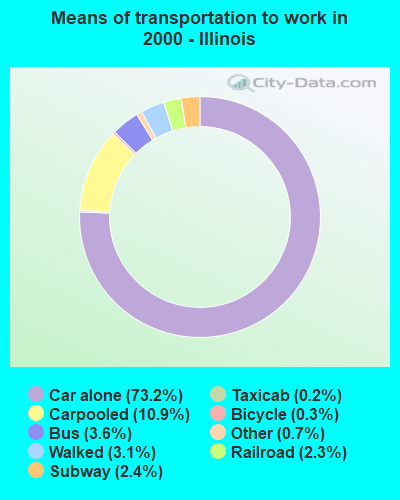
Drove car alone:
| Burbank: | 79.0% (10,271) |
| Illinois: | 73.2% (4,207,339) |
Carpooled:
| Burbank: | 11.4% (1,489) |
| Illinois: | 10.9% (625,411) |
Bus or trolley bus:
| Burbank: | 2.1% (278) |
| Illinois: | 3.6% (207,517) |
Streetcar or trolley car:
| Burbank: | 0.1% (10) |
| Illinois: | 0.1% (2,929) |
Subway or elevated:
| Burbank: | 2.2% (289) |
| Illinois: | 2.4% (137,996) |
Railroad:
| Burbank: | 1.2% (155) |
| Illinois: | 2.3% (134,567) |
Motorcycle:
| Burbank: | 0.0% (6) |
| Illinois: | 0.0% (2,510) |
Bicycle:
| Burbank: | 0.2% (21) |
| Illinois: | 0.3% (18,406) |
Walked:
| Burbank: | 2.0% (255) |
| Illinois: | 3.1% (180,119) |
Other means:
| Burbank: | 0.9% (119) |
| Illinois: | 0.7% (37,823) |
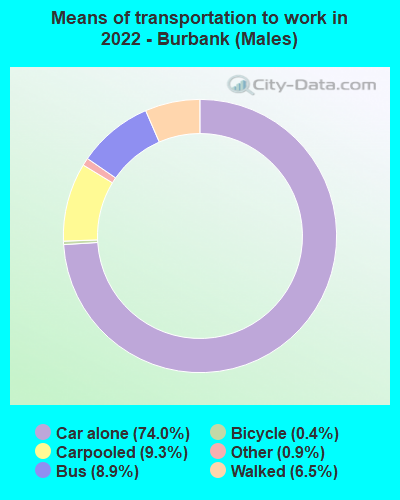
Drove car alone - Males:
| Burbank: | 74.0% (1,817) |
| Illinois: | 79.1% (1,864,540) |
Carpooled - Males:
| Burbank: | 9.3% (229) |
| Illinois: | 8.9% (240,564) |
Bus - Males:
| Burbank: | 8.9% (218) |
| Illinois: | 2.7% (85,770) |
Bicycle - Males:
| Burbank: | 0.4% (10) |
| Illinois: | 0.9% (8,982) |
Walked - Males:
| Burbank: | 6.5% (159) |
| Illinois: | 3.1% (75,886) |
Other means - Males:
| Burbank: | 0.9% (22) |
| Illinois: | 1.7% (40,328) |
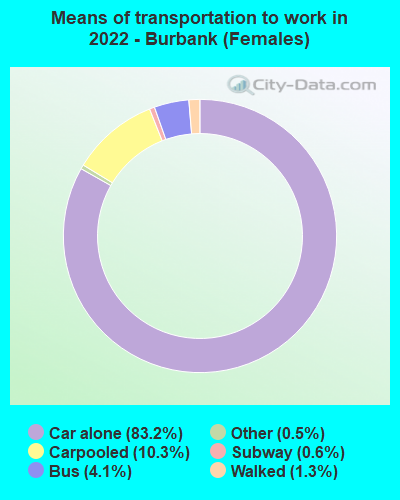
Drove car alone - Females:
| Burbank: | 83.2% (2,542) |
| Illinois: | 77.7% (1,864,540) |
Carpooled - Females:
| Burbank: | 10.3% (316) |
| Illinois: | 10.0% (240,564) |
Bus - Females:
| Burbank: | 4.1% (126) |
| Illinois: | 3.6% (85,770) |
Long-distance train or commuter rail - Females:
| Burbank: | 0.6% (18) |
| Illinois: | 1.3% (30,291) |
Walked - Females:
| Burbank: | 1.3% (39) |
| Illinois: | 3.2% (75,886) |
Other means - Females:
| Burbank: | 0.5% (15) |
| Illinois: | 1.7% (40,328) |
Private vehicle occupancy
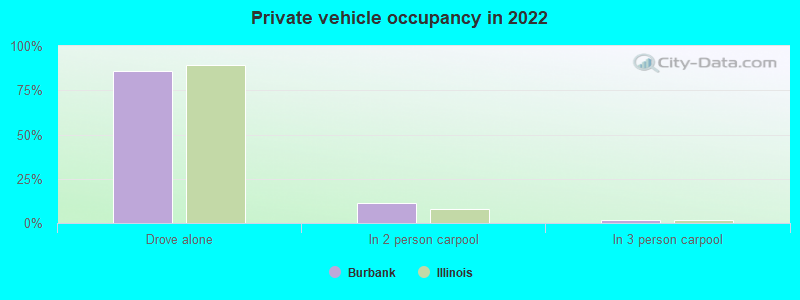
Drove alone:
| Burbank: | 85.9% (9,755) |
| Illinois: | 89.3% (4,089,987) |
In 2 person carpool:
| Burbank: | 11.3% (1,287) |
| Illinois: | 7.9% (361,887) |
In 3 person carpool:
| Burbank: | 1.8% (203) |
| Illinois: | 1.7% (77,481) |
In 4 person carpool:
| Burbank: | 0.7% (74) |
| Illinois: | 0.7% (31,281) |
In 5-6 person carpool:
| Burbank: | 0.2% (28) |
| Illinois: | 0.3% (13,813) |
In 7+ person carpool:
| Burbank: | 0.0% (5) |
| Illinois: | 0.1% (6,460) |
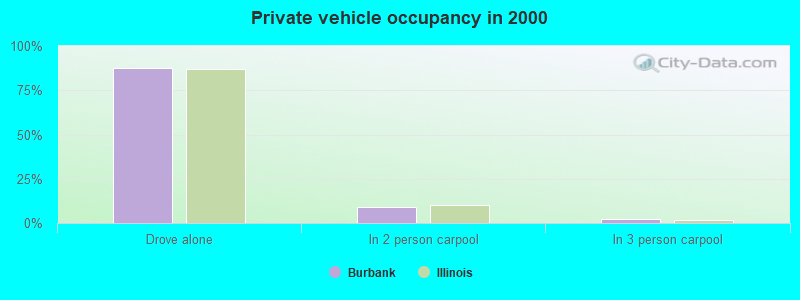
Drove alone:
| Burbank: | 87.3% (10,271) |
| Illinois: | 87.1% (4,207,339) |
In 2 person carpool:
| Burbank: | 9.0% (1,057) |
| Illinois: | 10.0% (484,652) |
In 3 person carpool:
| Burbank: | 2.1% (248) |
| Illinois: | 1.7% (84,139) |
In 4 person carpool:
| Burbank: | 0.6% (71) |
| Illinois: | 0.6% (30,865) |
In 5-6 person carpool:
| Burbank: | 0.7% (79) |
| Illinois: | 0.3% (15,487) |
In 7+ person carpool:
| Burbank: | 0.3% (34) |
| Illinois: | 0.2% (10,268) |
Class of workers
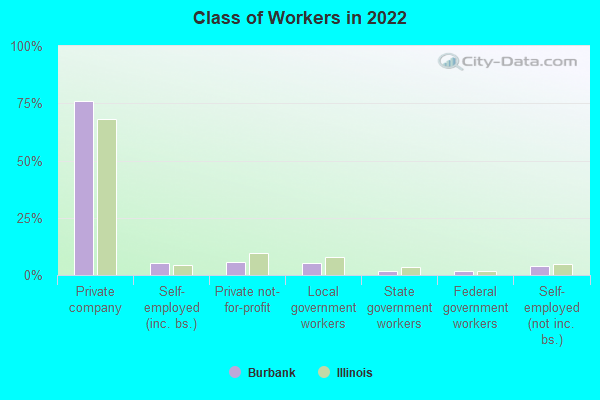
Employee of private company:
| Burbank: | 76.2% (10,226) |
| Illinois: | 68.3% (4,298,982) |
Self-employed in own incorporated business:
| Burbank: | 5.2% (693) |
| Illinois: | 4.3% (267,866) |
Private not-for-profit wage and salary workers:
| Burbank: | 5.5% (739) |
| Illinois: | 9.5% (597,909) |
Local government workers:
| Burbank: | 5.1% (680) |
| Illinois: | 7.8% (491,805) |
State government workers:
| Burbank: | 1.9% (253) |
| Illinois: | 3.3% (207,590) |
Federal government workers:
| Burbank: | 1.6% (212) |
| Illinois: | 1.9% (122,680) |
Self-employed workers in own not incorporated business:
| Burbank: | 4.1% (551) |
| Illinois: | 4.7% (295,989) |
Unpaid family workers:
| Burbank: | 0.5% (67) |
| Illinois: | 0.2% (10,986) |
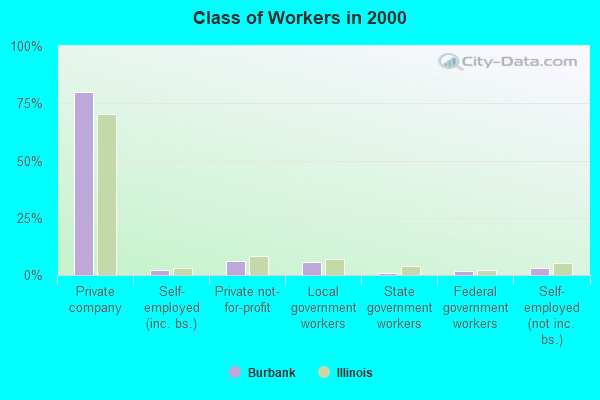
Employee of private company:
| Burbank: | 79.9% (10,650) |
| Illinois: | 70.3% (4,102,786) |
Self-employed in own incorporated business:
| Burbank: | 2.4% (315) |
| Illinois: | 3.2% (184,981) |
Private not-for-profit wage and salary workers:
| Burbank: | 6.3% (834) |
| Illinois: | 8.3% (484,163) |
Local government workers:
| Burbank: | 5.5% (735) |
| Illinois: | 6.8% (395,132) |
State government workers:
| Burbank: | 0.9% (122) |
| Illinois: | 3.8% (220,995) |
Federal government workers:
| Burbank: | 1.8% (238) |
| Illinois: | 2.1% (121,776) |
Self-employed workers in own not incorporated business:
| Burbank: | 2.9% (389) |
| Illinois: | 5.3% (307,691) |
Unpaid family workers:
| Burbank: | 0.3% (38) |
| Illinois: | 0.3% (15,661) |
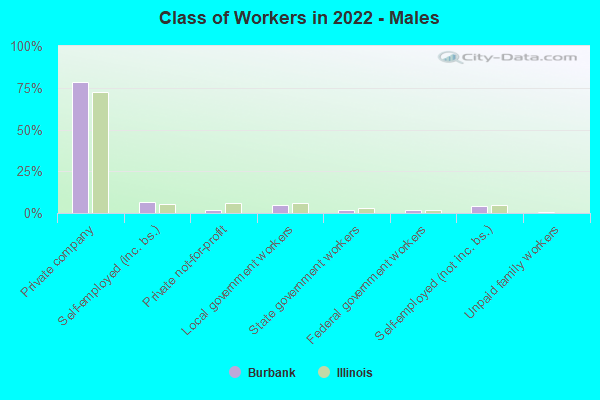
Employee of private company - Males:
| Burbank: | 78.4% (5,927) |
| Illinois: | 72.3% (2,390,375) |
Self-employed in own incorporated business - Males:
| Burbank: | 6.7% (506) |
| Illinois: | 5.4% (179,821) |
Private not-for-profit wage and salary workers - Males:
| Burbank: | 1.6% (120) |
| Illinois: | 6.2% (205,628) |
Local government workers - Males:
| Burbank: | 4.7% (358) |
| Illinois: | 5.9% (193,630) |
State government workers - Males:
| Burbank: | 1.9% (143) |
| Illinois: | 3.0% (98,934) |
Federal government workers - Males:
| Burbank: | 1.7% (126) |
| Illinois: | 2.0% (64,842) |
Self-employed workers in own not incorporated business - Males:
| Burbank: | 4.2% (316) |
| Illinois: | 5.1% (167,665) |
Unpaid family workers - Males:
| Burbank: | 0.9% (67) |
| Illinois: | 0.2% (6,269) |
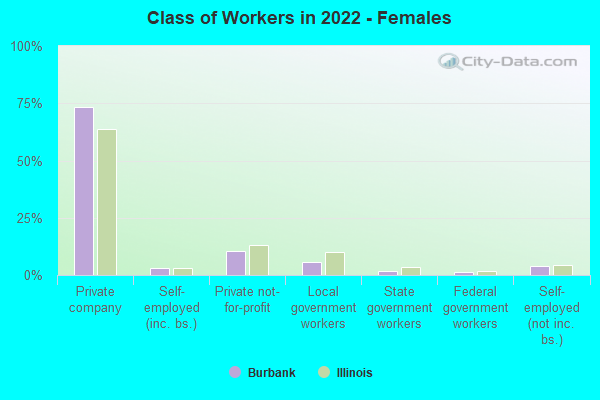
Employee of private company - Females:
| Burbank: | 73.4% (4,299) |
| Illinois: | 63.9% (1,908,607) |
Self-employed in own incorporated business - Females:
| Burbank: | 3.2% (187) |
| Illinois: | 2.9% (88,045) |
Private not-for-profit wage and salary workers - Females:
| Burbank: | 10.6% (618) |
| Illinois: | 13.1% (392,281) |
Local government workers - Females:
| Burbank: | 5.5% (323) |
| Illinois: | 10.0% (298,175) |
State government workers - Females:
| Burbank: | 1.9% (109) |
| Illinois: | 3.6% (108,656) |
Federal government workers - Females:
| Burbank: | 1.5% (86) |
| Illinois: | 1.9% (57,838) |
Self-employed workers in own not incorporated business - Females:
| Burbank: | 4.0% (235) |
| Illinois: | 4.3% (128,324) |