Work and Jobs in Burnside, Pennsylvania (PA) Detailed Stats
Occupations, Industries, Unemployment, Workers, Commute
Settings
X


Discuss Burnside, Pennsylvania work on our local forum with over 2,400,000 registered users
Latest news about work in Burnside, PA collected exclusively by city-data.com from local newspapers, TV, and radio stations
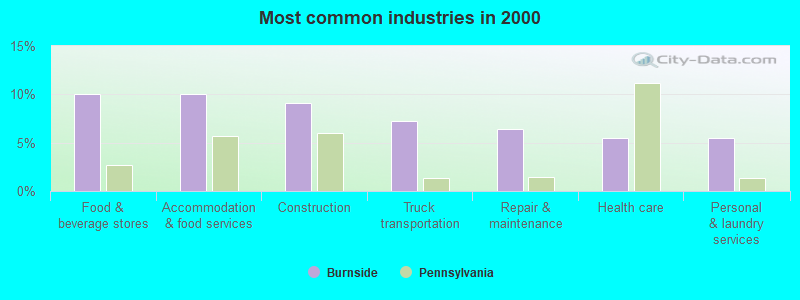
The most common industries in Burnside are: Food & beverage stores (10.0% of civilian employees), Accommodation & food services (10.0% of civilian employees), Construction (9.1% of civilian employees). 31.2% of workers work in Clearfield County and 12.5% of all workers work at home. 81.2% of workers are employees of private companies, which is 16.7% greater than the rate of 67.7% across the entire state of Pennsylvania.
Whole page based on the data from 2000 / 2022 when the population of Burnside, Pennsylvania was 283 / 159
Whole page based on the data from 2000 / 2022 when the population of Burnside, Pennsylvania was 283 / 159
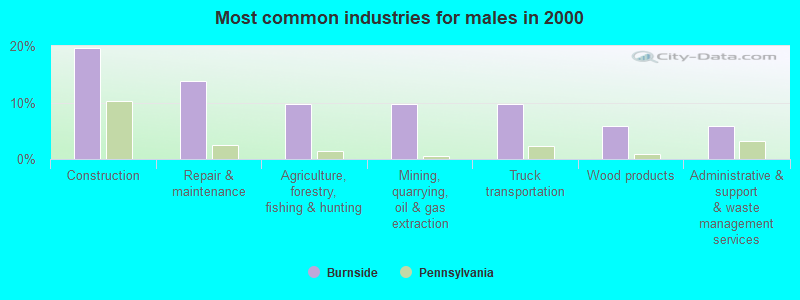
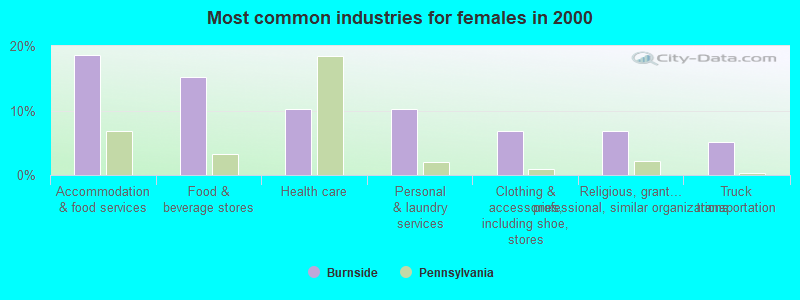
Most common industries
Most common industries | |||
|---|---|---|---|
Industry | All | Males | Females |
| Food and beverage stores | 10.0% (11) | 3.9% (2) | 15.3% (9) |
| Accommodation and food services | 10.0% (11) | 0.0% (0) | 18.6% (11) |
| Construction | 9.1% (10) | 19.6% (10) | 0.0% (0) |
| Truck transportation | 7.3% (8) | 9.8% (5) | 5.1% (3) |
| Repair and maintenance | 6.4% (7) | 13.7% (7) | 0.0% (0) |
| Health care | 5.5% (6) | 0.0% (0) | 10.2% (6) |
| Personal and laundry services | 5.5% (6) | 0.0% (0) | 10.2% (6) |
| Agriculture, forestry, fishing and hunting | 4.5% (5) | 9.8% (5) | 0.0% (0) |
| Mining, quarrying, and oil and gas extraction | 4.5% (5) | 9.8% (5) | 0.0% (0) |
| Clothing and accessories, including shoe, stores | 3.6% (4) | 0.0% (0) | 6.8% (4) |
| Educational services | 3.6% (4) | 2.0% (1) | 5.1% (3) |
| Religious, grantmaking, civic, professional, and similar organizations | 3.6% (4) | 0.0% (0) | 6.8% (4) |
| Wood products | 2.7% (3) | 5.9% (3) | 0.0% (0) |
| Administrative and support and waste management services | 2.7% (3) | 5.9% (3) | 0.0% (0) |
| Recyclable material merchant wholesalers | 1.8% (2) | 3.9% (2) | 0.0% (0) |
| Metal and metal products | 1.8% (2) | 3.9% (2) | 0.0% (0) |
| Lumber and other construction materials merchant wholesalers | 1.8% (2) | 0.0% (0) | 3.4% (2) |
| Miscellaneous manufacturing | 1.8% (2) | 0.0% (0) | 3.4% (2) |
| Department and other general merchandise stores | 1.8% (2) | 3.9% (2) | 0.0% (0) |
| Publishing, and motion picture and sound recording industries | 1.8% (2) | 0.0% (0) | 3.4% (2) |
| Broadcasting and telecommunications | 1.8% (2) | 3.9% (2) | 0.0% (0) |
| Finance and insurance | 1.8% (2) | 0.0% (0) | 3.4% (2) |
| Real estate and rental and leasing | 1.8% (2) | 0.0% (0) | 3.4% (2) |
| Arts, entertainment, and recreation | 1.8% (2) | 3.9% (2) | 0.0% (0) |
| Private households | 1.8% (2) | 0.0% (0) | 3.4% (2) |
| Social assistance | 0.9% (1) | 0.0% (0) | 1.7% (1) |
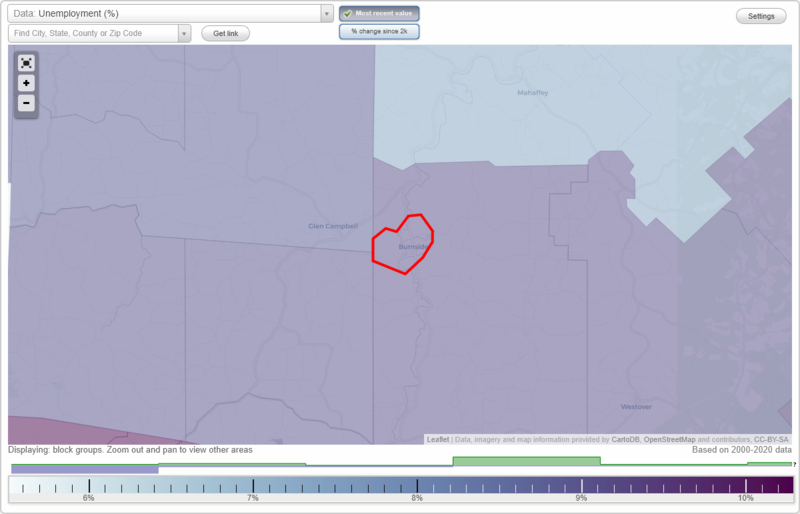
Unemployment in Burnside
- Unemployment by race in 2022
- Unemployment rate for White non-Hispanic residents
- 33.0%Males
- Unemployment by race in 2000
- Unemployment rate for White non-Hispanic residents
- 20.3%Males
Time leaving home to go to work
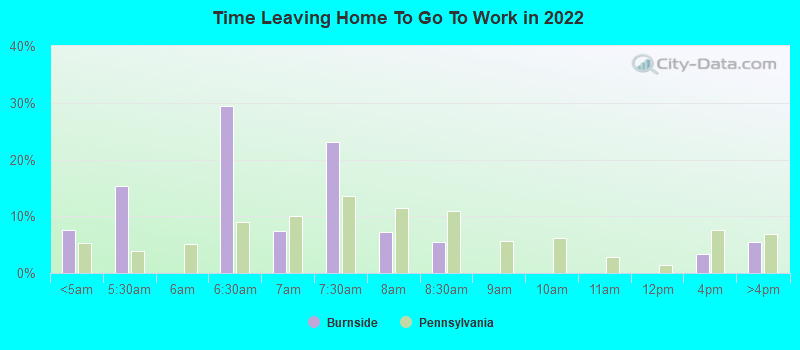
12:00 a.m. to 4:59 a.m.:
| Burnside: | 7.6% (4) |
| Pennsylvania: | 5.2% (278,903) |
5:00 a.m. to 5:29 a.m.:
| Burnside: | 15.4% (9) |
| Pennsylvania: | 3.9% (210,362) |
6:00 a.m. to 6:29 a.m.:
| Burnside: | 29.4% (17) |
| Pennsylvania: | 9.0% (480,402) |
6:30 a.m. to 6:59 a.m.:
| Burnside: | 7.4% (4) |
| Pennsylvania: | 10.0% (532,059) |
7:00 a.m. to 7:29 a.m.:
| Burnside: | 23.0% (13) |
| Pennsylvania: | 13.6% (726,980) |
7:30 a.m. to 7:59 a.m.:
| Burnside: | 7.2% (4) |
| Pennsylvania: | 11.5% (611,627) |
8:00 a.m. to 8:29 a.m.:
| Burnside: | 5.4% (3) |
| Pennsylvania: | 11.0% (585,665) |
12:00 p.m. to 3:59 p.m.:
| Burnside: | 3.3% (2) |
| Pennsylvania: | 7.6% (407,255) |
4:00 p.m. to 11:59 p.m.:
| Burnside: | 5.5% (3) |
| Pennsylvania: | 6.9% (369,524) |
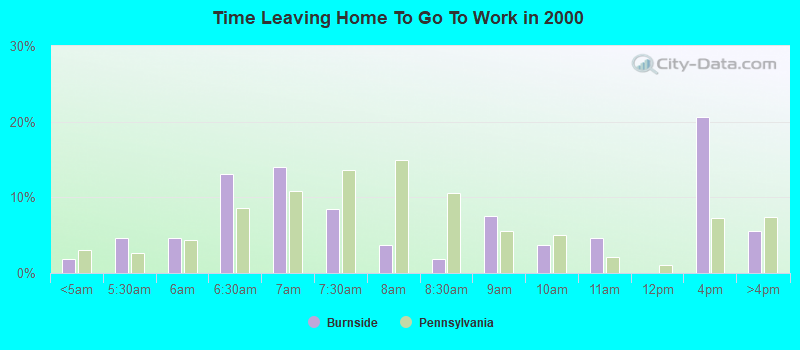
<5am:
| Burnside: | 1.9% (2) |
| Pennsylvania: | 3.1% (172,304) |
5:30am:
| Burnside: | 4.7% (5) |
| Pennsylvania: | 2.7% (150,168) |
6am:
| Burnside: | 4.7% (5) |
| Pennsylvania: | 4.4% (245,004) |
6:30am:
| Burnside: | 13.1% (14) |
| Pennsylvania: | 8.6% (478,636) |
7am:
| Burnside: | 14.0% (15) |
| Pennsylvania: | 10.8% (599,808) |
7:30am:
| Burnside: | 8.4% (9) |
| Pennsylvania: | 13.7% (759,372) |
8am:
| Burnside: | 3.7% (4) |
| Pennsylvania: | 14.9% (826,968) |
8:30am:
| Burnside: | 1.9% (2) |
| Pennsylvania: | 10.6% (588,440) |
9am:
| Burnside: | 7.5% (8) |
| Pennsylvania: | 5.5% (304,765) |
10am:
| Burnside: | 3.7% (4) |
| Pennsylvania: | 5.1% (280,812) |
11am:
| Burnside: | 4.7% (5) |
| Pennsylvania: | 2.1% (114,676) |
4pm:
| Burnside: | 20.6% (22) |
| Pennsylvania: | 7.3% (404,775) |
>4pm:
| Burnside: | 5.6% (6) |
| Pennsylvania: | 7.3% (408,070) |
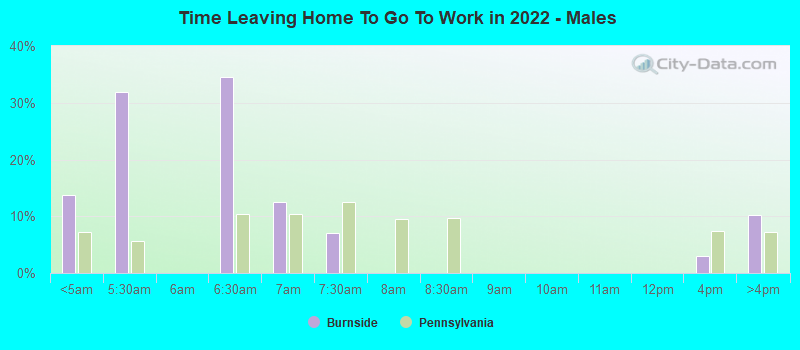
12:00 a.m. to 4:59 a.m. - Males:
| Burnside: | 13.8% (4) |
| Pennsylvania: | 7.2% (203,028) |
5:00 a.m. to 5:29 a.m. - Males:
| Burnside: | 31.9% (10) |
| Pennsylvania: | 5.6% (157,829) |
6:00 a.m. to 6:29 a.m. - Males:
| Burnside: | 34.6% (11) |
| Pennsylvania: | 10.5% (296,669) |
6:30 a.m. to 6:59 a.m. - Males:
| Burnside: | 12.5% (4) |
| Pennsylvania: | 10.4% (293,727) |
7:00 a.m. to 7:29 a.m. - Males:
| Burnside: | 7.0% (2) |
| Pennsylvania: | 12.6% (356,257) |
12:00 p.m. to 3:59 p.m. - Males:
| Burnside: | 3.0% (1) |
| Pennsylvania: | 7.4% (210,601) |
4:00 p.m. to 11:59 p.m. - Males:
| Burnside: | 10.1% (3) |
| Pennsylvania: | 7.1% (202,203) |
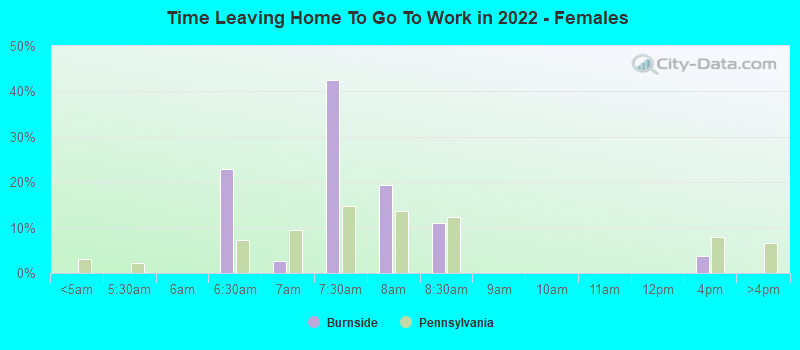
6:00 a.m. to 6:29 a.m. - Females:
| Burnside: | 22.9% (6) |
| Pennsylvania: | 7.4% (183,733) |
6:30 a.m. to 6:59 a.m. - Females:
| Burnside: | 2.6% (1) |
| Pennsylvania: | 9.5% (238,332) |
7:00 a.m. to 7:29 a.m. - Females:
| Burnside: | 42.4% (11) |
| Pennsylvania: | 14.8% (370,723) |
7:30 a.m. to 7:59 a.m. - Females:
| Burnside: | 19.5% (5) |
| Pennsylvania: | 13.7% (342,732) |
8:00 a.m. to 8:29 a.m. - Females:
| Burnside: | 10.9% (3) |
| Pennsylvania: | 12.4% (310,699) |
12:00 p.m. to 3:59 p.m. - Females:
| Burnside: | 3.7% (1) |
| Pennsylvania: | 7.9% (196,654) |
Travel time to work
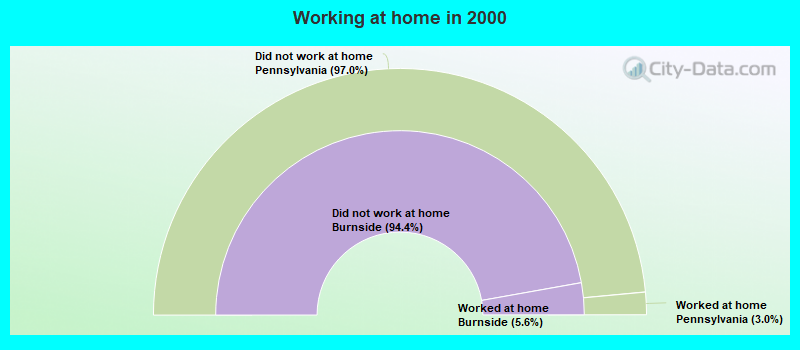
Percentage of workers working in this county: 31.2%
Number of people working at home: 8 (12.5% of all workers)
Number of people working at home: 8 (12.5% of all workers)
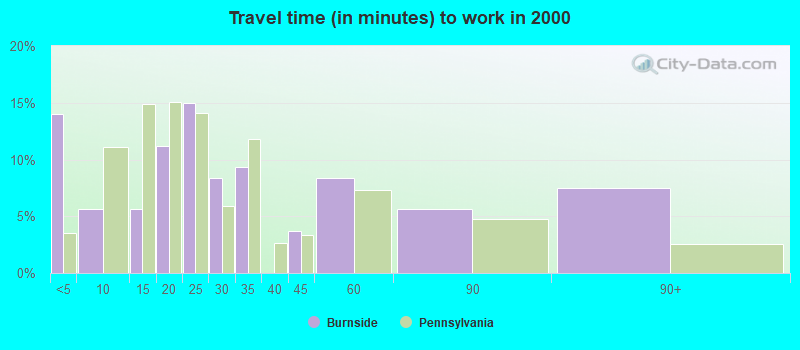
Less than 5 minutes:
| Burnside: | 14.0% (15) |
| Pennsylvania: | 3.5% (196,492) |
5 to 9 minutes:
| Burnside: | 5.6% (6) |
| Pennsylvania: | 11.1% (615,919) |
10 to 14 minutes:
| Burnside: | 5.6% (6) |
| Pennsylvania: | 14.9% (825,199) |
15 to 19 minutes:
| Burnside: | 11.2% (12) |
| Pennsylvania: | 15.0% (836,006) |
20 to 24 minutes:
| Burnside: | 15.0% (16) |
| Pennsylvania: | 14.1% (782,790) |
25 to 29 minutes:
| Burnside: | 8.4% (9) |
| Pennsylvania: | 5.9% (327,459) |
30 to 34 minutes:
| Burnside: | 9.3% (10) |
| Pennsylvania: | 11.8% (655,811) |
40 to 44 minutes:
| Burnside: | 3.7% (4) |
| Pennsylvania: | 3.4% (187,483) |
45 to 59 minutes:
| Burnside: | 8.4% (9) |
| Pennsylvania: | 7.3% (407,516) |
60 to 89 minutes:
| Burnside: | 5.6% (6) |
| Pennsylvania: | 4.8% (265,759) |
90 or more minutes:
| Burnside: | 7.5% (8) |
| Pennsylvania: | 2.6% (142,325) |
Means of transportation to work
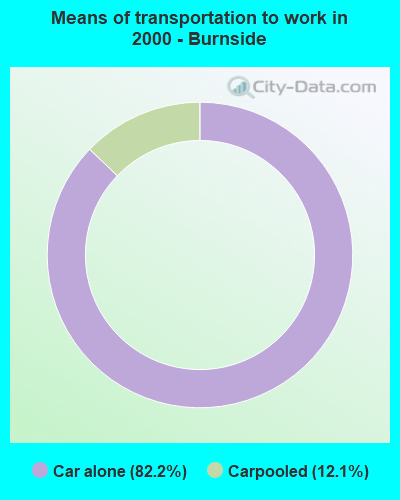

Drove car alone:
| Burnside: | 82.2% (88) |
| Pennsylvania: | 76.5% (4,247,836) |
Carpooled:
| Burnside: | 12.1% (13) |
| Pennsylvania: | 10.4% (577,364) |
Private vehicle occupancy
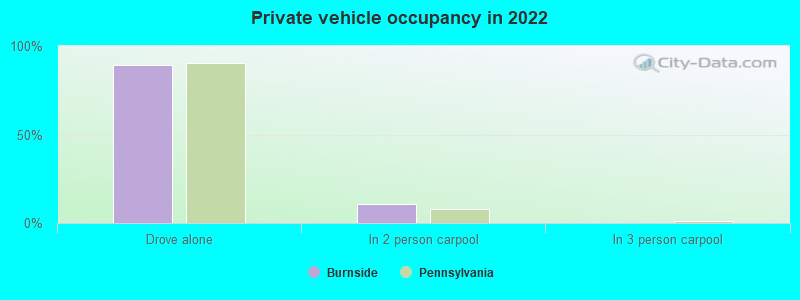
Drove alone:
| Burnside: | 89.2% (49) |
| Pennsylvania: | 90.2% (4,322,003) |
In 2 person carpool:
| Burnside: | 10.8% (6) |
| Pennsylvania: | 7.7% (367,639) |
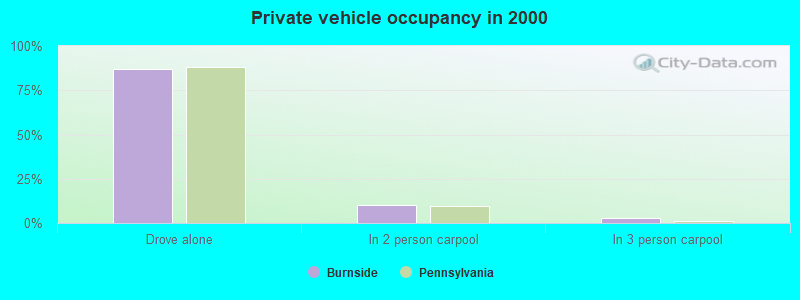
Drove alone:
| Burnside: | 87.1% (88) |
| Pennsylvania: | 88.0% (4,247,836) |
In 2 person carpool:
| Burnside: | 9.9% (10) |
| Pennsylvania: | 9.7% (470,174) |
In 3 person carpool:
| Burnside: | 3.0% (3) |
| Pennsylvania: | 1.4% (67,610) |
Class of workers
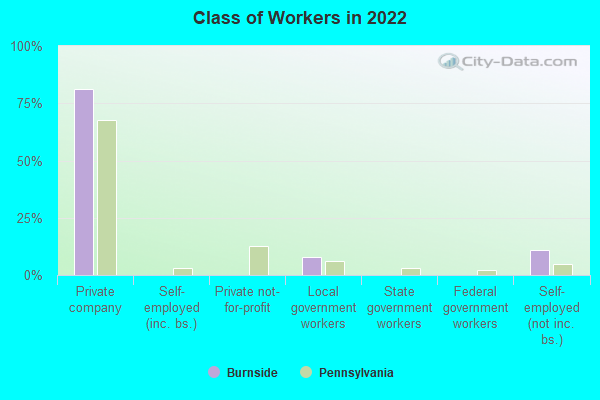
Employee of private company:
| Burnside: | 81.2% (54) |
| Pennsylvania: | 67.7% (4,333,849) |
Local government workers:
| Burnside: | 7.8% (5) |
| Pennsylvania: | 6.2% (397,120) |
Self-employed workers in own not incorporated business:
| Burnside: | 10.9% (7) |
| Pennsylvania: | 5.0% (318,118) |
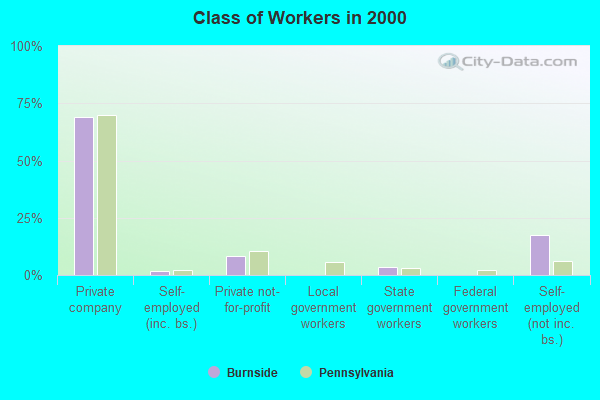
Employee of private company:
| Burnside: | 69.1% (76) |
| Pennsylvania: | 69.7% (3,942,119) |
Self-employed in own incorporated business:
| Burnside: | 1.8% (2) |
| Pennsylvania: | 2.4% (134,871) |
Private not-for-profit wage and salary workers:
| Burnside: | 8.2% (9) |
| Pennsylvania: | 10.3% (580,382) |
State government workers:
| Burnside: | 3.6% (4) |
| Pennsylvania: | 3.2% (182,232) |
Self-employed workers in own not incorporated business:
| Burnside: | 17.3% (19) |
| Pennsylvania: | 6.0% (339,631) |
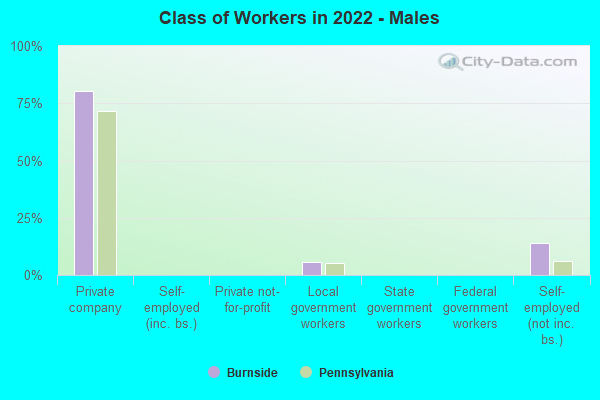
Employee of private company - Males:
| Burnside: | 80.6% (30) |
| Pennsylvania: | 71.5% (2,388,579) |
Local government workers - Males:
| Burnside: | 5.6% (2) |
| Pennsylvania: | 5.0% (168,310) |
Self-employed workers in own not incorporated business - Males:
| Burnside: | 13.9% (5) |
| Pennsylvania: | 6.0% (199,421) |

Employee of private company - Females:
| Burnside: | 82.1% (24) |
| Pennsylvania: | 63.5% (1,945,270) |
Local government workers - Females:
| Burnside: | 10.7% (3) |
| Pennsylvania: | 7.5% (228,810) |
Self-employed workers in own not incorporated business - Females:
| Burnside: | 7.1% (2) |
| Pennsylvania: | 3.9% (118,697) |