Work and Jobs in Calhoun, Tennessee (TN) Detailed Stats
Data:
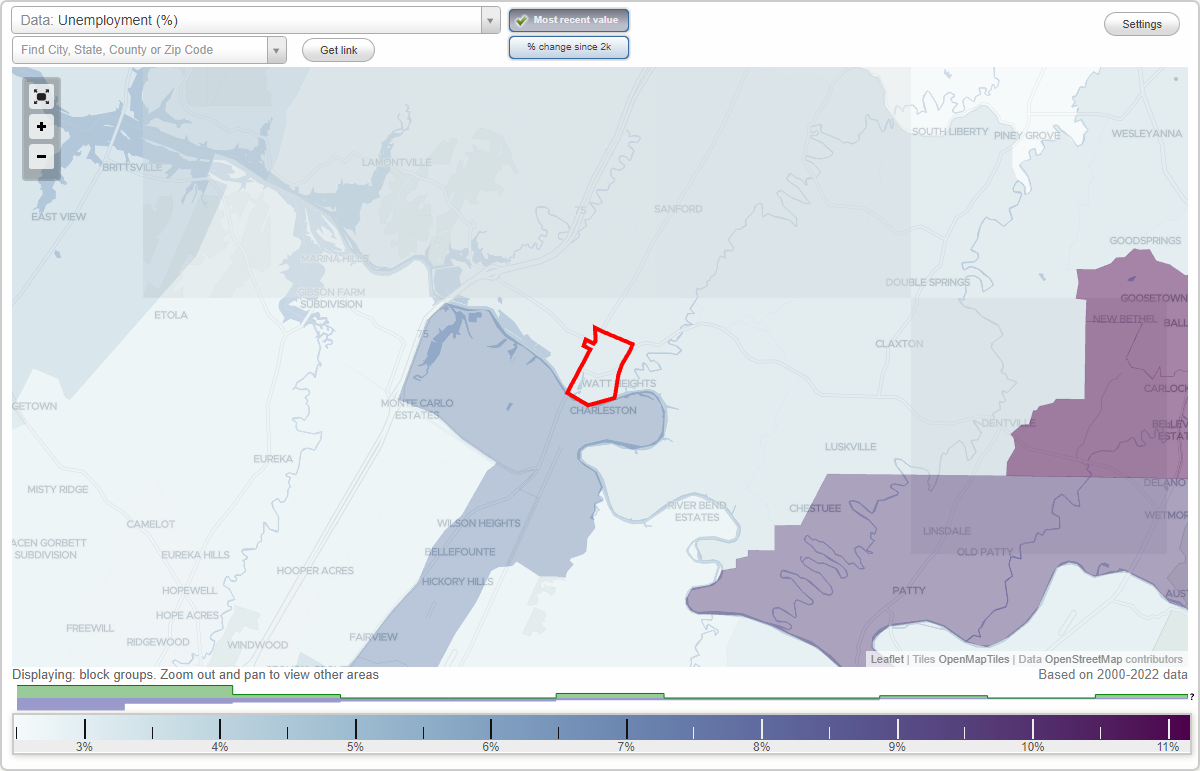
Unemployment (%)
Unemployment (% change since 2000)
Unemployment (%) - White
Unemployment (% change since 2000) - White
Unemployment (%) - Black or African American
Unemployment (% change since 2000) - Black or African American
Unemployment (%) - Asian
Unemployment (% change since 2000) - Asian
Unemployment (%) - Hispanic or Latino
Unemployment (% change since 2000) - Hispanic or Latino
Unemployment (%) - American Indian and Alaska Native
Unemployment (% change since 2000) - American Indian and Alaska Native
Unemployment (%) - Multirace
Unemployment (% change since 2000) - Multirace
Unemployment (%) - Other Race
Unemployment (% change since 2000) - Other Race
Industry diversity
Most Common Industries - Agriculture, forestry, fishing and hunting, and mining (%)
Most Common Industries - Agriculture, forestry, fishing and hunting (%)
Most Common Industries - Mining, quarrying, and oil and gas extraction (%)
Most Common Industries - Construction (%)
Most Common Industries - Manufacturing (%)
Most Common Industries - Wholesale trade (%)
Most Common Industries - Retail trade (%)
Most Common Industries - Transportation and warehousing, and utilities (%)
Most Common Industries - Transportation and warehousing (%)
Most Common Industries - Utilities (%)
Most Common Industries - Information (%)
Most Common Industries - Finance and insurance, and real estate and rental and leasing (%)
Most Common Industries - Finance and insurance (%)
Most Common Industries - Real estate and rental and leasing (%)
Most Common Industries - Professional, scientific, and management, and administrative and waste management services (%)
Most Common Industries - Professional, scientific, and technical services (%)
Most Common Industries - Management of companies and enterprises (%)
Most Common Industries - Administrative and support and waste management services (%)
Most Common Industries - Educational services, and health care and social assistance (%)
Most Common Industries - Educational services (%)
Most Common Industries - Health care and social assistance (%)
Most Common Industries - Arts, entertainment, and recreation, and accommodation and food services (%)
Most Common Industries - Arts, entertainment, and recreation (%)
Most Common Industries - Accommodation and food services (%)
Most Common Industries - Other services, except public administration (%)
Most Common Industries - Public administration (%)
Occupation diversity
Most Common Occupations - Management, business, science, and arts occupations (%)
Most Common Occupations - Management, business, and financial occupations (%)
Most Common Occupations - Management occupations (%)
Most Common Occupations - Business and financial operations occupations (%)
Most Common Occupations - Computer, engineering, and science occupations (%)
Most Common Occupations - Computer and mathematical occupations (%)
Most Common Occupations - Architecture and engineering occupations (%)
Most Common Occupations - Life, physical, and social science occupations (%)
Most Common Occupations - Education, legal, community service, arts, and media occupations (%)
Most Common Occupations - Community and social service occupations (%)
Most Common Occupations - Legal occupations (%)
Most Common Occupations - Education, training, and library occupations (%)
Most Common Occupations - Arts, design, entertainment, sports, and media occupations (%)
Most Common Occupations - Healthcare practitioners and technical occupations (%)
Most Common Occupations - Health diagnosing and treating practitioners and other technical occupations (%)
Most Common Occupations - Health technologists and technicians (%)
Most Common Occupations - Service occupations (%)
Most Common Occupations - Healthcare support occupations (%)
Most Common Occupations - Protective service occupations (%)
Most Common Occupations - Fire fighting and prevention, and other protective service workers including supervisors (%)
Most Common Occupations - Law enforcement workers including supervisors (%)
Most Common Occupations - Food preparation and serving related occupations (%)
Most Common Occupations - Building and grounds cleaning and maintenance occupations (%)
Most Common Occupations - Personal care and service occupations (%)
Most Common Occupations - Sales and office occupations (%)
Most Common Occupations - Sales and related occupations (%)
Most Common Occupations - Office and administrative support occupations (%)
Most Common Occupations - Natural resources, construction, and maintenance occupations (%)
Most Common Occupations - Farming, fishing, and forestry occupations (%)
Most Common Occupations - Construction and extraction occupations (%)
Most Common Occupations - Installation, maintenance, and repair occupations (%)
Most Common Occupations - Production, transportation, and material moving occupations (%)
Most Common Occupations - Production occupations (%)
Most Common Occupations - Transportation occupations (%)
Most Common Occupations - Material moving occupations (%)
Private vehicle occupancy - Drove alone (% change since 2000)
Private vehicle occupancy - Carpooled (%)
Private vehicle occupancy - Carpooled (% change since 2000)
Private vehicle occupancy - In 2-person carpool (%)
Private vehicle occupancy - In 2-person carpool (% change since 2000)
Private vehicle occupancy - In 3-person carpool (%)
Private vehicle occupancy - In 3-person carpool (% change since 2000)
Private vehicle occupancy - In 4-person carpool (%)
Private vehicle occupancy - In 4-person carpool (% change since 2000)
Private vehicle occupancy - In 5- or 6-person carpool (%)
Private vehicle occupancy - In 5- or 6-person carpool (% change since 2000)
Private vehicle occupancy - In 7-or-more-person carpool (%)
Private vehicle occupancy - In 7-or-more-person carpool (% change since 2000)
Time Leaving Home To Go To Work - 12:00 a.m. to 4:59 a.m. (%)
Time Leaving Home To Go To Work - 12:00 a.m. to 4:59 a.m. (% change since 2000)
Time Leaving Home To Go To Work - 5:00 a.m. to 5:59 a.m. (%)
Time Leaving Home To Go To Work - 5:00 a.m. to 5:59 a.m. (% change since 2000)
Time Leaving Home To Go To Work - 6:00 a.m. to 6:59 a.m. (%)
Time Leaving Home To Go To Work - 6:00 a.m. to 6:59 a.m. (% change since 2000)
Time Leaving Home To Go To Work - 7:00 a.m. to 7:59 a.m. (%)
Time Leaving Home To Go To Work - 7:00 a.m. to 7:59 a.m. (% change since 2000)
Time Leaving Home To Go To Work - 8:00 a.m. to 8:59 a.m. (%)
Time Leaving Home To Go To Work - 8:00 a.m. to 8:59 a.m. (% change since 2000)
Time Leaving Home To Go To Work - 9:00 a.m. to 9:59 a.m. (%)
Time Leaving Home To Go To Work - 9:00 a.m. to 9:59 a.m. (% change since 2000)
Time Leaving Home To Go To Work - 10:00 a.m. to 10:59 a.m. (%)
Time Leaving Home To Go To Work - 10:00 a.m. to 10:59 a.m. (% change since 2000)
Time Leaving Home To Go To Work - 11:00 a.m. to 11:59 a.m. (%)
Time Leaving Home To Go To Work - 11:00 a.m. to 11:59 a.m. (% change since 2000)
Time Leaving Home To Go To Work - 12:00 p.m. to 3:59 p.m. (%)
Time Leaving Home To Go To Work - 12:00 p.m. to 3:59 p.m. (% change since 2000)
Time Leaving Home To Go To Work - 4:00 p.m. to 11:59 p.m. (%)
Time Leaving Home To Go To Work - 4:00 p.m. to 11:59 p.m. (% change since 2000)
Class of Workers - Employee of private company (%)
Class of Workers - Employee of private company (% change since 2000)
Class of Workers - Self-employed in own incorporated business (%)
Class of Workers - Self-employed in own incorporated business (% change since 2000)
Class of Workers - Private not-for-profit wage and salary workers (%)
Class of Workers - Private not-for-profit wage and salary workers (% change since 2000)
Class of Workers - Local government workers (%)
Class of Workers - Local government workers (% change since 2000)
Class of Workers - State government workers (%)
Class of Workers - State government workers (% change since 2000)
Class of Workers - Federal government workers (%)
Class of Workers - Federal government workers (% change since 2000)
Class of Workers - Self-employed workers in own not incorporated business and Unpaid family workers (%)
Class of Workers - Self-employed workers in own not incorporated business and Unpaid family workers (% change since 2000)
Means of transportation to work - Drove car alone (%)
Means of transportation to work - Drove car alone (% change since 2000)
Means of transportation to work - Carpooled (%)
Means of transportation to work - Carpooled (% change since 2000)
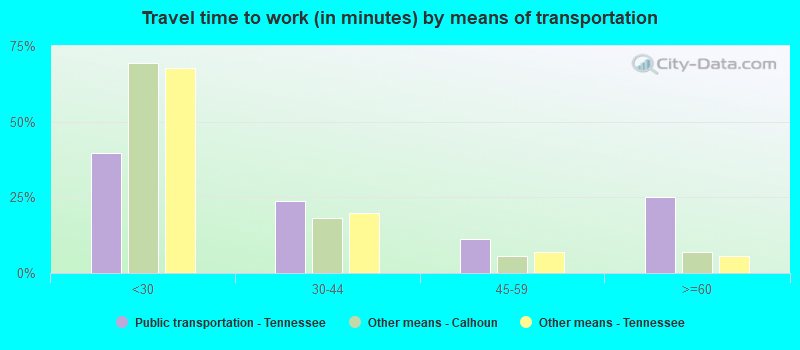
Means of transportation to work - Public transportation (%)
Means of transportation to work - Public transportation (% change since 2000)
Means of transportation to work - Bus or trolley bus (%)
Means of transportation to work - Bus or trolley bus (% change since 2000)
Means of transportation to work - Streetcar or trolley car (%)
Means of transportation to work - Streetcar or trolley car (% change since 2000)
Means of transportation to work - Subway or elevated (%)
Means of transportation to work - Subway or elevated (% change since 2000)
Means of transportation to work - Railroad (%)
Means of transportation to work - Railroad (% change since 2000)
Means of transportation to work - Ferryboat (%)
Means of transportation to work - Ferryboat (% change since 2000)
Means of transportation to work - Taxicab (%)
Means of transportation to work - Taxicab (% change since 2000)
Means of transportation to work - Motorcycle (%)
Means of transportation to work - Motorcycle (% change since 2000)
Means of transportation to work - Bicycle (%)
Means of transportation to work - Bicycle (% change since 2000)
Means of transportation to work - Walked (%)
Means of transportation to work - Walked (% change since 2000)
Means of transportation to work - Other means (%)
Means of transportation to work - Other means (% change since 2000)
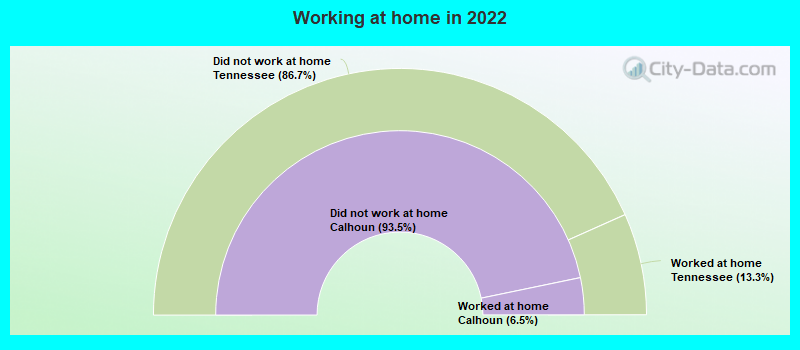
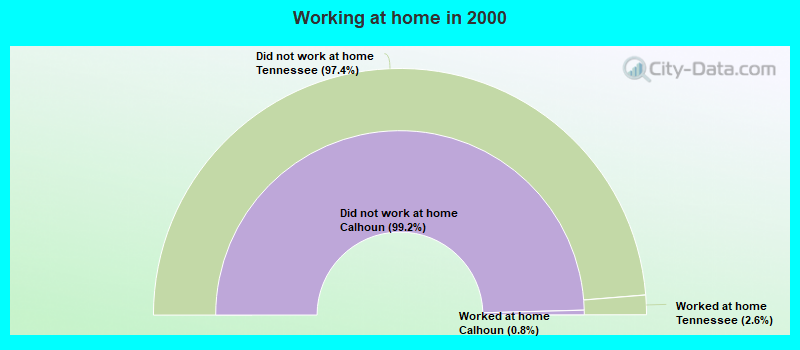
Working at home (%)
Working at home (% change since 2000)
Travel time to work - Less than 5 minutes (%)
Travel time to work - Less than 5 minutes (% change since 2000)
Travel time to work - 5 to 9 minutes (%)
Travel time to work - 5 to 9 minutes (% change since 2000)
Travel time to work - 10 to 19 minutes (%)
Travel time to work - 10 to 19 minutes (% change since 2000)
Travel time to work - 20 to 29 minutes (%)
Travel time to work - 20 to 29 minutes (% change since 2000)
Travel time to work - 30 to 39 minutes (%)
Travel time to work - 30 to 39 minutes (% change since 2000)
Travel time to work - 40 to 59 minutes (%)
Travel time to work - 40 to 59 minutes (% change since 2000)
Travel time to work - 60 to 89 minutes (%)
Travel time to work - 60 to 89 minutes (% change since 2000)
Travel time to work - 90 or more minutes (%)
Travel time to work - 90 or more minutes (% change since 2000)
Latest news about work in Calhoun, TN collected exclusively by city-data.com from local newspapers, TV, and radio stations
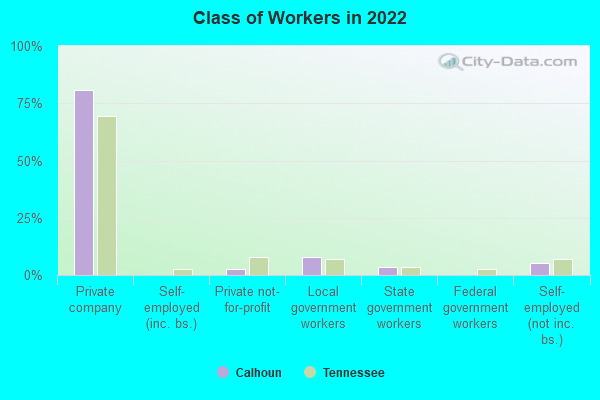
The most common industries in Calhoun are: Educational services (12.2% of civilian employees), Paper (9.0% of civilian employees), Truck transportation (6.7% of civilian employees). 36.6% of workers work in McMinn County and 4.7% of all workers work at home. 80.8% of workers are employees of private companies, which is 14.1% greater than the rate of 69.4% across the entire state of Tennessee.
Whole page based on the data from 2000 / 2022 when the population of Calhoun, Tennessee was 496 / 555
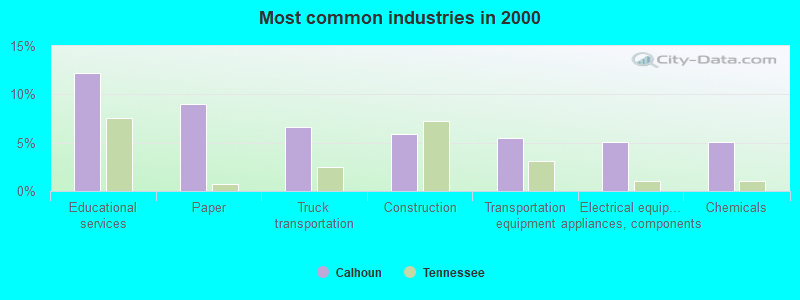
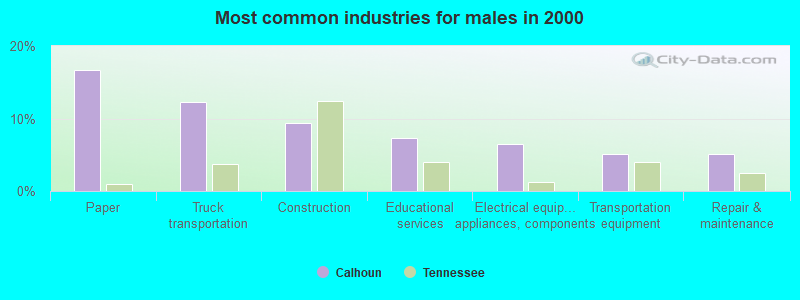
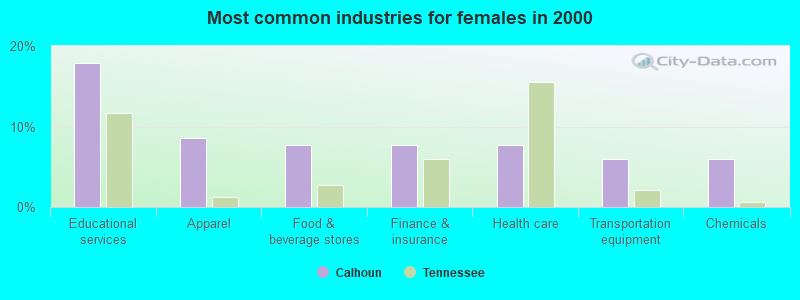
Most common industries
Most common industries Industry All Males Females
Educational services 12.2% 7.2% 17.9% Paper 9.0% 16.7% 0.0% Truck transportation 6.7% 12.3% 0.0% Construction 5.9% 9.4% 1.7% Transportation equipment 5.5% 5.1% 6.0% Electrical equipment, appliances, and components 5.1% 6.5% 3.4% Chemicals 5.1% 4.3% 6.0% Apparel 3.9% 0.0% 8.5% Health care 3.9% 0.7% 7.7% Food and beverage stores 3.5% 0.0% 7.7% Finance and insurance 3.5% 0.0% 7.7% Public administration 3.1% 1.4% 5.1% Department and other general merchandise stores 2.7% 2.2% 3.4% Accommodation and food services 2.7% 3.6% 1.7% Repair and maintenance 2.7% 5.1% 0.0% Religious, grantmaking, civic, professional, and similar organizations 2.4% 0.7% 4.3% Food 2.4% 4.3% 0.0% Utilities 2.4% 2.2% 2.6% Metal and metal products 2.0% 3.6% 0.0% Personal and laundry services 2.0% 0.7% 3.4% Plastics and rubber products 1.6% 1.4% 1.7% Machinery 1.6% 2.9% 0.0% Clothing and accessories, including shoe, stores 1.6% 0.0% 3.4% Textile mills and textile products 1.6% 2.9% 0.0% Miscellaneous nondurable goods merchant wholesalers 1.6% 0.0% 3.4% Agriculture, forestry, fishing and hunting 1.2% 2.2% 0.0% U. S. Postal service 0.8% 1.4% 0.0% Social assistance 0.8% 0.0% 1.7% Miscellaneous manufacturing 0.8% 0.0% 1.7% Real estate and rental and leasing 0.8% 1.4% 0.0% Furniture and related product manufacturing 0.4% 0.7% 0.0% Arts, entertainment, and recreation 0.4% 0.7% 0.0% Motor vehicle and parts dealers 0.4% 0.0% 0.9%
Unemployment in Calhoun Unemployment by race in 2022
Unemployment rate for two or more race residents 8.6% MalesUnemployment by race in 2000
Unemployment rate for White non-Hispanic residents 5.0% Males9.4% Females
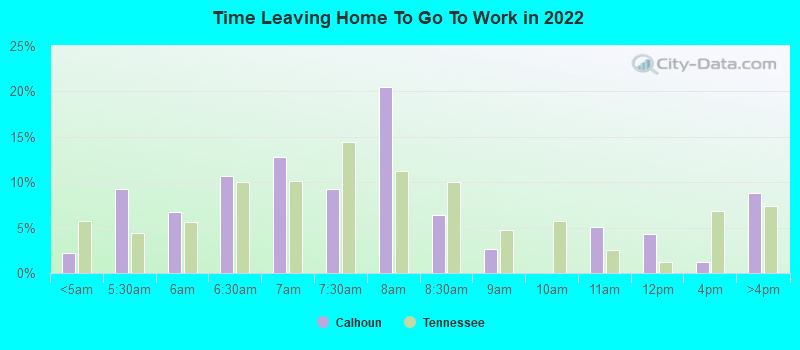
Time leaving home to go to work 12:00 a.m. to 4:59 a.m.: Calhoun:
2.1% (5)Tennessee:
5.8% (168,022)
5:00 a.m. to 5:29 a.m.: Calhoun:
9.2% (22)Tennessee:
4.5% (129,739)
5:30 a.m. to 5:59 a.m.: Calhoun:
6.7% (16)Tennessee:
5.6% (162,304)
6:00 a.m. to 6:29 a.m.: Calhoun:
10.7% (26)Tennessee:
10.0% (290,467)
6:30 a.m. to 6:59 a.m.: Calhoun:
12.8% (31)Tennessee:
10.1% (295,472)
7:00 a.m. to 7:29 a.m.: Calhoun:
9.3% (23)Tennessee:
14.4% (419,614)
7:30 a.m. to 7:59 a.m.: Calhoun:
20.4% (50)Tennessee:
11.3% (327,876)
8:00 a.m. to 8:29 a.m.: Calhoun:
6.4% (16)Tennessee:
10.1% (293,227)
8:30 a.m. to 8:59 a.m.: Calhoun:
2.7% (6)Tennessee:
4.8% (138,580)
10:00 a.m. to 10:59 a.m.: Calhoun:
5.1% (12)Tennessee:
2.5% (73,770)
11:00 a.m. to 11:59 a.m.: Calhoun:
4.3% (11)Tennessee:
1.2% (36,103)
12:00 p.m. to 3:59 p.m.: Calhoun:
1.2% (3)Tennessee:
6.8% (197,821)
4:00 p.m. to 11:59 p.m.: Calhoun:
8.8% (21)Tennessee:
7.4% (215,456)
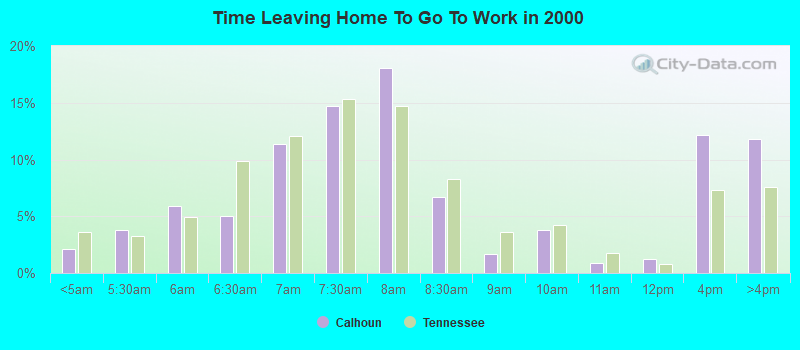
<5am: Calhoun:
2.1% (5)Tennessee:
3.6% (95,201)
5:30am: Calhoun:
3.8% (9)Tennessee:
3.2% (85,054)
6am: Calhoun:
5.9% (14)Tennessee:
5.0% (130,170)
6:30am: Calhoun:
5.0% (12)Tennessee:
9.9% (258,202)
7am: Calhoun:
11.3% (27)Tennessee:
12.1% (315,993)
7:30am: Calhoun:
14.7% (35)Tennessee:
15.3% (400,482)
8am: Calhoun:
18.1% (43)Tennessee:
14.7% (385,430)
8:30am: Calhoun:
6.7% (16)Tennessee:
8.3% (217,000)
9am: Calhoun:
1.7% (4)Tennessee:
3.6% (95,491)
10am: Calhoun:
3.8% (9)Tennessee:
4.2% (109,641)
11am: Calhoun:
0.8% (2)Tennessee:
1.7% (45,353)
12pm: Calhoun:
1.3% (3)Tennessee:
0.8% (21,640)
4pm: Calhoun:
12.2% (29)Tennessee:
7.3% (192,279)
>4pm: Calhoun:
11.8% (28)Tennessee:
7.6% (198,970)
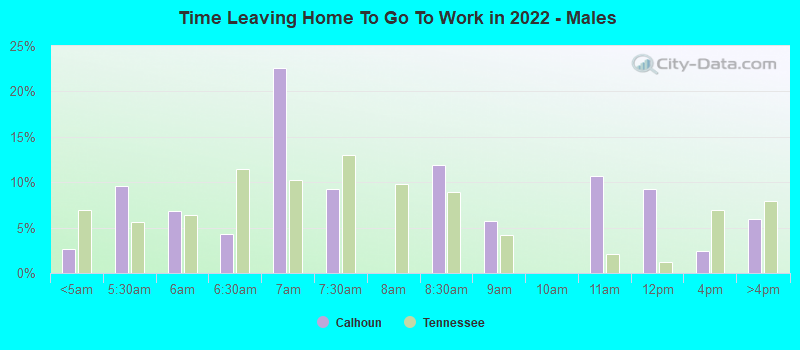
12:00 a.m. to 4:59 a.m. - Males: Calhoun:
2.6% (3)Tennessee:
6.9% (108,520)
5:00 a.m. to 5:29 a.m. - Males: Calhoun:
9.6% (11)Tennessee:
5.6% (87,671)
5:30 a.m. to 5:59 a.m. - Males: Calhoun:
6.8% (8)Tennessee:
6.4% (100,890)
6:00 a.m. to 6:29 a.m. - Males: Calhoun:
4.3% (5)Tennessee:
11.4% (179,873)
6:30 a.m. to 6:59 a.m. - Males: Calhoun:
22.6% (27)Tennessee:
10.3% (161,655)
7:00 a.m. to 7:29 a.m. - Males: Calhoun:
9.3% (11)Tennessee:
13.0% (204,436)
8:00 a.m. to 8:29 a.m. - Males: Calhoun:
11.9% (14)Tennessee:
8.9% (140,283)
8:30 a.m. to 8:59 a.m. - Males: Calhoun:
5.7% (7)Tennessee:
4.1% (65,033)
10:00 a.m. to 10:59 a.m. - Males: Calhoun:
10.6% (12)Tennessee:
2.1% (33,374)
11:00 a.m. to 11:59 a.m. - Males: Calhoun:
9.2% (11)Tennessee:
1.2% (18,699)
12:00 p.m. to 3:59 p.m. - Males: Calhoun:
2.5% (3)Tennessee:
7.0% (109,280)
4:00 p.m. to 11:59 p.m. - Males: Calhoun:
5.9% (7)Tennessee:
8.0% (125,064)
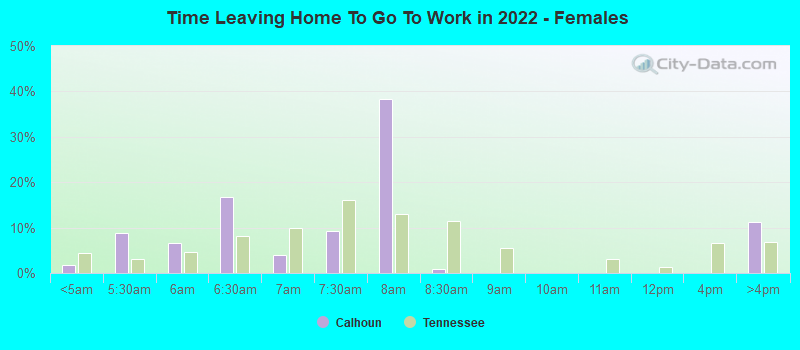
12:00 a.m. to 4:59 a.m. - Females: Calhoun:
1.7% (2)Tennessee:
4.4% (59,502)
5:00 a.m. to 5:29 a.m. - Females: Calhoun:
8.8% (11)Tennessee:
3.1% (42,068)
5:30 a.m. to 5:59 a.m. - Females: Calhoun:
6.7% (8)Tennessee:
4.6% (61,414)
6:00 a.m. to 6:29 a.m. - Females: Calhoun:
16.7% (21)Tennessee:
8.2% (110,594)
6:30 a.m. to 6:59 a.m. - Females: Calhoun:
3.9% (5)Tennessee:
10.0% (133,817)
7:00 a.m. to 7:29 a.m. - Females: Calhoun:
9.3% (12)Tennessee:
16.0% (215,178)
7:30 a.m. to 7:59 a.m. - Females: Calhoun:
38.3% (48)Tennessee:
13.0% (174,519)
8:00 a.m. to 8:29 a.m. - Females: Calhoun:
0.9% (1)Tennessee:
11.4% (152,944)
4:00 p.m. to 11:59 p.m. - Females: Calhoun:
11.3% (14)Tennessee:
6.7% (90,392)
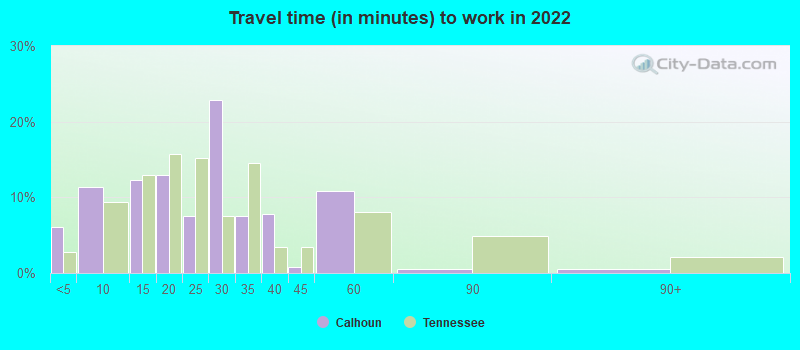
Travel time to work Percentage of workers working in this county: 36.6%Number of people working at home: 12 (4.7% of all workers )
Less than 5 minutes: Calhoun:
6.1% (54)Tennessee:
2.8% (82,584)
5 to 9 minutes: Calhoun:
11.4% (101)Tennessee:
9.4% (278,912)
10 to 14 minutes: Calhoun:
12.2% (108)Tennessee:
13.0% (384,769)
15 to 19 minutes: Calhoun:
13.0% (115)Tennessee:
15.7% (466,908)
20 to 24 minutes: Calhoun:
7.5% (66)Tennessee:
15.2% (450,558)
25 to 29 minutes: Calhoun:
22.9% (202)Tennessee:
7.6% (224,112)
30 to 34 minutes: Calhoun:
7.5% (66)Tennessee:
14.5% (430,603)
35 to 39 minutes: Calhoun:
7.8% (69)Tennessee:
3.4% (100,676)
40 to 44 minutes: Calhoun:
0.7% (6)Tennessee:
3.4% (102,029)
45 to 59 minutes: Calhoun:
10.9% (96)Tennessee:
8.0% (237,317)
60 to 89 minutes: Calhoun:
0.5% (5)Tennessee:
4.9% (146,710)
90 or more minutes: Calhoun:
0.5% (5)Tennessee:
2.1% (61,570)
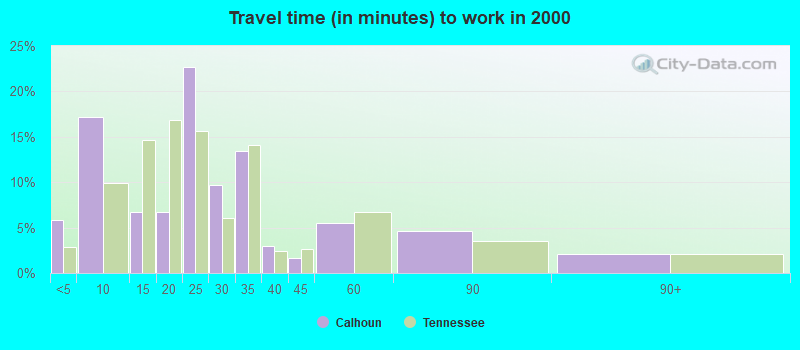
Less than 5 minutes: Calhoun:
5.9% (14)Tennessee:
2.8% (73,643)
5 to 9 minutes: Calhoun:
17.2% (41)Tennessee:
9.9% (258,796)
10 to 14 minutes: Calhoun:
6.7% (16)Tennessee:
14.6% (382,474)
15 to 19 minutes: Calhoun:
6.7% (16)Tennessee:
16.9% (441,464)
20 to 24 minutes: Calhoun:
22.7% (54)Tennessee:
15.6% (409,099)
25 to 29 minutes: Calhoun:
9.7% (23)Tennessee:
6.0% (158,281)
30 to 34 minutes: Calhoun:
13.4% (32)Tennessee:
14.1% (370,428)
35 to 39 minutes: Calhoun:
2.9% (7)Tennessee:
2.4% (63,838)
40 to 44 minutes: Calhoun:
1.7% (4)Tennessee:
2.7% (70,195)
45 to 59 minutes: Calhoun:
5.5% (13)Tennessee:
6.7% (174,982)
60 to 89 minutes: Calhoun:
4.6% (11)Tennessee:
3.5% (92,042)
90 or more minutes: Calhoun:
2.1% (5)Tennessee:
2.1% (55,664)
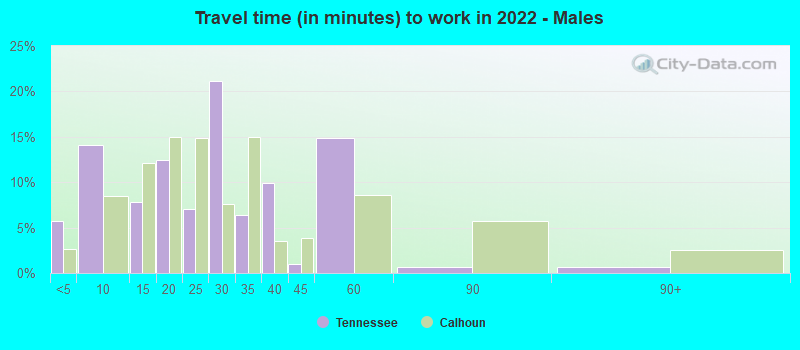
Less than 5 minutes - Males: Calhoun:
5.8% (39)Tennessee:
2.7% (43,057)
5 to 9 minutes - Males: Calhoun:
14.1% (95)Tennessee:
8.5% (135,629)
10 to 14 minutes - Males: Calhoun:
7.8% (53)Tennessee:
12.1% (193,951)
15 to 19 minutes - Males: Calhoun:
12.4% (84)Tennessee:
15.0% (240,259)
20 to 24 minutes - Males: Calhoun:
7.0% (47)Tennessee:
14.9% (237,548)
25 to 29 minutes - Males: Calhoun:
21.1% (142)Tennessee:
7.6% (121,347)
30 to 34 minutes - Males: Calhoun:
6.4% (43)Tennessee:
15.0% (239,352)
35 to 39 minutes - Males: Calhoun:
9.9% (66)Tennessee:
3.5% (55,964)
40 to 44 minutes - Males: Calhoun:
1.0% (7)Tennessee:
3.8% (61,478)
45 to 59 minutes - Males: Calhoun:
14.9% (100)Tennessee:
8.6% (137,988)
60 to 89 minutes - Males: Calhoun:
0.7% (4)Tennessee:
5.7% (91,540)
90 or more minutes - Males: Calhoun:
0.7% (5)Tennessee:
2.5% (40,675)
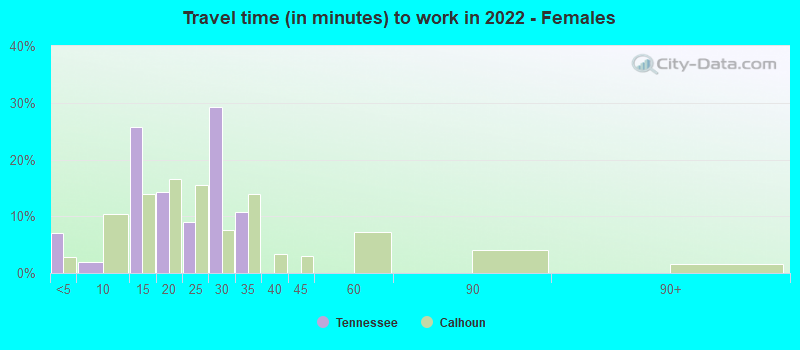
Less than 5 minutes - Females: Calhoun:
7.1% (15)Tennessee:
2.9% (39,527)
5 to 9 minutes - Females: Calhoun:
1.9% (4)Tennessee:
10.5% (143,283)
10 to 14 minutes - Females: Calhoun:
25.8% (56)Tennessee:
13.9% (190,818)
15 to 19 minutes - Females: Calhoun:
14.2% (31)Tennessee:
16.6% (226,649)
20 to 24 minutes - Females: Calhoun:
8.9% (19)Tennessee:
15.6% (213,010)
25 to 29 minutes - Females: Calhoun:
29.3% (64)Tennessee:
7.5% (102,765)
30 to 34 minutes - Females: Calhoun:
10.8% (23)Tennessee:
14.0% (191,251)
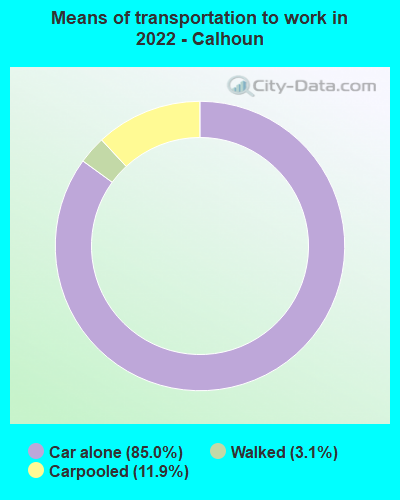
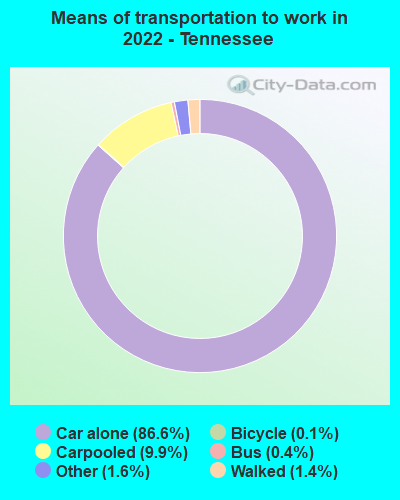
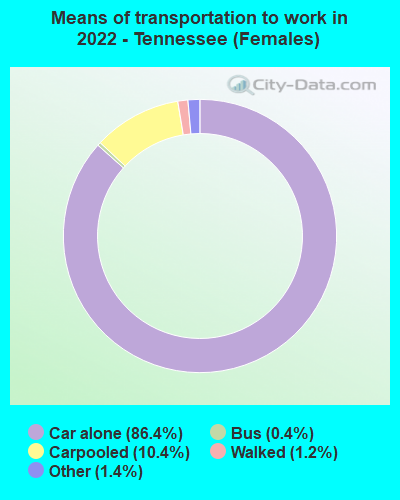
Means of transportation to work Drove car alone: Calhoun:
85.0% (801)Tennessee:
86.6% (1,182,254)
Carpooled: Calhoun:
11.9% (112)Tennessee:
9.9% (142,525)
Walked: Calhoun:
3.1% (29)Tennessee:
1.4% (16,729)
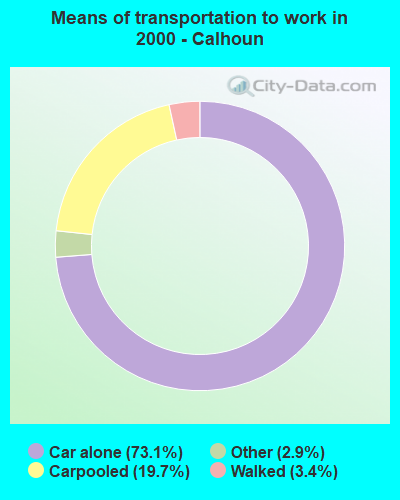
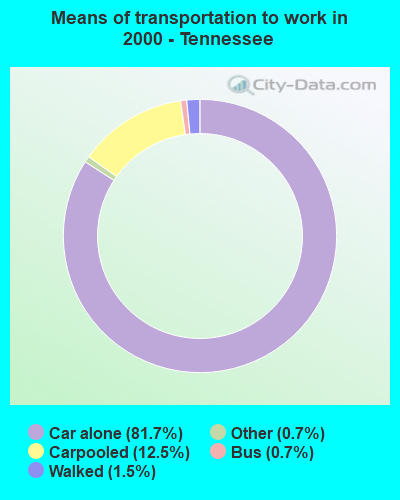
Drove car alone: Calhoun:
73.1% (174)Tennessee:
81.7% (2,140,377)
Carpooled: Calhoun:
19.7% (47)Tennessee:
12.5% (328,321)
Walked: Calhoun:
3.4% (8)Tennessee:
1.5% (39,689)
Other means: Calhoun:
2.9% (7)Tennessee:
0.7% (17,308)
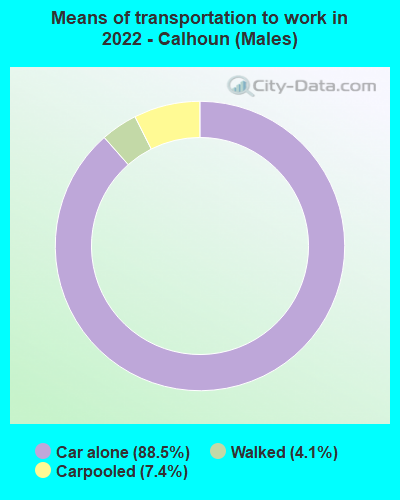
Drove car alone - Males: Calhoun:
88.5% (628)Tennessee:
86.8% (1,182,254)
Carpooled - Males: Calhoun:
7.4% (52)Tennessee:
9.4% (142,525)
Walked - Males: Calhoun:
4.1% (29)Tennessee:
1.5% (16,729)
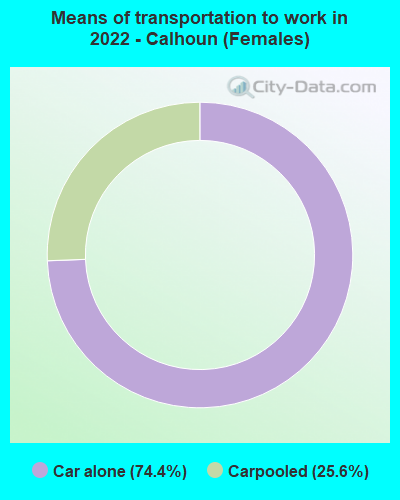
Drove car alone - Females: Calhoun:
74.4% (174)Tennessee:
86.4% (1,182,254)
Carpooled - Females: Calhoun:
25.6% (60)Tennessee:
10.4% (142,525)
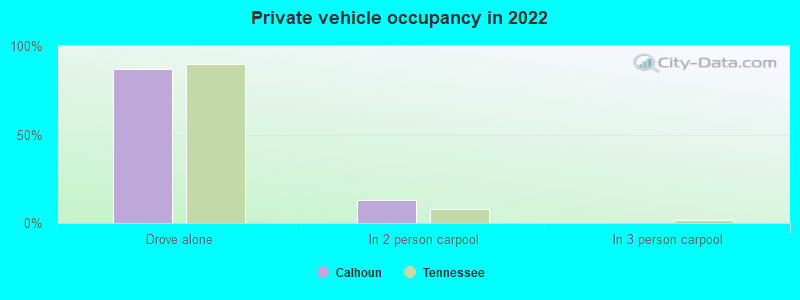
Private vehicle occupancy Drove alone: Calhoun:
87.3% (201)Tennessee:
89.7% (2,520,406)
In 2 person carpool: Calhoun:
12.7% (29)Tennessee:
7.8% (220,446)
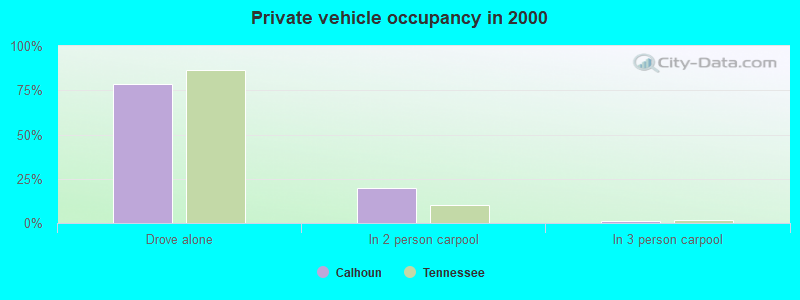
Drove alone: Calhoun:
78.7% (174)Tennessee:
86.7% (2,140,377)
In 2 person carpool: Calhoun:
19.9% (44)Tennessee:
10.4% (257,957)
In 3 person carpool: Calhoun:
1.4% (3)Tennessee:
1.8% (44,143)
Class of workers
Employee of private company: Calhoun:
80.8% (225)Tennessee:
69.4% (2,369,609)
Private not-for-profit wage and salary workers: Calhoun:
2.6% (7)Tennessee:
7.7% (261,180)
Local government workers: Calhoun:
7.9% (22)Tennessee:
6.9% (234,837)
State government workers: Calhoun:
3.4% (9)Tennessee:
3.5% (118,092)
Self-employed workers in own not incorporated business: Calhoun:
5.3% (15)Tennessee:
7.0% (239,148)
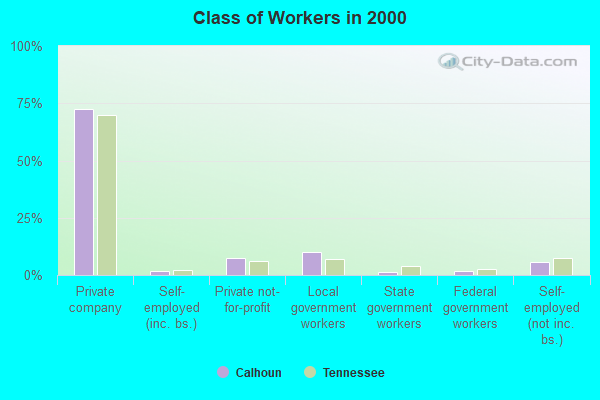
Employee of private company: Calhoun:
72.5% (185)Tennessee:
70.0% (1,855,123)
Self-employed in own incorporated business: Calhoun:
1.6% (4)Tennessee:
2.3% (60,116)
Private not-for-profit wage and salary workers: Calhoun:
7.5% (19)Tennessee:
6.2% (164,441)
Local government workers: Calhoun:
10.2% (26)Tennessee:
7.1% (189,357)
State government workers: Calhoun:
1.2% (3)Tennessee:
4.0% (107,075)
Federal government workers: Calhoun:
1.6% (4)Tennessee:
2.7% (72,605)
Self-employed workers in own not incorporated business: Calhoun:
5.5% (14)Tennessee:
7.3% (194,497)
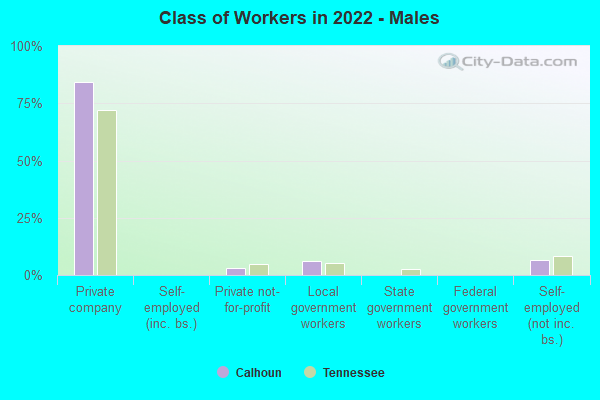
Employee of private company - Males: Calhoun:
84.4% (119)Tennessee:
72.1% (1,295,850)
Private not-for-profit wage and salary workers - Males: Calhoun:
3.0% (4)Tennessee:
4.9% (88,366)
Local government workers - Males: Calhoun:
5.9% (8)Tennessee:
5.0% (90,602)
Self-employed workers in own not incorporated business - Males: Calhoun:
6.7% (9)Tennessee:
8.3% (149,461)
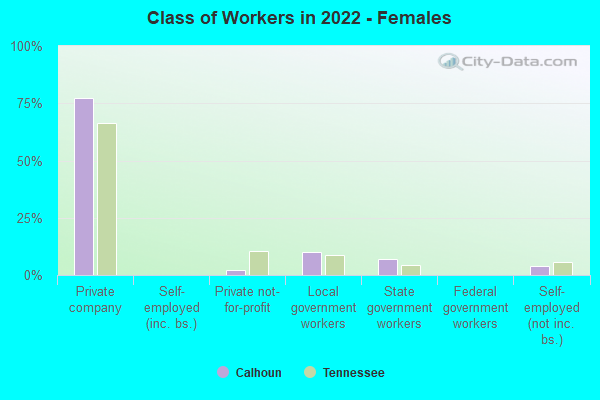
Employee of private company - Females: Calhoun:
77.1% (106)Tennessee:
66.4% (1,073,759)
Private not-for-profit wage and salary workers - Females: Calhoun:
2.3% (3)Tennessee:
10.7% (172,814)
Local government workers - Females: Calhoun:
9.9% (14)Tennessee:
8.9% (144,235)
State government workers - Females: Calhoun:
6.9% (9)Tennessee:
4.2% (67,517)
Self-employed workers in own not incorporated business - Females: Calhoun:
3.8% (5)Tennessee:
5.5% (89,687)