Work and Jobs in Canyon City, Oregon (OR) Detailed Stats
Data:
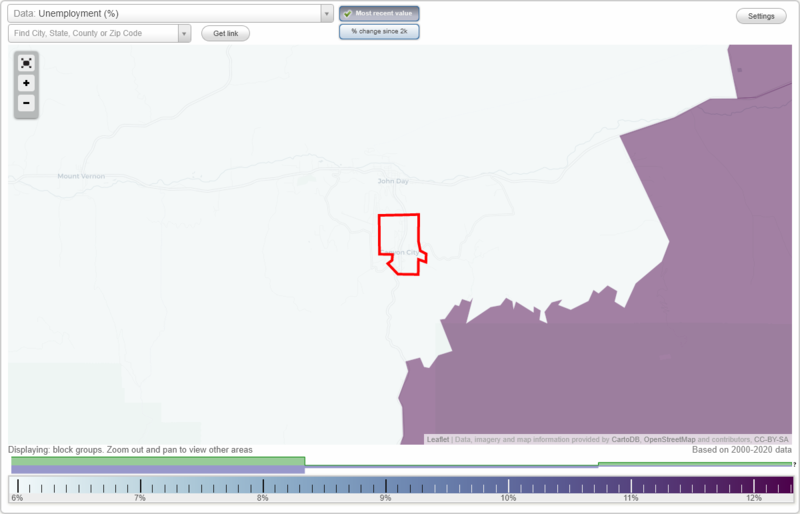
Unemployment (%)
Unemployment (% change since 2000)
Unemployment (%) - White
Unemployment (% change since 2000) - White
Unemployment (%) - Black or African American
Unemployment (% change since 2000) - Black or African American
Unemployment (%) - Asian
Unemployment (% change since 2000) - Asian
Unemployment (%) - Hispanic or Latino
Unemployment (% change since 2000) - Hispanic or Latino
Unemployment (%) - American Indian and Alaska Native
Unemployment (% change since 2000) - American Indian and Alaska Native
Unemployment (%) - Multirace
Unemployment (% change since 2000) - Multirace
Unemployment (%) - Other Race
Unemployment (% change since 2000) - Other Race
Industry diversity
Most Common Industries - Agriculture, forestry, fishing and hunting, and mining (%)
Most Common Industries - Agriculture, forestry, fishing and hunting (%)
Most Common Industries - Mining, quarrying, and oil and gas extraction (%)
Most Common Industries - Construction (%)
Most Common Industries - Manufacturing (%)
Most Common Industries - Wholesale trade (%)
Most Common Industries - Retail trade (%)
Most Common Industries - Transportation and warehousing, and utilities (%)
Most Common Industries - Transportation and warehousing (%)
Most Common Industries - Utilities (%)
Most Common Industries - Information (%)
Most Common Industries - Finance and insurance, and real estate and rental and leasing (%)
Most Common Industries - Finance and insurance (%)
Most Common Industries - Real estate and rental and leasing (%)
Most Common Industries - Professional, scientific, and management, and administrative and waste management services (%)
Most Common Industries - Professional, scientific, and technical services (%)
Most Common Industries - Management of companies and enterprises (%)
Most Common Industries - Administrative and support and waste management services (%)
Most Common Industries - Educational services, and health care and social assistance (%)
Most Common Industries - Educational services (%)
Most Common Industries - Health care and social assistance (%)
Most Common Industries - Arts, entertainment, and recreation, and accommodation and food services (%)
Most Common Industries - Arts, entertainment, and recreation (%)
Most Common Industries - Accommodation and food services (%)
Most Common Industries - Other services, except public administration (%)
Most Common Industries - Public administration (%)
Occupation diversity
Most Common Occupations - Management, business, science, and arts occupations (%)
Most Common Occupations - Management, business, and financial occupations (%)
Most Common Occupations - Management occupations (%)
Most Common Occupations - Business and financial operations occupations (%)
Most Common Occupations - Computer, engineering, and science occupations (%)
Most Common Occupations - Computer and mathematical occupations (%)
Most Common Occupations - Architecture and engineering occupations (%)
Most Common Occupations - Life, physical, and social science occupations (%)
Most Common Occupations - Education, legal, community service, arts, and media occupations (%)
Most Common Occupations - Community and social service occupations (%)
Most Common Occupations - Legal occupations (%)
Most Common Occupations - Education, training, and library occupations (%)
Most Common Occupations - Arts, design, entertainment, sports, and media occupations (%)
Most Common Occupations - Healthcare practitioners and technical occupations (%)
Most Common Occupations - Health diagnosing and treating practitioners and other technical occupations (%)
Most Common Occupations - Health technologists and technicians (%)
Most Common Occupations - Service occupations (%)
Most Common Occupations - Healthcare support occupations (%)
Most Common Occupations - Protective service occupations (%)
Most Common Occupations - Fire fighting and prevention, and other protective service workers including supervisors (%)
Most Common Occupations - Law enforcement workers including supervisors (%)
Most Common Occupations - Food preparation and serving related occupations (%)
Most Common Occupations - Building and grounds cleaning and maintenance occupations (%)
Most Common Occupations - Personal care and service occupations (%)
Most Common Occupations - Sales and office occupations (%)
Most Common Occupations - Sales and related occupations (%)
Most Common Occupations - Office and administrative support occupations (%)
Most Common Occupations - Natural resources, construction, and maintenance occupations (%)
Most Common Occupations - Farming, fishing, and forestry occupations (%)
Most Common Occupations - Construction and extraction occupations (%)
Most Common Occupations - Installation, maintenance, and repair occupations (%)
Most Common Occupations - Production, transportation, and material moving occupations (%)
Most Common Occupations - Production occupations (%)
Most Common Occupations - Transportation occupations (%)
Most Common Occupations - Material moving occupations (%)
Private vehicle occupancy - Drove alone (% change since 2000)
Private vehicle occupancy - Carpooled (%)
Private vehicle occupancy - Carpooled (% change since 2000)
Private vehicle occupancy - In 2-person carpool (%)
Private vehicle occupancy - In 2-person carpool (% change since 2000)
Private vehicle occupancy - In 3-person carpool (%)
Private vehicle occupancy - In 3-person carpool (% change since 2000)
Private vehicle occupancy - In 4-person carpool (%)
Private vehicle occupancy - In 4-person carpool (% change since 2000)
Private vehicle occupancy - In 5- or 6-person carpool (%)
Private vehicle occupancy - In 5- or 6-person carpool (% change since 2000)
Private vehicle occupancy - In 7-or-more-person carpool (%)
Private vehicle occupancy - In 7-or-more-person carpool (% change since 2000)
Time Leaving Home To Go To Work - 12:00 a.m. to 4:59 a.m. (%)
Time Leaving Home To Go To Work - 12:00 a.m. to 4:59 a.m. (% change since 2000)
Time Leaving Home To Go To Work - 5:00 a.m. to 5:59 a.m. (%)
Time Leaving Home To Go To Work - 5:00 a.m. to 5:59 a.m. (% change since 2000)
Time Leaving Home To Go To Work - 6:00 a.m. to 6:59 a.m. (%)
Time Leaving Home To Go To Work - 6:00 a.m. to 6:59 a.m. (% change since 2000)
Time Leaving Home To Go To Work - 7:00 a.m. to 7:59 a.m. (%)
Time Leaving Home To Go To Work - 7:00 a.m. to 7:59 a.m. (% change since 2000)
Time Leaving Home To Go To Work - 8:00 a.m. to 8:59 a.m. (%)
Time Leaving Home To Go To Work - 8:00 a.m. to 8:59 a.m. (% change since 2000)
Time Leaving Home To Go To Work - 9:00 a.m. to 9:59 a.m. (%)
Time Leaving Home To Go To Work - 9:00 a.m. to 9:59 a.m. (% change since 2000)
Time Leaving Home To Go To Work - 10:00 a.m. to 10:59 a.m. (%)
Time Leaving Home To Go To Work - 10:00 a.m. to 10:59 a.m. (% change since 2000)
Time Leaving Home To Go To Work - 11:00 a.m. to 11:59 a.m. (%)
Time Leaving Home To Go To Work - 11:00 a.m. to 11:59 a.m. (% change since 2000)
Time Leaving Home To Go To Work - 12:00 p.m. to 3:59 p.m. (%)
Time Leaving Home To Go To Work - 12:00 p.m. to 3:59 p.m. (% change since 2000)
Time Leaving Home To Go To Work - 4:00 p.m. to 11:59 p.m. (%)
Time Leaving Home To Go To Work - 4:00 p.m. to 11:59 p.m. (% change since 2000)
Class of Workers - Employee of private company (%)
Class of Workers - Employee of private company (% change since 2000)
Class of Workers - Self-employed in own incorporated business (%)
Class of Workers - Self-employed in own incorporated business (% change since 2000)
Class of Workers - Private not-for-profit wage and salary workers (%)
Class of Workers - Private not-for-profit wage and salary workers (% change since 2000)
Class of Workers - Local government workers (%)
Class of Workers - Local government workers (% change since 2000)
Class of Workers - State government workers (%)
Class of Workers - State government workers (% change since 2000)
Class of Workers - Federal government workers (%)
Class of Workers - Federal government workers (% change since 2000)
Class of Workers - Self-employed workers in own not incorporated business and Unpaid family workers (%)
Class of Workers - Self-employed workers in own not incorporated business and Unpaid family workers (% change since 2000)
Means of transportation to work - Drove car alone (%)
Means of transportation to work - Drove car alone (% change since 2000)
Means of transportation to work - Carpooled (%)
Means of transportation to work - Carpooled (% change since 2000)
Means of transportation to work - Public transportation (%)
Means of transportation to work - Public transportation (% change since 2000)
Means of transportation to work - Bus or trolley bus (%)
Means of transportation to work - Bus or trolley bus (% change since 2000)
Means of transportation to work - Streetcar or trolley car (%)
Means of transportation to work - Streetcar or trolley car (% change since 2000)
Means of transportation to work - Subway or elevated (%)
Means of transportation to work - Subway or elevated (% change since 2000)
Means of transportation to work - Railroad (%)
Means of transportation to work - Railroad (% change since 2000)
Means of transportation to work - Ferryboat (%)
Means of transportation to work - Ferryboat (% change since 2000)
Means of transportation to work - Taxicab (%)
Means of transportation to work - Taxicab (% change since 2000)
Means of transportation to work - Motorcycle (%)
Means of transportation to work - Motorcycle (% change since 2000)
Means of transportation to work - Bicycle (%)
Means of transportation to work - Bicycle (% change since 2000)
Means of transportation to work - Walked (%)
Means of transportation to work - Walked (% change since 2000)
Means of transportation to work - Other means (%)
Means of transportation to work - Other means (% change since 2000)
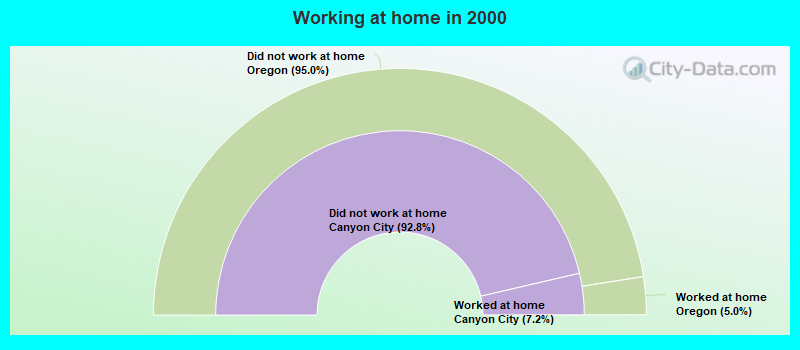
Working at home (%)
Working at home (% change since 2000)
Travel time to work - Less than 5 minutes (%)
Travel time to work - Less than 5 minutes (% change since 2000)
Travel time to work - 5 to 9 minutes (%)
Travel time to work - 5 to 9 minutes (% change since 2000)
Travel time to work - 10 to 19 minutes (%)
Travel time to work - 10 to 19 minutes (% change since 2000)
Travel time to work - 20 to 29 minutes (%)
Travel time to work - 20 to 29 minutes (% change since 2000)
Travel time to work - 30 to 39 minutes (%)
Travel time to work - 30 to 39 minutes (% change since 2000)
Travel time to work - 40 to 59 minutes (%)
Travel time to work - 40 to 59 minutes (% change since 2000)
Travel time to work - 60 to 89 minutes (%)
Travel time to work - 60 to 89 minutes (% change since 2000)
Travel time to work - 90 or more minutes (%)
Travel time to work - 90 or more minutes (% change since 2000)
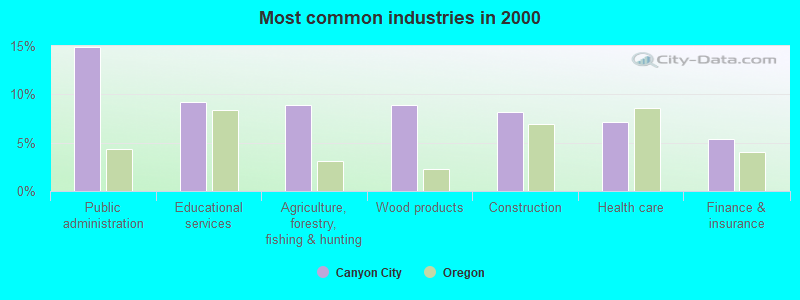
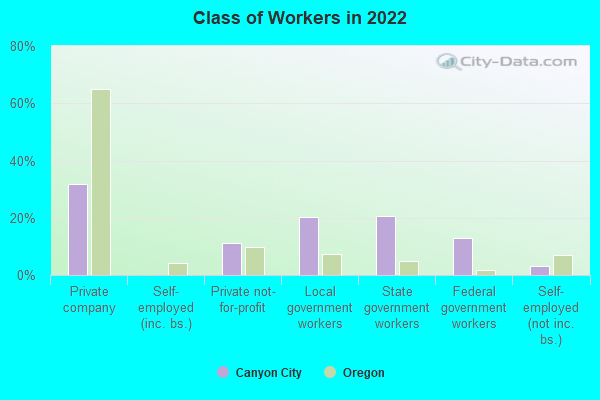
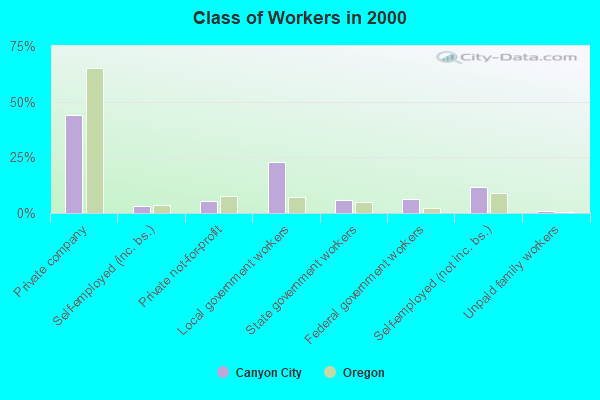
The most common industries in Canyon City are: Public administration (14.9% of civilian employees), Educational services (9.3% of civilian employees), Agriculture, forestry, fishing & hunting (8.9% of civilian employees). 99.7% of workers work in Grant County and 10.5% of all workers work at home. 31.7% of workers are employees of private companies, which is 105.0% less than the rate of 64.9% across the entire state of Oregon.
Whole page based on the data from 2000 / 2022 when the population of Canyon City, Oregon was 669 / 836
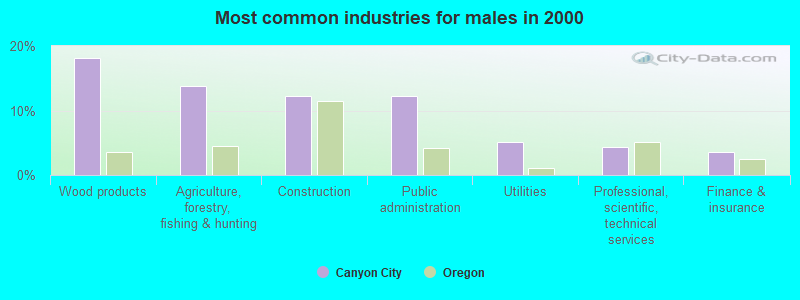
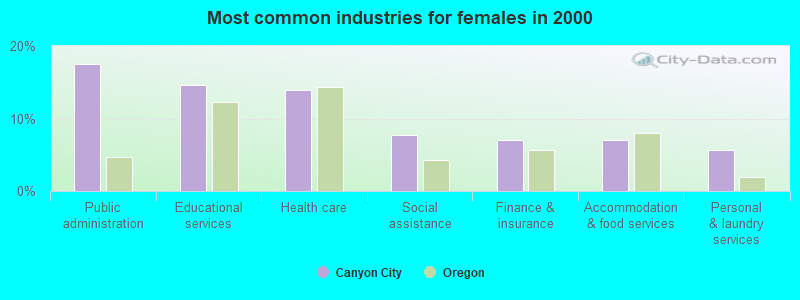
Most common industries
Most common industries Industry All Males Females
Public administration 14.9% 12.3% 17.5% Educational services 9.3% 3.6% 14.7% Agriculture, forestry, fishing and hunting 8.9% 13.8% 4.2% Wood products 8.9% 18.1% 0.0% Construction 8.2% 12.3% 4.2% Health care 7.1% 0.0% 14.0% Finance and insurance 5.3% 3.6% 7.0% Accommodation and food services 5.0% 2.9% 7.0% Social assistance 3.9% 0.0% 7.7% Personal and laundry services 2.8% 0.0% 5.6% Utilities 2.5% 5.1% 0.0% Food and beverage stores 2.1% 2.9% 1.4% Professional, scientific, and technical services 2.1% 4.3% 0.0% Publishing, and motion picture and sound recording industries 1.8% 2.2% 1.4% Religious, grantmaking, civic, professional, and similar organizations 1.8% 0.0% 3.5% Repair and maintenance 1.8% 1.4% 2.1% Machinery, equipment, and supplies merchant wholesalers 1.4% 2.9% 0.0% Arts, entertainment, and recreation 1.4% 1.4% 1.4% Building material and garden equipment and supplies dealers 1.4% 2.9% 0.0% Groceries and related products merchant wholesalers 1.4% 2.9% 0.0% Other direct selling establishments 0.7% 0.0% 1.4% Food 0.7% 1.4% 0.0% Other transportation, and support activities, and couriers 0.7% 1.4% 0.0% Petroleum and petroleum products merchant wholesalers 0.7% 0.0% 1.4% Miscellaneous nondurable goods merchant wholesalers 0.7% 1.4% 0.0% Truck transportation 0.7% 0.0% 1.4% Gasoline stations 0.7% 0.0% 1.4% Clothing and accessories, including shoe, stores 0.7% 0.0% 1.4% Motor vehicles, parts and supplies merchant wholesalers 0.7% 1.4% 0.0% Miscellaneous manufacturing 0.7% 1.4% 0.0% Fuel dealers 0.7% 0.0% 1.4%
Unemployment in Canyon City Unemployment by race in 2022
Unemployment rate for White non-Hispanic residents 13.1% MalesUnemployment by race in 2000
Unemployment rate for White non-Hispanic residents 13.9% Males1.6% FemalesUnemployment rate for two or more race residents 27.3% Males14.3% Females
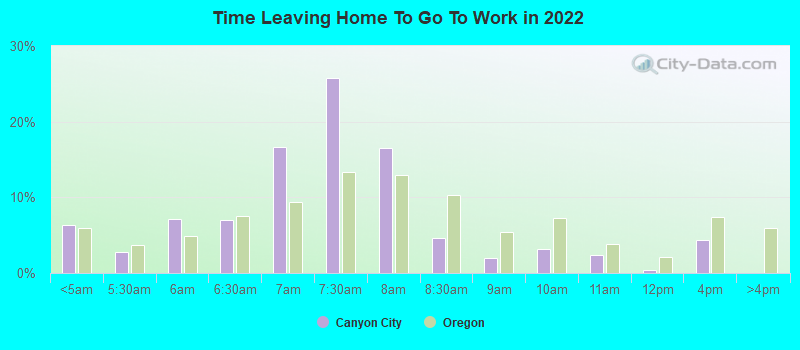
Time leaving home to go to work 12:00 a.m. to 4:59 a.m.: Canyon City:
6.3% (20)Oregon:
5.9% (98,245)
5:00 a.m. to 5:29 a.m.: Canyon City:
2.7% (9)Oregon:
3.7% (61,686)
5:30 a.m. to 5:59 a.m.: Canyon City:
7.2% (23)Oregon:
4.9% (81,016)
6:00 a.m. to 6:29 a.m.: Canyon City:
7.0% (22)Oregon:
7.6% (125,831)
6:30 a.m. to 6:59 a.m.: Canyon City:
16.6% (53)Oregon:
9.4% (157,114)
7:00 a.m. to 7:29 a.m.: Canyon City:
25.8% (82)Oregon:
13.4% (222,929)
7:30 a.m. to 7:59 a.m.: Canyon City:
16.5% (52)Oregon:
12.9% (215,364)
8:00 a.m. to 8:29 a.m.: Canyon City:
4.7% (15)Oregon:
10.4% (172,765)
8:30 a.m. to 8:59 a.m.: Canyon City:
2.0% (6)Oregon:
5.4% (89,869)
9:00 a.m. to 9:59 a.m.: Canyon City:
3.2% (10)Oregon:
7.2% (120,009)
10:00 a.m. to 10:59 a.m.: Canyon City:
2.4% (8)Oregon:
3.8% (63,360)
11:00 a.m. to 11:59 a.m.: Canyon City:
0.4% (1)Oregon:
2.1% (34,334)
12:00 p.m. to 3:59 p.m.: Canyon City:
4.4% (14)Oregon:
7.4% (123,119)
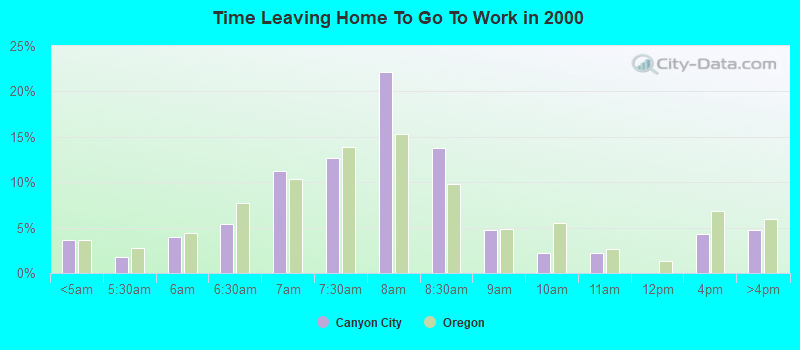
<5am: Canyon City:
3.6% (10)Oregon:
3.7% (58,821)
5:30am: Canyon City:
1.8% (5)Oregon:
2.8% (44,872)
6am: Canyon City:
4.0% (11)Oregon:
4.4% (71,163)
6:30am: Canyon City:
5.4% (15)Oregon:
7.7% (122,707)
7am: Canyon City:
11.2% (31)Oregon:
10.3% (165,185)
7:30am: Canyon City:
12.7% (35)Oregon:
13.9% (222,209)
8am: Canyon City:
22.1% (61)Oregon:
15.3% (245,415)
8:30am: Canyon City:
13.8% (38)Oregon:
9.8% (156,781)
9am: Canyon City:
4.7% (13)Oregon:
4.9% (78,436)
10am: Canyon City:
2.2% (6)Oregon:
5.5% (88,783)
11am: Canyon City:
2.2% (6)Oregon:
2.6% (41,539)
4pm: Canyon City:
4.3% (12)Oregon:
6.8% (108,927)
>4pm: Canyon City:
4.7% (13)Oregon:
6.0% (95,989)
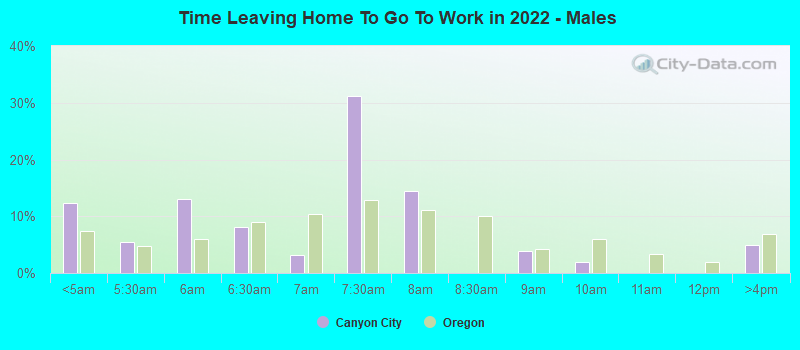
12:00 a.m. to 4:59 a.m. - Males: Canyon City:
12.3% (19)Oregon:
7.4% (66,534)
5:00 a.m. to 5:29 a.m. - Males: Canyon City:
5.5% (9)Oregon:
4.8% (42,985)
5:30 a.m. to 5:59 a.m. - Males: Canyon City:
13.0% (20)Oregon:
6.1% (54,375)
6:00 a.m. to 6:29 a.m. - Males: Canyon City:
8.1% (13)Oregon:
9.0% (80,638)
6:30 a.m. to 6:59 a.m. - Males: Canyon City:
3.1% (5)Oregon:
10.4% (93,611)
7:00 a.m. to 7:29 a.m. - Males: Canyon City:
31.2% (49)Oregon:
12.8% (114,794)
7:30 a.m. to 7:59 a.m. - Males: Canyon City:
14.4% (22)Oregon:
11.1% (99,832)
8:30 a.m. to 8:59 a.m. - Males: Canyon City:
4.0% (6)Oregon:
4.3% (38,595)
9:00 a.m. to 9:59 a.m. - Males: Canyon City:
1.9% (3)Oregon:
6.0% (53,791)
12:00 p.m. to 3:59 p.m. - Males: Canyon City:
5.0% (8)Oregon:
7.0% (62,443)
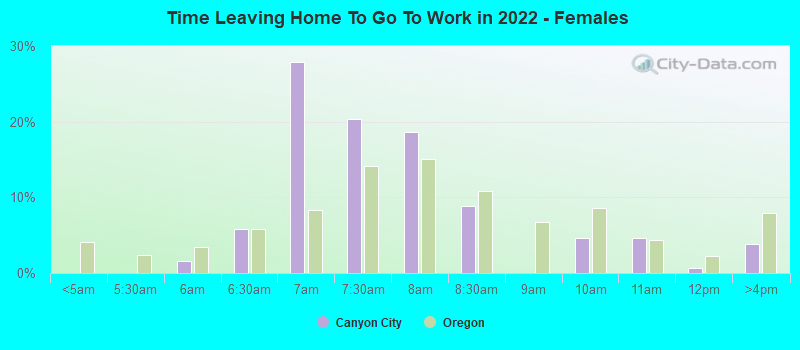
5:30 a.m. to 5:59 a.m. - Females: Canyon City:
1.7% (3)Oregon:
3.5% (26,641)
6:00 a.m. to 6:29 a.m. - Females: Canyon City:
5.9% (9)Oregon:
5.9% (45,193)
6:30 a.m. to 6:59 a.m. - Females: Canyon City:
27.9% (45)Oregon:
8.3% (63,503)
7:00 a.m. to 7:29 a.m. - Females: Canyon City:
20.4% (33)Oregon:
14.1% (108,135)
7:30 a.m. to 7:59 a.m. - Females: Canyon City:
18.6% (30)Oregon:
15.0% (115,532)
8:00 a.m. to 8:29 a.m. - Females: Canyon City:
8.8% (14)Oregon:
10.9% (83,414)
9:00 a.m. to 9:59 a.m. - Females: Canyon City:
4.6% (7)Oregon:
8.6% (66,218)
10:00 a.m. to 10:59 a.m. - Females: Canyon City:
4.6% (7)Oregon:
4.4% (33,653)
11:00 a.m. to 11:59 a.m. - Females: Canyon City:
0.7% (1)Oregon:
2.3% (17,550)
12:00 p.m. to 3:59 p.m. - Females: Canyon City:
3.8% (6)Oregon:
7.9% (60,676)
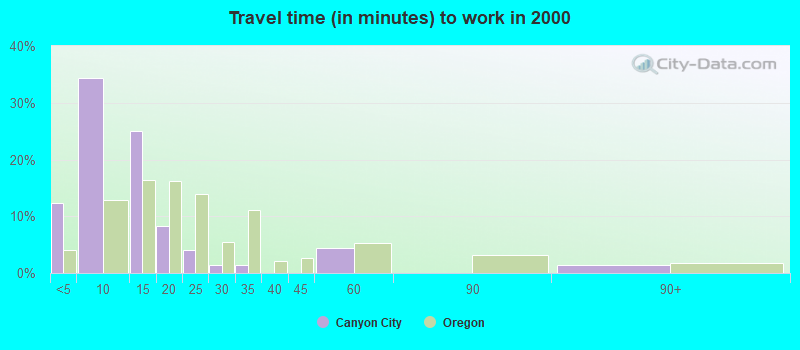
Travel time to work Percentage of workers working in this county: 99.7%Number of people working at home: 38 (10.5% of all workers )
Less than 5 minutes: Canyon City:
12.3% (34)Oregon:
4.1% (66,369)
5 to 9 minutes: Canyon City:
34.4% (95)Oregon:
12.9% (206,168)
10 to 14 minutes: Canyon City:
25.0% (69)Oregon:
16.5% (263,466)
15 to 19 minutes: Canyon City:
8.3% (23)Oregon:
16.1% (258,476)
20 to 24 minutes: Canyon City:
4.0% (11)Oregon:
13.9% (223,370)
25 to 29 minutes: Canyon City:
1.4% (4)Oregon:
5.4% (87,147)
30 to 34 minutes: Canyon City:
1.4% (4)Oregon:
11.0% (176,763)
45 to 59 minutes: Canyon City:
4.3% (12)Oregon:
5.2% (83,858)
90 or more minutes: Canyon City:
1.4% (4)Oregon:
1.8% (28,715)
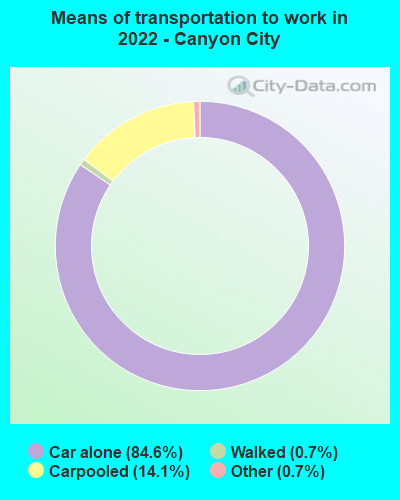
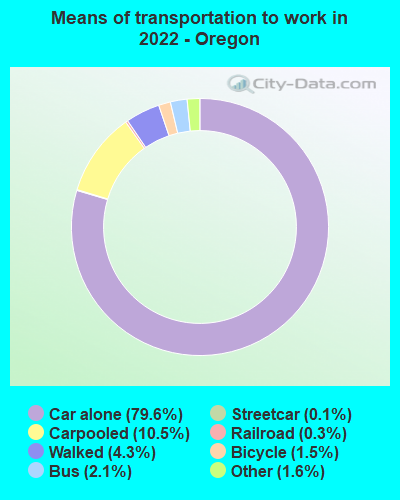
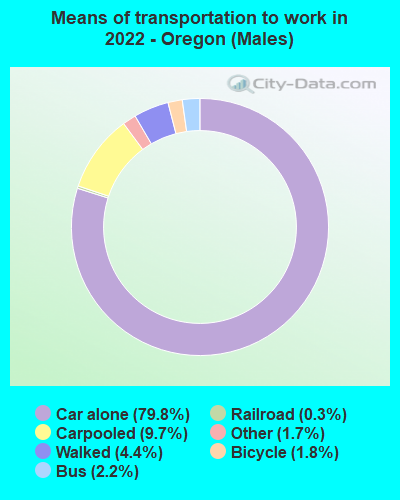
Means of transportation to work Drove car alone: Canyon City:
84.6% (306)Oregon:
79.6% (619,058)
Carpooled: Canyon City:
14.1% (51)Oregon:
10.5% (88,500)
Walked: Canyon City:
0.7% (2)Oregon:
4.3% (33,279)
Other means: Canyon City:
0.7% (2)Oregon:
1.6% (11,115)
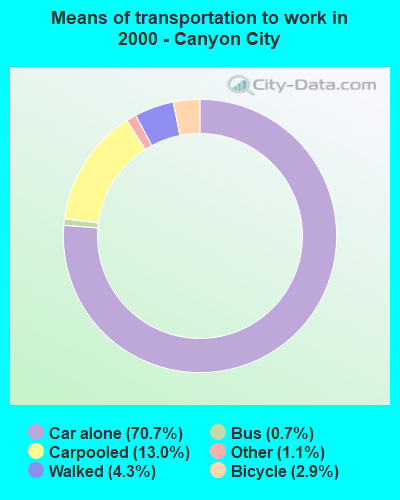
Drove car alone: Canyon City:
70.7% (195)Oregon:
73.2% (1,171,641)
Carpooled: Canyon City:
13.0% (36)Oregon:
12.2% (195,950)
Bus or trolley bus: Canyon City:
0.7% (2)Oregon:
3.5% (56,795)
Bicycle: Canyon City:
2.9% (8)Oregon:
1.1% (17,172)
Walked: Canyon City:
4.3% (12)Oregon:
3.6% (57,217)
Other means: Canyon City:
1.1% (3)Oregon:
0.7% (10,882)
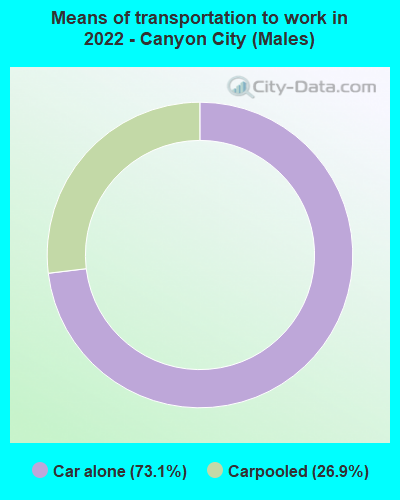
Drove car alone - Males: Canyon City:
73.1% (117)Oregon:
79.8% (619,058)
Carpooled - Males: Canyon City:
26.9% (43)Oregon:
9.7% (88,500)
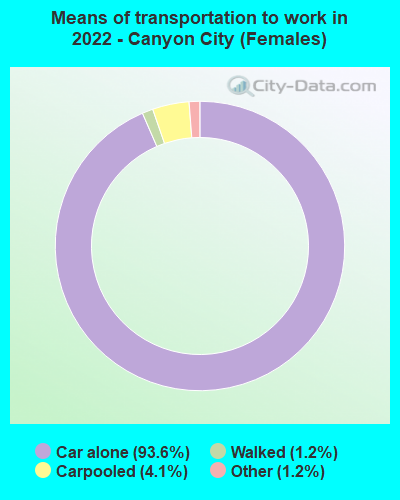
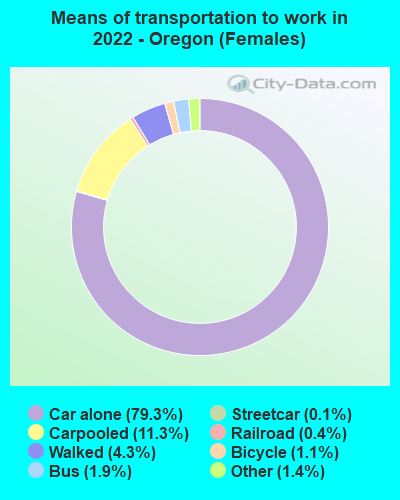
Drove car alone - Females: Canyon City:
93.6% (189)Oregon:
79.3% (619,058)
Carpooled - Females: Canyon City:
4.1% (8)Oregon:
11.3% (88,500)
Walked - Females: Canyon City:
1.2% (2)Oregon:
4.3% (33,279)
Other means - Females: Canyon City:
1.2% (2)Oregon:
1.4% (11,115)
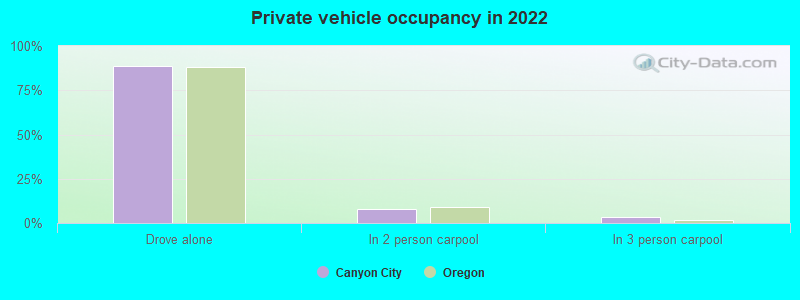
Private vehicle occupancy Drove alone: Canyon City:
88.5% (246)Oregon:
88.2% (1,317,823)
In 2 person carpool: Canyon City:
8.1% (23)Oregon:
9.0% (134,621)
In 3 person carpool: Canyon City:
3.4% (9)Oregon:
1.8% (26,995)
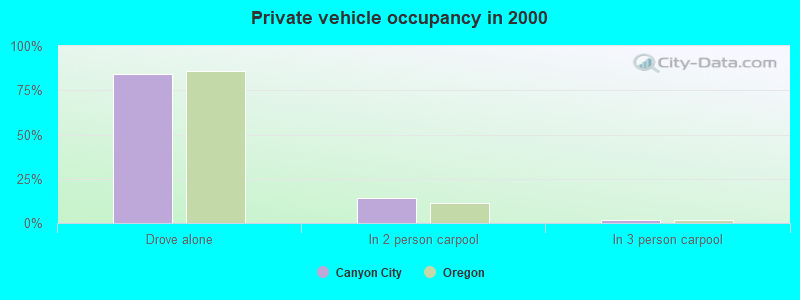
Drove alone: Canyon City:
84.4% (195)Oregon:
85.7% (1,171,641)
In 2 person carpool: Canyon City:
13.9% (32)Oregon:
11.5% (156,754)
In 3 person carpool: Canyon City:
1.7% (4)Oregon:
1.9% (25,457)
Class of workers
Employee of private company: Canyon City:
31.7% (118)Oregon:
64.9% (1,360,643)
Private not-for-profit wage and salary workers: Canyon City:
11.3% (42)Oregon:
9.6% (201,342)
Local government workers: Canyon City:
20.4% (76)Oregon:
7.2% (151,100)
State government workers: Canyon City:
20.7% (77)Oregon:
5.0% (103,943)
Federal government workers: Canyon City:
12.9% (48)Oregon:
1.7% (35,607)
Self-employed workers in own not incorporated business: Canyon City:
3.0% (11)Oregon:
6.9% (145,422)
Employee of private company: Canyon City:
44.1% (124)Oregon:
65.1% (1,059,139)
Self-employed in own incorporated business: Canyon City:
3.2% (9)Oregon:
3.8% (61,386)
Private not-for-profit wage and salary workers: Canyon City:
5.3% (15)Oregon:
7.4% (120,839)
Local government workers: Canyon City:
22.8% (64)Oregon:
7.2% (116,733)
State government workers: Canyon City:
5.7% (16)Oregon:
5.0% (81,804)
Federal government workers: Canyon City:
6.4% (18)Oregon:
2.2% (36,076)
Self-employed workers in own not incorporated business: Canyon City:
11.7% (33)Oregon:
8.9% (145,020)
Unpaid family workers: Canyon City:
0.7% (2)Oregon:
0.4% (6,772)
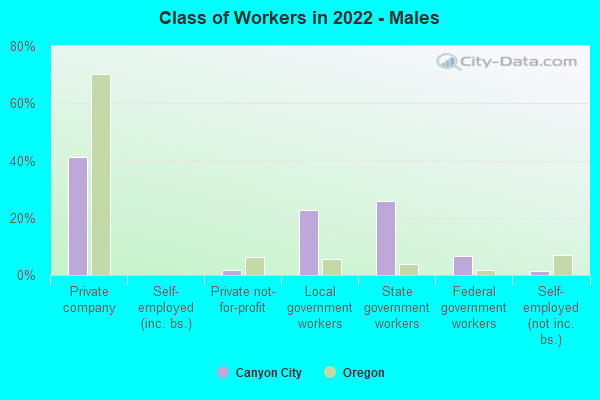
Employee of private company - Males: Canyon City:
41.4% (69)Oregon:
70.1% (771,769)
Private not-for-profit wage and salary workers - Males: Canyon City:
1.9% (3)Oregon:
6.2% (68,159)
Local government workers - Males: Canyon City:
22.8% (38)Oregon:
5.5% (60,350)
State government workers - Males: Canyon City:
25.9% (43)Oregon:
3.9% (42,724)
Federal government workers - Males: Canyon City:
6.8% (11)Oregon:
1.9% (21,082)
Self-employed workers in own not incorporated business - Males: Canyon City:
1.2% (2)Oregon:
6.9% (76,355)
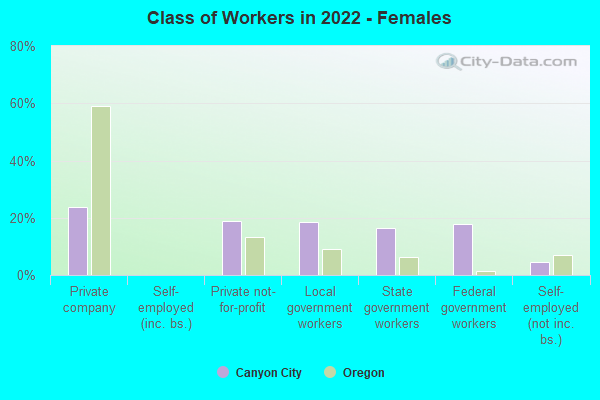
Employee of private company - Females: Canyon City:
23.9% (49)Oregon:
59.2% (588,874)
Private not-for-profit wage and salary workers - Females: Canyon City:
18.9% (39)Oregon:
13.4% (133,183)
Local government workers - Females: Canyon City:
18.4% (38)Oregon:
9.1% (90,750)
State government workers - Females: Canyon City:
16.4% (34)Oregon:
6.2% (61,219)
Federal government workers - Females: Canyon City:
17.9% (37)Oregon:
1.5% (14,525)
Self-employed workers in own not incorporated business - Females: Canyon City:
4.5% (9)Oregon:
6.9% (69,067)