Work and Jobs in Castor, Louisiana (LA) Detailed Stats
Data:
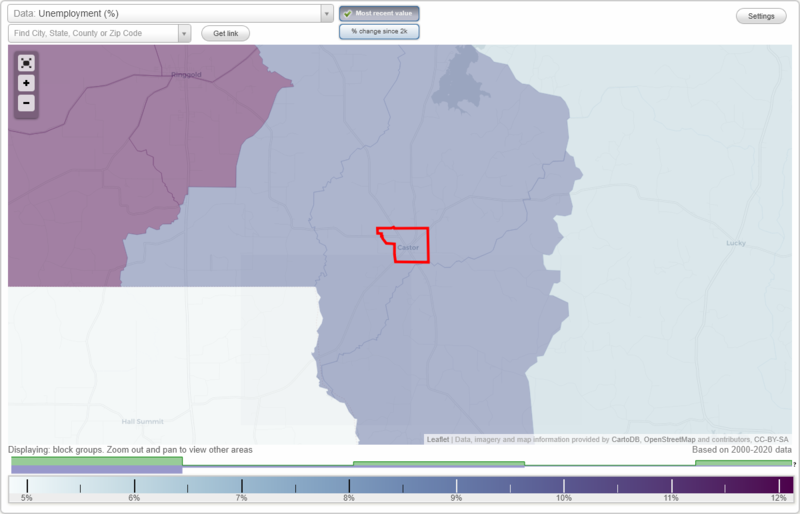
Unemployment (%)
Unemployment (% change since 2000)
Unemployment (%) - White
Unemployment (% change since 2000) - White
Unemployment (%) - Black or African American
Unemployment (% change since 2000) - Black or African American
Unemployment (%) - Asian
Unemployment (% change since 2000) - Asian
Unemployment (%) - Hispanic or Latino
Unemployment (% change since 2000) - Hispanic or Latino
Unemployment (%) - American Indian and Alaska Native
Unemployment (% change since 2000) - American Indian and Alaska Native
Unemployment (%) - Multirace
Unemployment (% change since 2000) - Multirace
Unemployment (%) - Other Race
Unemployment (% change since 2000) - Other Race
Industry diversity
Most Common Industries - Agriculture, forestry, fishing and hunting, and mining (%)
Most Common Industries - Agriculture, forestry, fishing and hunting (%)
Most Common Industries - Mining, quarrying, and oil and gas extraction (%)
Most Common Industries - Construction (%)
Most Common Industries - Manufacturing (%)
Most Common Industries - Wholesale trade (%)
Most Common Industries - Retail trade (%)
Most Common Industries - Transportation and warehousing, and utilities (%)
Most Common Industries - Transportation and warehousing (%)
Most Common Industries - Utilities (%)
Most Common Industries - Information (%)
Most Common Industries - Finance and insurance, and real estate and rental and leasing (%)
Most Common Industries - Finance and insurance (%)
Most Common Industries - Real estate and rental and leasing (%)
Most Common Industries - Professional, scientific, and management, and administrative and waste management services (%)
Most Common Industries - Professional, scientific, and technical services (%)
Most Common Industries - Management of companies and enterprises (%)
Most Common Industries - Administrative and support and waste management services (%)
Most Common Industries - Educational services, and health care and social assistance (%)
Most Common Industries - Educational services (%)
Most Common Industries - Health care and social assistance (%)
Most Common Industries - Arts, entertainment, and recreation, and accommodation and food services (%)
Most Common Industries - Arts, entertainment, and recreation (%)
Most Common Industries - Accommodation and food services (%)
Most Common Industries - Other services, except public administration (%)
Most Common Industries - Public administration (%)
Occupation diversity
Most Common Occupations - Management, business, science, and arts occupations (%)
Most Common Occupations - Management, business, and financial occupations (%)
Most Common Occupations - Management occupations (%)
Most Common Occupations - Business and financial operations occupations (%)
Most Common Occupations - Computer, engineering, and science occupations (%)
Most Common Occupations - Computer and mathematical occupations (%)
Most Common Occupations - Architecture and engineering occupations (%)
Most Common Occupations - Life, physical, and social science occupations (%)
Most Common Occupations - Education, legal, community service, arts, and media occupations (%)
Most Common Occupations - Community and social service occupations (%)
Most Common Occupations - Legal occupations (%)
Most Common Occupations - Education, training, and library occupations (%)
Most Common Occupations - Arts, design, entertainment, sports, and media occupations (%)
Most Common Occupations - Healthcare practitioners and technical occupations (%)
Most Common Occupations - Health diagnosing and treating practitioners and other technical occupations (%)
Most Common Occupations - Health technologists and technicians (%)
Most Common Occupations - Service occupations (%)
Most Common Occupations - Healthcare support occupations (%)
Most Common Occupations - Protective service occupations (%)
Most Common Occupations - Fire fighting and prevention, and other protective service workers including supervisors (%)
Most Common Occupations - Law enforcement workers including supervisors (%)
Most Common Occupations - Food preparation and serving related occupations (%)
Most Common Occupations - Building and grounds cleaning and maintenance occupations (%)
Most Common Occupations - Personal care and service occupations (%)
Most Common Occupations - Sales and office occupations (%)
Most Common Occupations - Sales and related occupations (%)
Most Common Occupations - Office and administrative support occupations (%)
Most Common Occupations - Natural resources, construction, and maintenance occupations (%)
Most Common Occupations - Farming, fishing, and forestry occupations (%)
Most Common Occupations - Construction and extraction occupations (%)
Most Common Occupations - Installation, maintenance, and repair occupations (%)
Most Common Occupations - Production, transportation, and material moving occupations (%)
Most Common Occupations - Production occupations (%)
Most Common Occupations - Transportation occupations (%)
Most Common Occupations - Material moving occupations (%)
Private vehicle occupancy - Drove alone (% change since 2000)
Private vehicle occupancy - Carpooled (%)
Private vehicle occupancy - Carpooled (% change since 2000)
Private vehicle occupancy - In 2-person carpool (%)
Private vehicle occupancy - In 2-person carpool (% change since 2000)
Private vehicle occupancy - In 3-person carpool (%)
Private vehicle occupancy - In 3-person carpool (% change since 2000)
Private vehicle occupancy - In 4-person carpool (%)
Private vehicle occupancy - In 4-person carpool (% change since 2000)
Private vehicle occupancy - In 5- or 6-person carpool (%)
Private vehicle occupancy - In 5- or 6-person carpool (% change since 2000)
Private vehicle occupancy - In 7-or-more-person carpool (%)
Private vehicle occupancy - In 7-or-more-person carpool (% change since 2000)
Time Leaving Home To Go To Work - 12:00 a.m. to 4:59 a.m. (%)
Time Leaving Home To Go To Work - 12:00 a.m. to 4:59 a.m. (% change since 2000)
Time Leaving Home To Go To Work - 5:00 a.m. to 5:59 a.m. (%)
Time Leaving Home To Go To Work - 5:00 a.m. to 5:59 a.m. (% change since 2000)
Time Leaving Home To Go To Work - 6:00 a.m. to 6:59 a.m. (%)
Time Leaving Home To Go To Work - 6:00 a.m. to 6:59 a.m. (% change since 2000)
Time Leaving Home To Go To Work - 7:00 a.m. to 7:59 a.m. (%)
Time Leaving Home To Go To Work - 7:00 a.m. to 7:59 a.m. (% change since 2000)
Time Leaving Home To Go To Work - 8:00 a.m. to 8:59 a.m. (%)
Time Leaving Home To Go To Work - 8:00 a.m. to 8:59 a.m. (% change since 2000)
Time Leaving Home To Go To Work - 9:00 a.m. to 9:59 a.m. (%)
Time Leaving Home To Go To Work - 9:00 a.m. to 9:59 a.m. (% change since 2000)
Time Leaving Home To Go To Work - 10:00 a.m. to 10:59 a.m. (%)
Time Leaving Home To Go To Work - 10:00 a.m. to 10:59 a.m. (% change since 2000)
Time Leaving Home To Go To Work - 11:00 a.m. to 11:59 a.m. (%)
Time Leaving Home To Go To Work - 11:00 a.m. to 11:59 a.m. (% change since 2000)
Time Leaving Home To Go To Work - 12:00 p.m. to 3:59 p.m. (%)
Time Leaving Home To Go To Work - 12:00 p.m. to 3:59 p.m. (% change since 2000)
Time Leaving Home To Go To Work - 4:00 p.m. to 11:59 p.m. (%)
Time Leaving Home To Go To Work - 4:00 p.m. to 11:59 p.m. (% change since 2000)
Class of Workers - Employee of private company (%)
Class of Workers - Employee of private company (% change since 2000)
Class of Workers - Self-employed in own incorporated business (%)
Class of Workers - Self-employed in own incorporated business (% change since 2000)
Class of Workers - Private not-for-profit wage and salary workers (%)
Class of Workers - Private not-for-profit wage and salary workers (% change since 2000)
Class of Workers - Local government workers (%)
Class of Workers - Local government workers (% change since 2000)
Class of Workers - State government workers (%)
Class of Workers - State government workers (% change since 2000)
Class of Workers - Federal government workers (%)
Class of Workers - Federal government workers (% change since 2000)
Class of Workers - Self-employed workers in own not incorporated business and Unpaid family workers (%)
Class of Workers - Self-employed workers in own not incorporated business and Unpaid family workers (% change since 2000)
Means of transportation to work - Drove car alone (%)
Means of transportation to work - Drove car alone (% change since 2000)
Means of transportation to work - Carpooled (%)
Means of transportation to work - Carpooled (% change since 2000)
Means of transportation to work - Public transportation (%)
Means of transportation to work - Public transportation (% change since 2000)
Means of transportation to work - Bus or trolley bus (%)
Means of transportation to work - Bus or trolley bus (% change since 2000)
Means of transportation to work - Streetcar or trolley car (%)
Means of transportation to work - Streetcar or trolley car (% change since 2000)
Means of transportation to work - Subway or elevated (%)
Means of transportation to work - Subway or elevated (% change since 2000)
Means of transportation to work - Railroad (%)
Means of transportation to work - Railroad (% change since 2000)
Means of transportation to work - Ferryboat (%)
Means of transportation to work - Ferryboat (% change since 2000)
Means of transportation to work - Taxicab (%)
Means of transportation to work - Taxicab (% change since 2000)
Means of transportation to work - Motorcycle (%)
Means of transportation to work - Motorcycle (% change since 2000)
Means of transportation to work - Bicycle (%)
Means of transportation to work - Bicycle (% change since 2000)
Means of transportation to work - Walked (%)
Means of transportation to work - Walked (% change since 2000)
Means of transportation to work - Other means (%)
Means of transportation to work - Other means (% change since 2000)
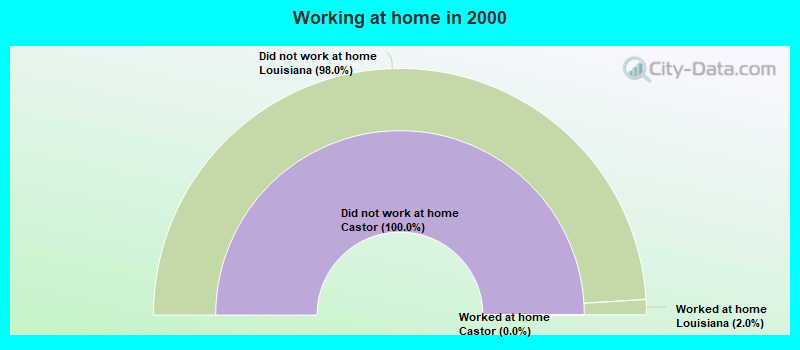
Working at home (%)
Working at home (% change since 2000)
Travel time to work - Less than 5 minutes (%)
Travel time to work - Less than 5 minutes (% change since 2000)
Travel time to work - 5 to 9 minutes (%)
Travel time to work - 5 to 9 minutes (% change since 2000)
Travel time to work - 10 to 19 minutes (%)
Travel time to work - 10 to 19 minutes (% change since 2000)
Travel time to work - 20 to 29 minutes (%)
Travel time to work - 20 to 29 minutes (% change since 2000)
Travel time to work - 30 to 39 minutes (%)
Travel time to work - 30 to 39 minutes (% change since 2000)
Travel time to work - 40 to 59 minutes (%)
Travel time to work - 40 to 59 minutes (% change since 2000)
Travel time to work - 60 to 89 minutes (%)
Travel time to work - 60 to 89 minutes (% change since 2000)
Travel time to work - 90 or more minutes (%)
Travel time to work - 90 or more minutes (% change since 2000)
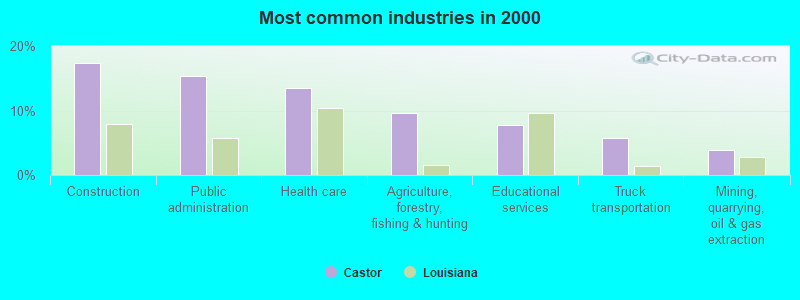
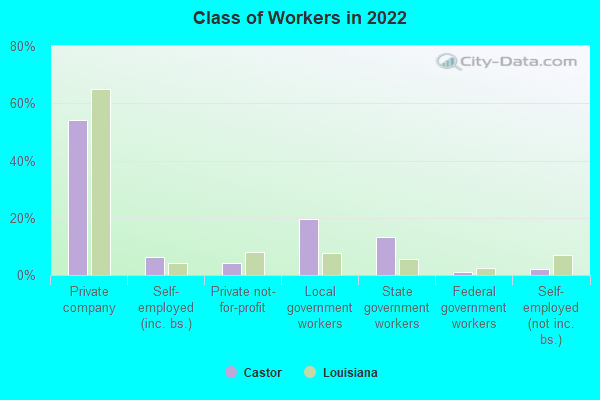
The most common industries in Castor are: Construction (17.3% of civilian employees), Public administration (15.4% of civilian employees), Health care (13.5% of civilian employees). 49.0% of workers work in Bienville Parish. 54.1% of workers are employees of private companies, which is 20.0% less than the rate of 64.9% across the entire state of Louisiana.
Whole page based on the data from 2000 / 2022 when the population of Castor, Louisiana was 209 / 289
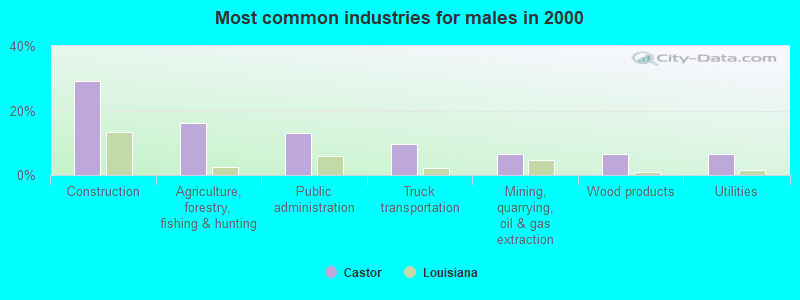
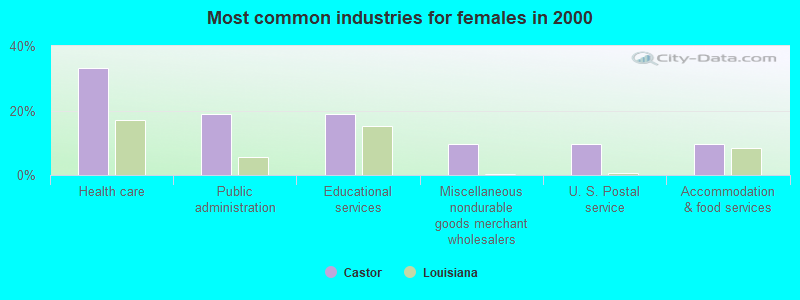
Most common industries
Most common industries Industry All Males Females
Construction 17.3% 29.0% 0.0% Public administration 15.4% 12.9% 19.0% Health care 13.5% 0.0% 33.3% Agriculture, forestry, fishing and hunting 9.6% 16.1% 0.0% Educational services 7.7% 0.0% 19.0% Truck transportation 5.8% 9.7% 0.0% Mining, quarrying, and oil and gas extraction 3.8% 6.5% 0.0% Miscellaneous nondurable goods merchant wholesalers 3.8% 0.0% 9.5% Wood products 3.8% 6.5% 0.0% U. S. Postal service 3.8% 0.0% 9.5% Utilities 3.8% 6.5% 0.0% Arts, entertainment, and recreation 3.8% 6.5% 0.0% Accommodation and food services 3.8% 0.0% 9.5% Repair and maintenance 3.8% 6.5% 0.0%
Unemployment in Castor Unemployment by race in 2000
Unemployment rate for White non-Hispanic residents 11.1% Females
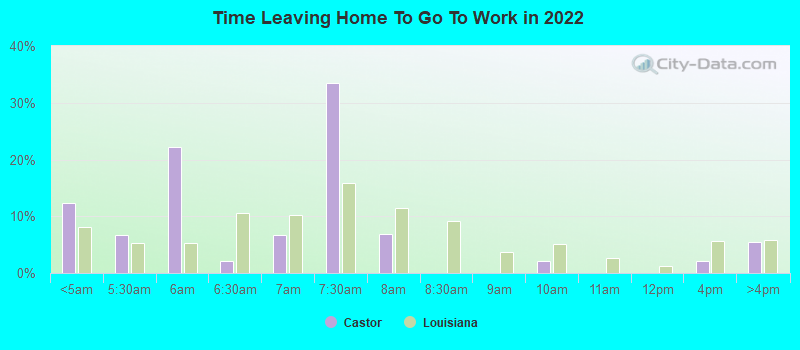
Time leaving home to go to work 12:00 a.m. to 4:59 a.m.: Castor:
12.3% (12)Louisiana:
8.2% (151,357)
5:00 a.m. to 5:29 a.m.: Castor:
6.6% (6)Louisiana:
5.3% (97,780)
5:30 a.m. to 5:59 a.m.: Castor:
22.2% (22)Louisiana:
5.3% (97,379)
6:00 a.m. to 6:29 a.m.: Castor:
2.1% (2)Louisiana:
10.6% (197,173)
6:30 a.m. to 6:59 a.m.: Castor:
6.6% (6)Louisiana:
10.1% (188,085)
7:00 a.m. to 7:29 a.m.: Castor:
33.5% (33)Louisiana:
15.8% (293,731)
7:30 a.m. to 7:59 a.m.: Castor:
6.8% (7)Louisiana:
11.4% (211,328)
9:00 a.m. to 9:59 a.m.: Castor:
2.1% (2)Louisiana:
5.1% (94,309)
12:00 p.m. to 3:59 p.m.: Castor:
2.1% (2)Louisiana:
5.7% (105,836)
4:00 p.m. to 11:59 p.m.: Castor:
5.4% (5)Louisiana:
5.9% (108,753)
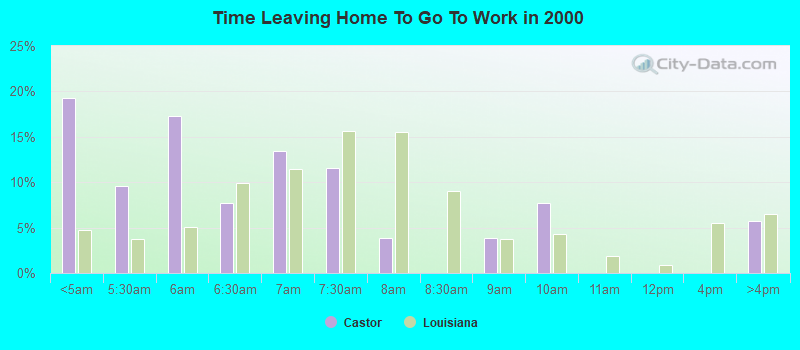
<5am: Castor:
19.2% (10)Louisiana:
4.7% (85,706)
5:30am: Castor:
9.6% (5)Louisiana:
3.7% (67,771)
6am: Castor:
17.3% (9)Louisiana:
5.1% (93,066)
6:30am: Castor:
7.7% (4)Louisiana:
9.9% (180,725)
7am: Castor:
13.5% (7)Louisiana:
11.4% (208,729)
7:30am: Castor:
11.5% (6)Louisiana:
15.7% (287,107)
8am: Castor:
3.8% (2)Louisiana:
15.5% (283,342)
9am: Castor:
3.8% (2)Louisiana:
3.8% (69,191)
10am: Castor:
7.7% (4)Louisiana:
4.3% (79,604)
>4pm: Castor:
5.8% (3)Louisiana:
6.5% (119,441)
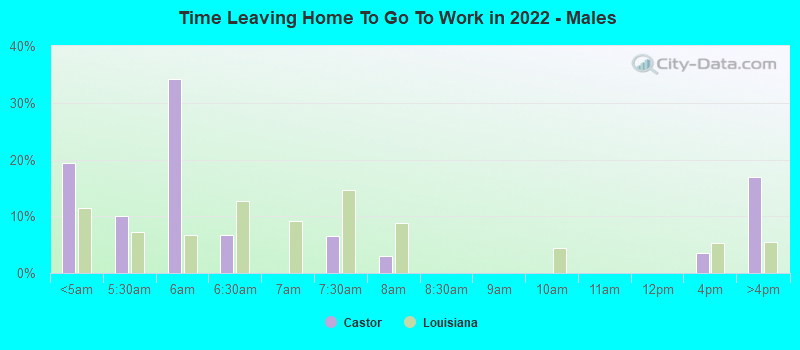
12:00 a.m. to 4:59 a.m. - Males: Castor:
19.4% (6)Louisiana:
11.4% (109,553)
5:00 a.m. to 5:29 a.m. - Males: Castor:
10.0% (3)Louisiana:
7.3% (69,883)
5:30 a.m. to 5:59 a.m. - Males: Castor:
34.1% (10)Louisiana:
6.6% (63,729)
6:00 a.m. to 6:29 a.m. - Males: Castor:
6.7% (2)Louisiana:
12.7% (122,252)
7:00 a.m. to 7:29 a.m. - Males: Castor:
6.6% (2)Louisiana:
14.7% (141,518)
7:30 a.m. to 7:59 a.m. - Males: Castor:
3.0% (1)Louisiana:
8.9% (85,328)
12:00 p.m. to 3:59 p.m. - Males: Castor:
3.5% (1)Louisiana:
5.2% (50,173)
4:00 p.m. to 11:59 p.m. - Males: Castor:
17.0% (5)Louisiana:
5.5% (52,576)
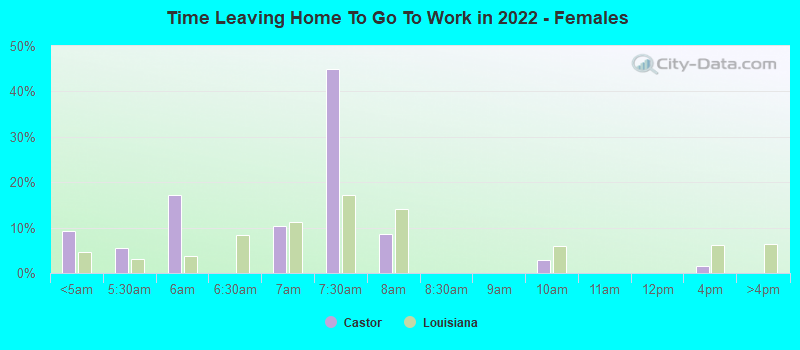
12:00 a.m. to 4:59 a.m. - Females: Castor:
9.2% (6)Louisiana:
4.7% (41,804)
5:00 a.m. to 5:29 a.m. - Females: Castor:
5.5% (4)Louisiana:
3.1% (27,897)
5:30 a.m. to 5:59 a.m. - Females: Castor:
17.2% (12)Louisiana:
3.8% (33,650)
6:30 a.m. to 6:59 a.m. - Females: Castor:
10.3% (7)Louisiana:
11.3% (100,334)
7:00 a.m. to 7:29 a.m. - Females: Castor:
45.0% (30)Louisiana:
17.1% (152,213)
7:30 a.m. to 7:59 a.m. - Females: Castor:
8.7% (6)Louisiana:
14.2% (126,000)
9:00 a.m. to 9:59 a.m. - Females: Castor:
2.9% (2)Louisiana:
5.9% (52,467)
12:00 p.m. to 3:59 p.m. - Females: Castor:
1.5% (1)Louisiana:
6.3% (55,663)
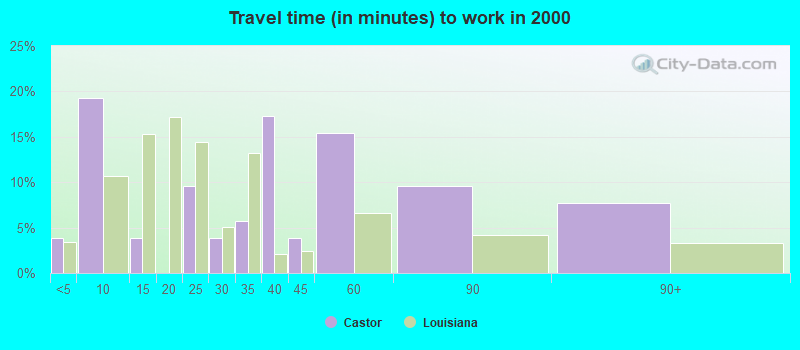
Travel time to work Percentage of workers working in this county: 49.0%
Less than 5 minutes: Castor:
3.8% (2)Louisiana:
3.4% (62,320)
5 to 9 minutes: Castor:
19.2% (10)Louisiana:
10.7% (196,227)
10 to 14 minutes: Castor:
3.8% (2)Louisiana:
15.3% (281,034)
20 to 24 minutes: Castor:
9.6% (5)Louisiana:
14.4% (263,842)
25 to 29 minutes: Castor:
3.8% (2)Louisiana:
5.1% (93,519)
30 to 34 minutes: Castor:
5.8% (3)Louisiana:
13.2% (240,995)
35 to 39 minutes: Castor:
17.3% (9)Louisiana:
2.1% (39,029)
40 to 44 minutes: Castor:
3.8% (2)Louisiana:
2.4% (43,572)
45 to 59 minutes: Castor:
15.4% (8)Louisiana:
6.6% (120,270)
60 to 89 minutes: Castor:
9.6% (5)Louisiana:
4.2% (76,269)
90 or more minutes: Castor:
7.7% (4)Louisiana:
3.3% (59,819)
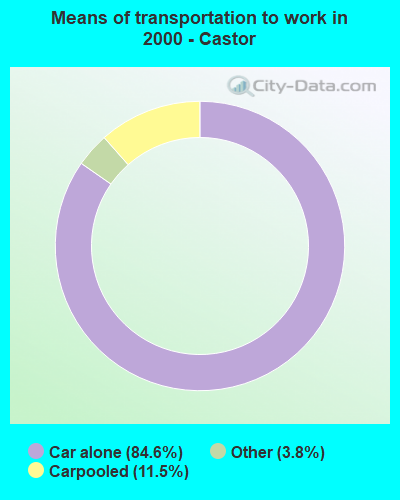
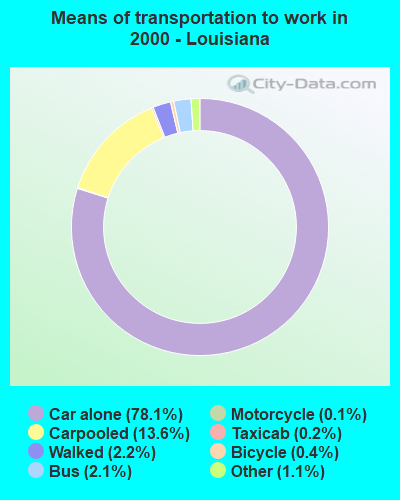
Means of transportation to work Drove car alone: Castor:
84.6% (44)Louisiana:
78.1% (1,430,142)
Carpooled: Castor:
11.5% (6)Louisiana:
13.6% (249,640)
Other means: Castor:
3.8% (2)Louisiana:
1.1% (19,932)
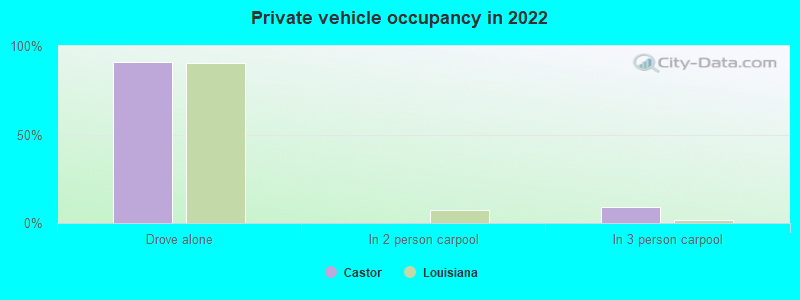
Private vehicle occupancy Drove alone: Castor:
91.0% (80)Louisiana:
90.2% (1,585,743)
In 3 person carpool: Castor:
9.0% (8)Louisiana:
1.7% (29,734)
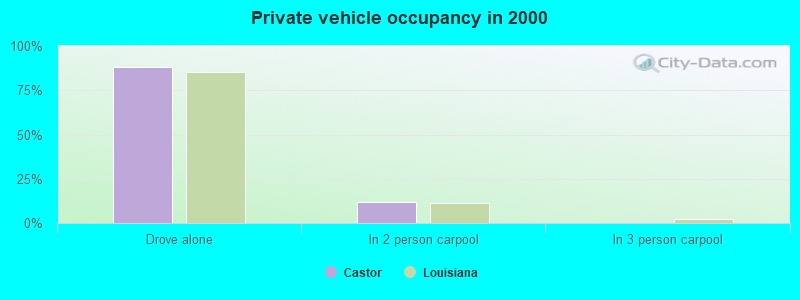
Drove alone: Castor:
88.0% (44)Louisiana:
85.1% (1,430,142)
In 2 person carpool: Castor:
12.0% (6)Louisiana:
11.2% (188,946)
Class of workers
Employee of private company: Castor:
54.1% (54)Louisiana:
64.9% (1,323,254)
Self-employed in own incorporated business: Castor:
6.1% (6)Louisiana:
4.3% (87,972)
Private not-for-profit wage and salary workers: Castor:
4.1% (4)Louisiana:
7.9% (161,710)
Local government workers: Castor:
19.4% (19)Louisiana:
7.6% (154,461)
State government workers: Castor:
13.3% (13)Louisiana:
5.7% (116,390)
Federal government workers: Castor:
1.0% (1)Louisiana:
2.4% (48,815)
Self-employed workers in own not incorporated business: Castor:
2.0% (2)Louisiana:
7.0% (142,134)
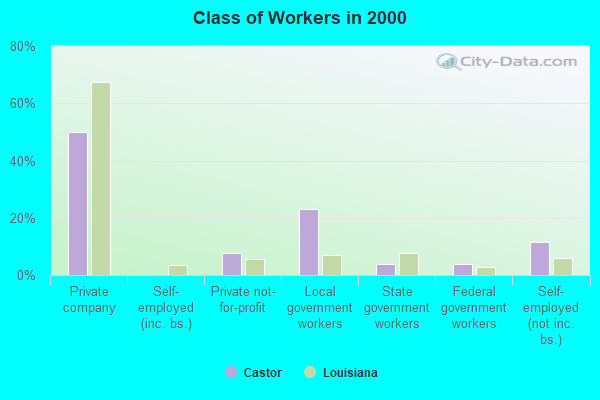
Employee of private company: Castor:
50.0% (26)Louisiana:
67.3% (1,246,955)
Private not-for-profit wage and salary workers: Castor:
7.7% (4)Louisiana:
5.5% (101,490)
Local government workers: Castor:
23.1% (12)Louisiana:
7.1% (131,539)
State government workers: Castor:
3.8% (2)Louisiana:
7.7% (142,060)
Federal government workers: Castor:
3.8% (2)Louisiana:
2.7% (49,172)
Self-employed workers in own not incorporated business: Castor:
11.5% (6)Louisiana:
6.1% (112,275)
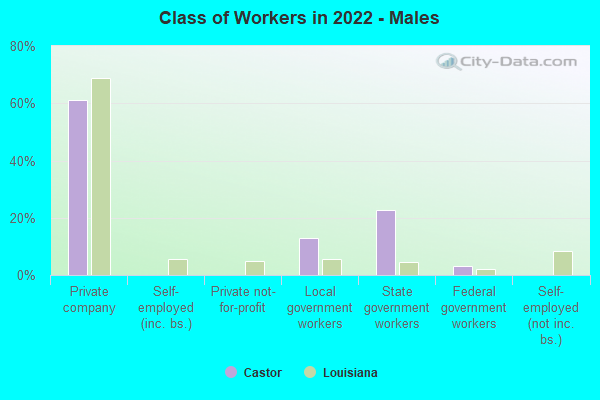
Employee of private company - Males: Castor:
61.3% (19)Louisiana:
68.8% (714,584)
Local government workers - Males: Castor:
12.9% (4)Louisiana:
5.5% (57,257)
State government workers - Males: Castor:
22.6% (7)Louisiana:
4.4% (45,392)
Federal government workers - Males: Castor:
3.2% (1)Louisiana:
2.2% (22,553)
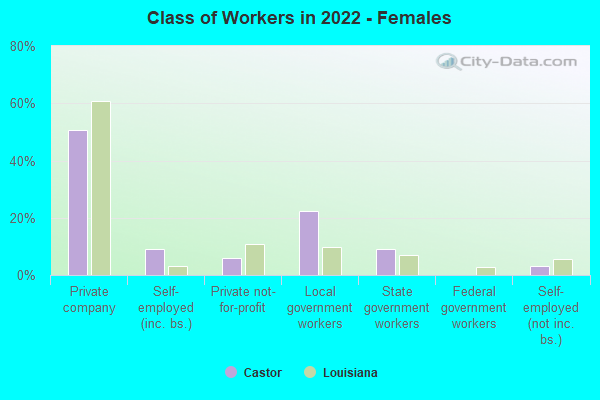
Employee of private company - Females: Castor:
50.7% (34)Louisiana:
60.9% (608,670)
Self-employed in own incorporated business - Females: Castor:
9.0% (6)Louisiana:
3.0% (30,250)
Private not-for-profit wage and salary workers - Females: Castor:
6.0% (4)Louisiana:
10.9% (109,402)
Local government workers - Females: Castor:
22.4% (15)Louisiana:
9.7% (97,204)
State government workers - Females: Castor:
9.0% (6)Louisiana:
7.1% (70,998)
Self-employed workers in own not incorporated business - Females: Castor:
3.0% (2)Louisiana:
5.6% (55,496)