Work and Jobs in Cornelia, Georgia (GA) Detailed Stats
Occupations, Industries, Unemployment, Workers, Commute
Settings
X


Recent posts about work in Cornelia, Georgia on our local forum with over 2,400,000 registered users:
 | NHL open to another expansion franchise in Atlanta (257 replies) |
| Far Northwest GA vs Spencerport-Churchville-Brockport-Fairport (19 replies) |
| Where is $600 apartments N. Georgia? (10 replies) |
| New lanes on I-285 top-end to cost $11B+. Enough to build 55 miles of MARTA rail. (461 replies) |
| NE GA Medical Jobs? (2 replies) |
| Atlanta Passes Miami - Combined Statistical Population (31 replies) |
Latest news about work in Cornelia, GA collected exclusively by city-data.com from local newspapers, TV, and radio stations
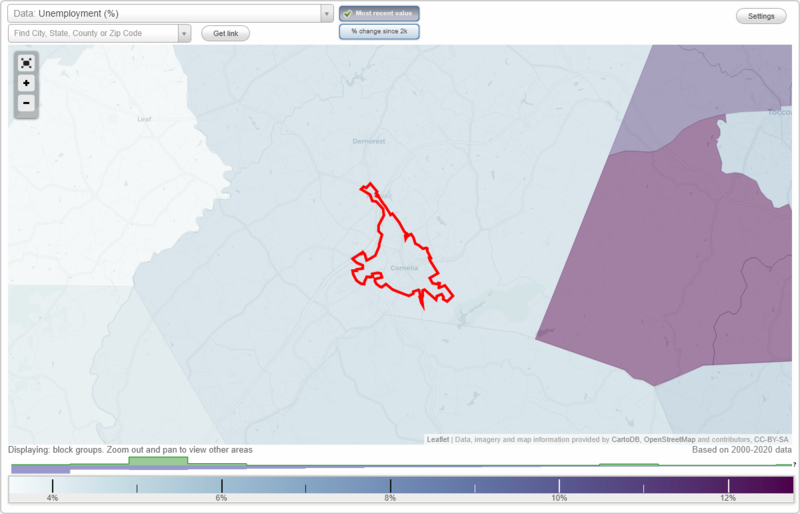
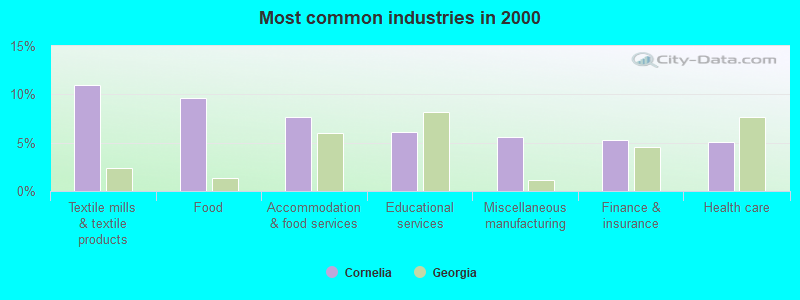
The most common industries in Cornelia are: Textile mills & textile products (11.0% of civilian employees), Food (9.6% of civilian employees), Accommodation & food services (7.6% of civilian employees). 57.0% of workers work in Habersham County and 4.0% of all workers work at home. 80.3% of workers are employees of private companies, which is 14.6% greater than the rate of 68.6% across the entire state of Georgia.
Whole page based on the data from 2000 / 2022 when the population of Cornelia, Georgia was 3,674 / 4,731
Whole page based on the data from 2000 / 2022 when the population of Cornelia, Georgia was 3,674 / 4,731
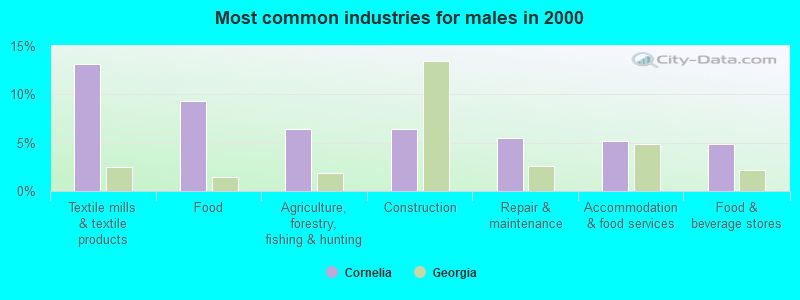
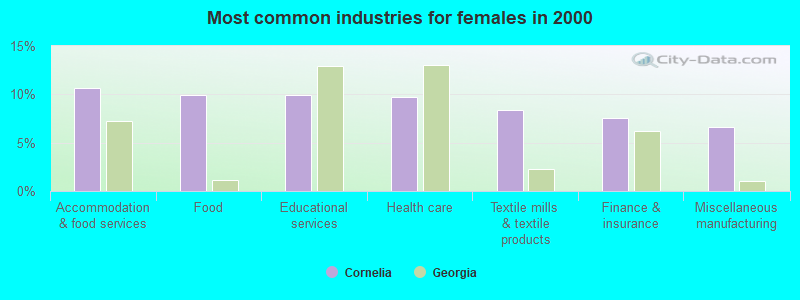
Most common industries
Most common industries | |||
|---|---|---|---|
Industry | All | Males | Females |
| Textile mills and textile products | 11.0% (182) | 13.1% (119) | 8.4% (63) |
| Food | 9.6% (160) | 9.4% (85) | 9.9% (75) |
| Accommodation and food services | 7.6% (127) | 5.2% (47) | 10.6% (80) |
| Educational services | 6.1% (101) | 2.9% (26) | 9.9% (75) |
| Miscellaneous manufacturing | 5.5% (92) | 4.6% (42) | 6.6% (50) |
| Finance and insurance | 5.2% (87) | 3.3% (30) | 7.6% (57) |
| Health care | 5.1% (85) | 1.3% (12) | 9.7% (73) |
| Agriculture, forestry, fishing and hunting | 4.8% (79) | 6.4% (58) | 2.8% (21) |
| Public administration | 4.6% (77) | 3.5% (32) | 6.0% (45) |
| Construction | 4.5% (74) | 6.4% (58) | 2.1% (16) |
| Food and beverage stores | 4.2% (70) | 4.8% (44) | 3.4% (26) |
| Department and other general merchandise stores | 3.4% (57) | 4.1% (37) | 2.7% (20) |
| Building material and garden equipment and supplies dealers | 3.2% (54) | 4.4% (40) | 1.9% (14) |
| Repair and maintenance | 3.0% (50) | 5.5% (50) | 0.0% (0) |
| Real estate and rental and leasing | 2.5% (41) | 2.1% (19) | 2.9% (22) |
| Utilities | 2.2% (36) | 3.3% (30) | 0.8% (6) |
| Administrative and support and waste management services | 1.9% (31) | 2.1% (19) | 1.6% (12) |
| Truck transportation | 1.3% (22) | 0.7% (6) | 2.1% (16) |
| Metal and metal products | 1.2% (20) | 1.3% (12) | 1.1% (8) |
| Motor vehicle and parts dealers | 1.0% (16) | 0.0% (0) | 2.1% (16) |
| Pharmacies and drug stores | 0.7% (11) | 0.2% (2) | 1.2% (9) |
| Chemicals | 0.7% (11) | 0.3% (3) | 1.1% (8) |
| U. S. Postal service | 0.7% (11) | 1.0% (9) | 0.3% (2) |
| Groceries and related products merchant wholesalers | 0.7% (11) | 1.2% (11) | 0.0% (0) |
| Private households | 0.7% (11) | 0.0% (0) | 1.5% (11) |
| Machinery | 0.6% (10) | 1.1% (10) | 0.0% (0) |
| Professional, scientific, and technical services | 0.6% (10) | 1.1% (10) | 0.0% (0) |
| Religious, grantmaking, civic, professional, and similar organizations | 0.6% (10) | 0.9% (8) | 0.3% (2) |
| Wood products | 0.5% (9) | 1.0% (9) | 0.0% (0) |
| Broadcasting and telecommunications | 0.5% (9) | 1.0% (9) | 0.0% (0) |
| Furniture and related product manufacturing | 0.5% (8) | 0.9% (8) | 0.0% (0) |
| Retail florists | 0.5% (8) | 0.3% (3) | 0.7% (5) |
| Publishing, and motion picture and sound recording industries | 0.5% (8) | 0.9% (8) | 0.0% (0) |
| Farm supplies merchant wholesalers | 0.5% (8) | 0.9% (8) | 0.0% (0) |
| Transportation equipment | 0.4% (7) | 0.8% (7) | 0.0% (0) |
| Furniture and home furnishings, and household appliance stores | 0.4% (7) | 0.8% (7) | 0.0% (0) |
| Plastics and rubber products | 0.4% (6) | 0.7% (6) | 0.0% (0) |
| Lumber and other construction materials merchant wholesalers | 0.4% (6) | 0.7% (6) | 0.0% (0) |
| Social assistance | 0.4% (6) | 0.0% (0) | 0.8% (6) |
| Personal and laundry services | 0.4% (6) | 0.7% (6) | 0.0% (0) |
| Apparel | 0.3% (5) | 0.0% (0) | 0.7% (5) |
| Vending machine operators | 0.3% (5) | 0.0% (0) | 0.7% (5) |
| Arts, entertainment, and recreation | 0.3% (5) | 0.0% (0) | 0.7% (5) |
| Management of companies and enterprises | 0.2% (4) | 0.4% (4) | 0.0% (0) |
| Office supplies and stationery stores | 0.2% (4) | 0.3% (3) | 0.1% (1) |
| Motor vehicles, parts and supplies merchant wholesalers | 0.2% (3) | 0.3% (3) | 0.0% (0) |
| Air transportation | 0.1% (2) | 0.2% (2) | 0.0% (0) |
Unemployment in Cornelia
- Unemployment by race in 2022
- Unemployment rate for White non-Hispanic residents
- 2.3%Males
- Unemployment rate for other race residents
- 3.5%Females
- Unemployment rate for Hispanic or Latino residents
- 1.6%Females
- Unemployment by race in 2000
- Unemployment rate for White non-Hispanic residents
- 2.7%Males
- 2.4%Females
- Unemployment rate for Black residents
- 5.6%Females
- Unemployment rate for Asian residents
- 23.3%Females
- Unemployment rate for other race residents
- 3.0%Males
- Unemployment rate for two or more race residents
- 13.6%Males
- Unemployment rate for Hispanic or Latino residents
- 9.9%Males
- 19.2%Females
Time leaving home to go to work
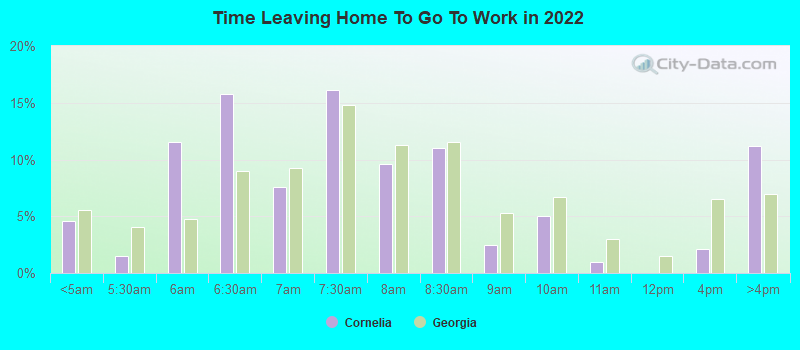
12:00 a.m. to 4:59 a.m.:
| Cornelia: | 4.6% (101) |
| Georgia: | 5.5% (242,137) |
5:00 a.m. to 5:29 a.m.:
| Cornelia: | 1.5% (33) |
| Georgia: | 4.0% (175,149) |
5:30 a.m. to 5:59 a.m.:
| Cornelia: | 11.6% (256) |
| Georgia: | 4.7% (206,203) |
6:00 a.m. to 6:29 a.m.:
| Cornelia: | 15.8% (349) |
| Georgia: | 9.0% (390,544) |
6:30 a.m. to 6:59 a.m.:
| Cornelia: | 7.5% (167) |
| Georgia: | 9.2% (403,440) |
7:00 a.m. to 7:29 a.m.:
| Cornelia: | 16.1% (357) |
| Georgia: | 14.8% (646,529) |
7:30 a.m. to 7:59 a.m.:
| Cornelia: | 9.6% (213) |
| Georgia: | 11.3% (493,495) |
8:00 a.m. to 8:29 a.m.:
| Cornelia: | 11.0% (243) |
| Georgia: | 11.6% (504,252) |
8:30 a.m. to 8:59 a.m.:
| Cornelia: | 2.5% (55) |
| Georgia: | 5.2% (228,810) |
9:00 a.m. to 9:59 a.m.:
| Cornelia: | 5.0% (111) |
| Georgia: | 6.7% (292,455) |
10:00 a.m. to 10:59 a.m.:
| Cornelia: | 1.0% (21) |
| Georgia: | 3.0% (130,615) |
12:00 p.m. to 3:59 p.m.:
| Cornelia: | 2.1% (46) |
| Georgia: | 6.5% (282,958) |
4:00 p.m. to 11:59 p.m.:
| Cornelia: | 11.2% (247) |
| Georgia: | 6.9% (302,787) |
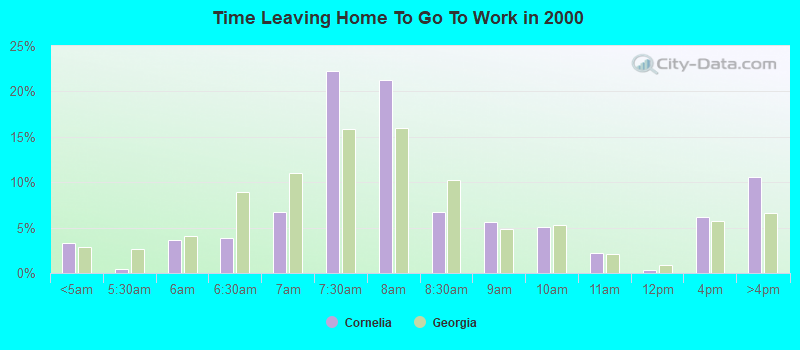
<5am:
| Cornelia: | 3.3% (53) |
| Georgia: | 2.8% (108,019) |
5:30am:
| Cornelia: | 0.5% (8) |
| Georgia: | 2.7% (102,302) |
6am:
| Cornelia: | 3.6% (59) |
| Georgia: | 4.1% (156,682) |
6:30am:
| Cornelia: | 3.8% (62) |
| Georgia: | 9.0% (343,349) |
7am:
| Cornelia: | 6.8% (110) |
| Georgia: | 11.0% (422,728) |
7:30am:
| Cornelia: | 22.2% (361) |
| Georgia: | 15.9% (608,777) |
8am:
| Cornelia: | 21.2% (345) |
| Georgia: | 15.9% (610,869) |
8:30am:
| Cornelia: | 6.8% (110) |
| Georgia: | 10.2% (391,849) |
9am:
| Cornelia: | 5.6% (91) |
| Georgia: | 4.9% (187,692) |
10am:
| Cornelia: | 5.0% (82) |
| Georgia: | 5.3% (204,205) |
11am:
| Cornelia: | 2.2% (36) |
| Georgia: | 2.1% (79,927) |
12pm:
| Cornelia: | 0.3% (5) |
| Georgia: | 0.9% (34,761) |
4pm:
| Cornelia: | 6.2% (100) |
| Georgia: | 5.7% (219,434) |
>4pm:
| Cornelia: | 10.6% (172) |
| Georgia: | 6.6% (253,223) |
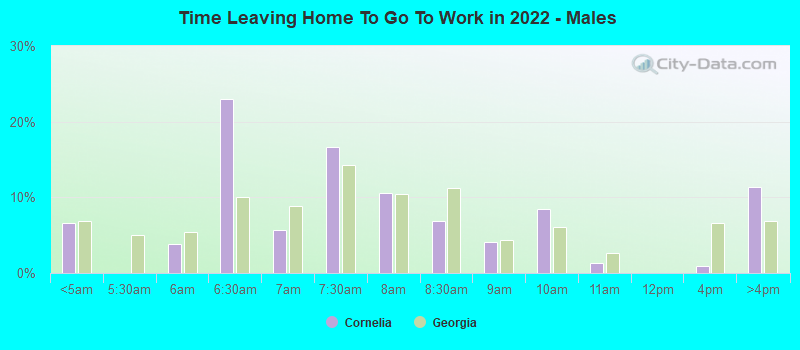
12:00 a.m. to 4:59 a.m. - Males:
| Cornelia: | 6.7% (88) |
| Georgia: | 6.8% (159,003) |
5:30 a.m. to 5:59 a.m. - Males:
| Cornelia: | 3.8% (50) |
| Georgia: | 5.4% (125,930) |
6:00 a.m. to 6:29 a.m. - Males:
| Cornelia: | 23.0% (304) |
| Georgia: | 10.0% (233,694) |
6:30 a.m. to 6:59 a.m. - Males:
| Cornelia: | 5.7% (76) |
| Georgia: | 8.9% (206,712) |
7:00 a.m. to 7:29 a.m. - Males:
| Cornelia: | 16.6% (220) |
| Georgia: | 14.3% (331,758) |
7:30 a.m. to 7:59 a.m. - Males:
| Cornelia: | 10.5% (139) |
| Georgia: | 10.4% (241,448) |
8:00 a.m. to 8:29 a.m. - Males:
| Cornelia: | 6.8% (90) |
| Georgia: | 11.2% (261,504) |
8:30 a.m. to 8:59 a.m. - Males:
| Cornelia: | 4.2% (55) |
| Georgia: | 4.4% (101,712) |
9:00 a.m. to 9:59 a.m. - Males:
| Cornelia: | 8.5% (112) |
| Georgia: | 6.1% (142,843) |
10:00 a.m. to 10:59 a.m. - Males:
| Cornelia: | 1.3% (17) |
| Georgia: | 2.7% (62,644) |
12:00 p.m. to 3:59 p.m. - Males:
| Cornelia: | 0.9% (12) |
| Georgia: | 6.6% (152,923) |
4:00 p.m. to 11:59 p.m. - Males:
| Cornelia: | 11.3% (150) |
| Georgia: | 6.9% (159,934) |
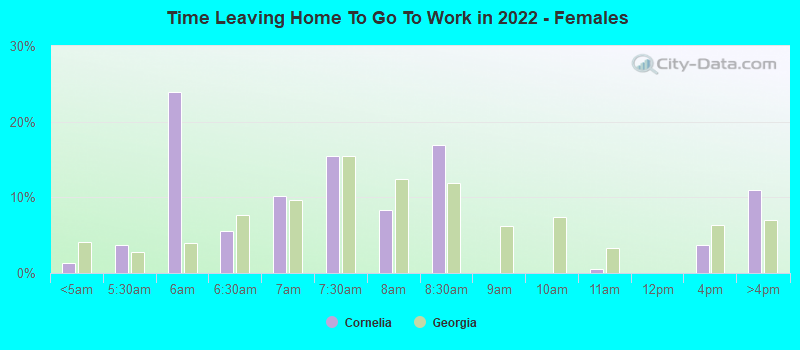
12:00 a.m. to 4:59 a.m. - Females:
| Cornelia: | 1.3% (11) |
| Georgia: | 4.1% (83,134) |
5:00 a.m. to 5:29 a.m. - Females:
| Cornelia: | 3.7% (33) |
| Georgia: | 2.8% (57,000) |
5:30 a.m. to 5:59 a.m. - Females:
| Cornelia: | 23.9% (213) |
| Georgia: | 3.9% (80,273) |
6:00 a.m. to 6:29 a.m. - Females:
| Cornelia: | 5.6% (49) |
| Georgia: | 7.7% (156,850) |
6:30 a.m. to 6:59 a.m. - Females:
| Cornelia: | 10.2% (91) |
| Georgia: | 9.7% (196,728) |
7:00 a.m. to 7:29 a.m. - Females:
| Cornelia: | 15.4% (137) |
| Georgia: | 15.5% (314,771) |
7:30 a.m. to 7:59 a.m. - Females:
| Cornelia: | 8.4% (75) |
| Georgia: | 12.4% (252,047) |
8:00 a.m. to 8:29 a.m. - Females:
| Cornelia: | 16.9% (150) |
| Georgia: | 11.9% (242,748) |
10:00 a.m. to 10:59 a.m. - Females:
| Cornelia: | 0.5% (5) |
| Georgia: | 3.3% (67,971) |
12:00 p.m. to 3:59 p.m. - Females:
| Cornelia: | 3.7% (33) |
| Georgia: | 6.4% (130,035) |
4:00 p.m. to 11:59 p.m. - Females:
| Cornelia: | 10.9% (97) |
| Georgia: | 7.0% (142,853) |
Travel time to work
Percentage of workers working in this county: 57.0%
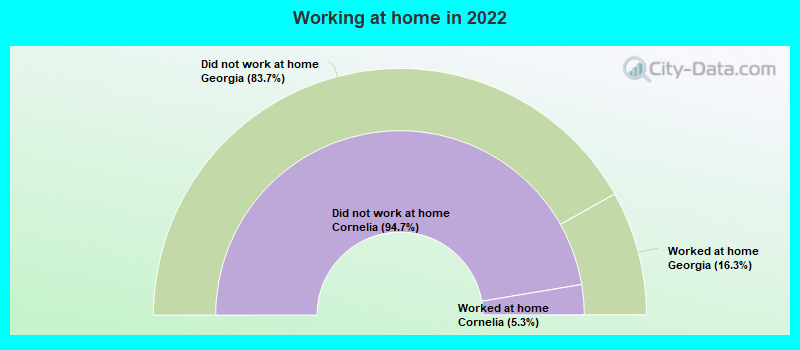
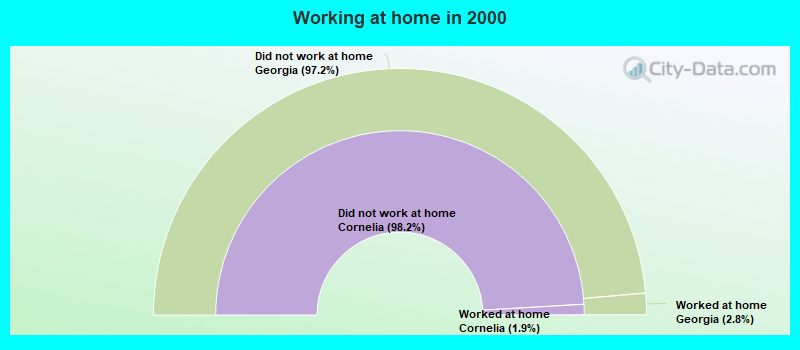
Number of people working at home: 95 (4.0% of all workers)
Daytime population change due to commuting: +3,305 (+90.0%)
Workers who live and work in this city: 717 (44.2%)
Number of people working at home: 95 (4.0% of all workers)
Daytime population change due to commuting: +3,305 (+90.0%)
Workers who live and work in this city: 717 (44.2%)
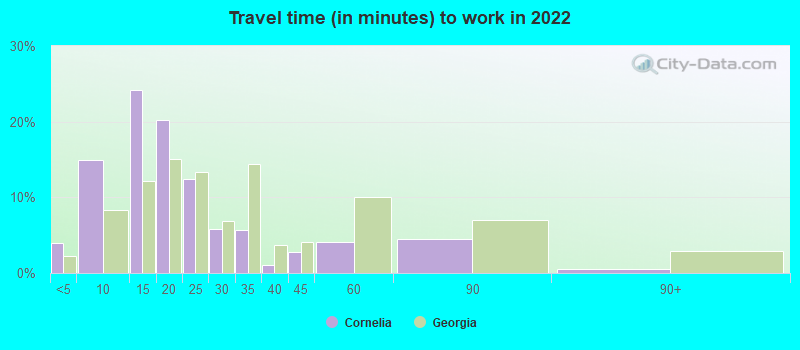
Less than 5 minutes:
| Cornelia: | 4.0% (171) |
| Georgia: | 2.3% (99,412) |
5 to 9 minutes:
| Cornelia: | 14.9% (634) |
| Georgia: | 8.3% (361,685) |
10 to 14 minutes:
| Cornelia: | 24.1% (1,029) |
| Georgia: | 12.1% (528,166) |
15 to 19 minutes:
| Cornelia: | 20.3% (864) |
| Georgia: | 15.0% (654,952) |
20 to 24 minutes:
| Cornelia: | 12.5% (532) |
| Georgia: | 13.4% (584,595) |
25 to 29 minutes:
| Cornelia: | 5.9% (250) |
| Georgia: | 6.8% (298,541) |
30 to 34 minutes:
| Cornelia: | 5.7% (245) |
| Georgia: | 14.4% (627,542) |
35 to 39 minutes:
| Cornelia: | 1.0% (45) |
| Georgia: | 3.7% (163,276) |
40 to 44 minutes:
| Cornelia: | 2.7% (117) |
| Georgia: | 4.1% (180,851) |
45 to 59 minutes:
| Cornelia: | 4.1% (175) |
| Georgia: | 10.0% (437,424) |
60 to 89 minutes:
| Cornelia: | 4.5% (194) |
| Georgia: | 7.0% (303,546) |
90 or more minutes:
| Cornelia: | 0.5% (20) |
| Georgia: | 2.8% (124,186) |
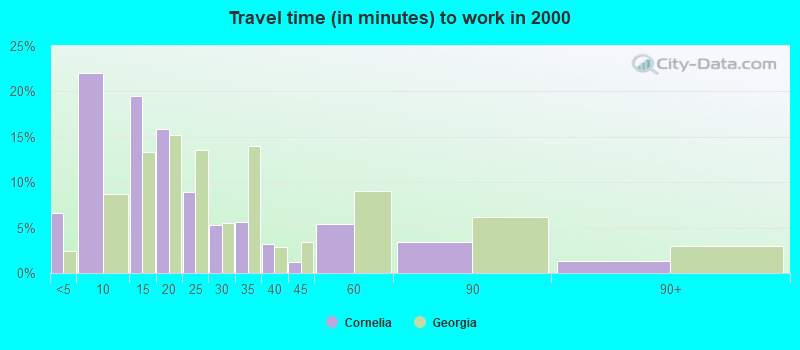
Less than 5 minutes:
| Cornelia: | 6.6% (107) |
| Georgia: | 2.4% (93,446) |
5 to 9 minutes:
| Cornelia: | 22.0% (357) |
| Georgia: | 8.7% (334,403) |
10 to 14 minutes:
| Cornelia: | 19.5% (316) |
| Georgia: | 13.3% (511,628) |
15 to 19 minutes:
| Cornelia: | 15.9% (258) |
| Georgia: | 15.2% (583,820) |
20 to 24 minutes:
| Cornelia: | 8.9% (145) |
| Georgia: | 13.6% (519,875) |
25 to 29 minutes:
| Cornelia: | 5.3% (86) |
| Georgia: | 5.5% (209,374) |
30 to 34 minutes:
| Cornelia: | 5.6% (91) |
| Georgia: | 14.0% (535,531) |
35 to 39 minutes:
| Cornelia: | 3.1% (51) |
| Georgia: | 2.8% (108,867) |
40 to 44 minutes:
| Cornelia: | 1.2% (19) |
| Georgia: | 3.4% (132,121) |
45 to 59 minutes:
| Cornelia: | 5.4% (88) |
| Georgia: | 9.1% (347,610) |
60 to 89 minutes:
| Cornelia: | 3.4% (55) |
| Georgia: | 6.1% (234,588) |
90 or more minutes:
| Cornelia: | 1.3% (21) |
| Georgia: | 2.9% (112,554) |
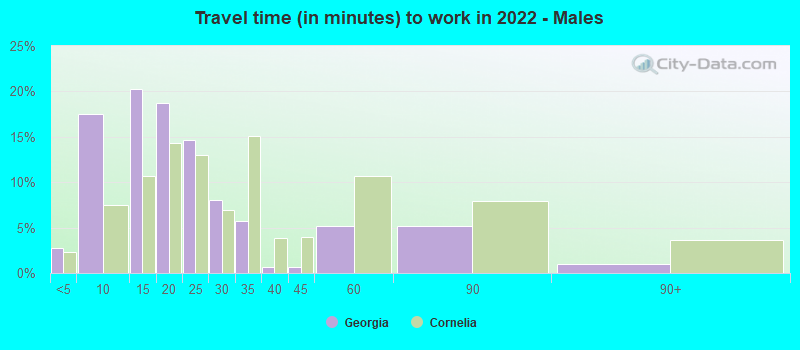
Less than 5 minutes - Males:
| Cornelia: | 2.7% (59) |
| Georgia: | 2.3% (54,145) |
5 to 9 minutes - Males:
| Cornelia: | 17.5% (379) |
| Georgia: | 7.5% (174,640) |
10 to 14 minutes - Males:
| Cornelia: | 20.3% (441) |
| Georgia: | 10.7% (249,464) |
15 to 19 minutes - Males:
| Cornelia: | 18.7% (407) |
| Georgia: | 14.3% (333,733) |
20 to 24 minutes - Males:
| Cornelia: | 14.6% (318) |
| Georgia: | 13.0% (303,241) |
25 to 29 minutes - Males:
| Cornelia: | 8.0% (175) |
| Georgia: | 7.0% (162,248) |
30 to 34 minutes - Males:
| Cornelia: | 5.7% (124) |
| Georgia: | 15.1% (351,130) |
35 to 39 minutes - Males:
| Cornelia: | 0.7% (15) |
| Georgia: | 3.8% (89,464) |
40 to 44 minutes - Males:
| Cornelia: | 0.6% (14) |
| Georgia: | 4.0% (93,184) |
45 to 59 minutes - Males:
| Cornelia: | 5.2% (113) |
| Georgia: | 10.6% (247,557) |
60 to 89 minutes - Males:
| Cornelia: | 5.2% (112) |
| Georgia: | 7.9% (183,852) |
90 or more minutes - Males:
| Cornelia: | 1.0% (21) |
| Georgia: | 3.6% (83,280) |
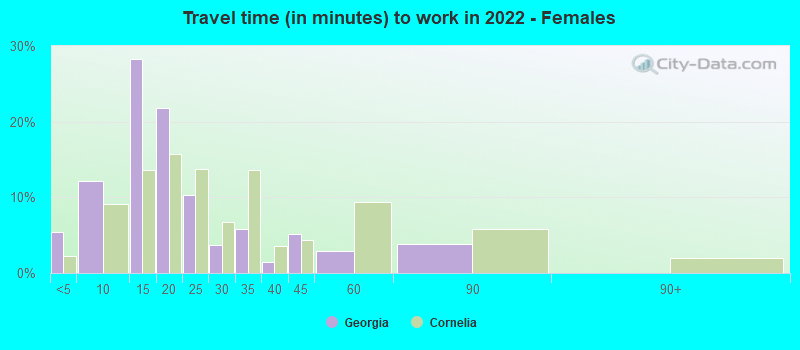
Less than 5 minutes - Females:
| Cornelia: | 5.4% (112) |
| Georgia: | 2.2% (45,267) |
5 to 9 minutes - Females:
| Cornelia: | 12.2% (255) |
| Georgia: | 9.2% (187,045) |
10 to 14 minutes - Females:
| Cornelia: | 28.2% (590) |
| Georgia: | 13.7% (278,702) |
15 to 19 minutes - Females:
| Cornelia: | 21.9% (457) |
| Georgia: | 15.8% (321,219) |
20 to 24 minutes - Females:
| Cornelia: | 10.3% (215) |
| Georgia: | 13.8% (281,354) |
25 to 29 minutes - Females:
| Cornelia: | 3.7% (78) |
| Georgia: | 6.7% (136,293) |
30 to 34 minutes - Females:
| Cornelia: | 5.8% (120) |
| Georgia: | 13.6% (276,412) |
35 to 39 minutes - Females:
| Cornelia: | 1.4% (29) |
| Georgia: | 3.6% (73,812) |
40 to 44 minutes - Females:
| Cornelia: | 5.2% (108) |
| Georgia: | 4.3% (87,667) |
45 to 59 minutes - Females:
| Cornelia: | 3.0% (62) |
| Georgia: | 9.3% (189,867) |
60 to 89 minutes - Females:
| Cornelia: | 3.9% (81) |
| Georgia: | 5.9% (119,694) |
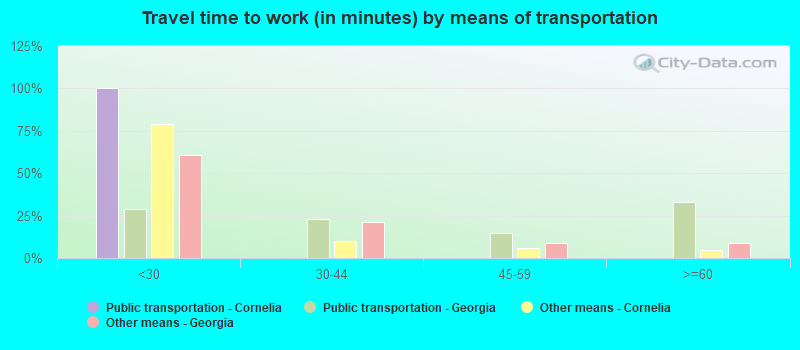
Means of transportation to work
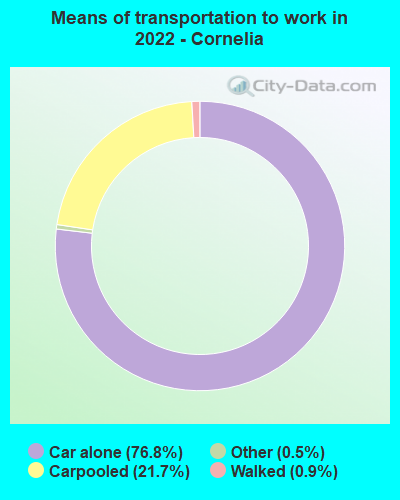
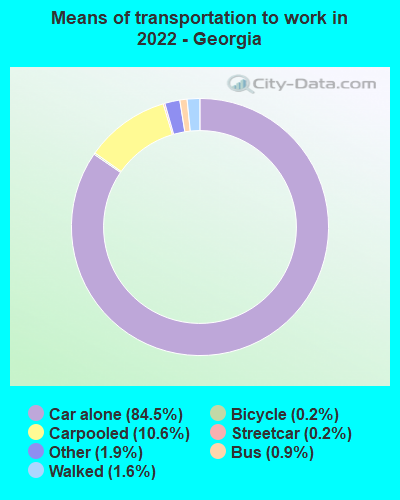
Drove car alone:
| Cornelia: | 76.8% (3,436) |
| Georgia: | 84.5% (1,726,159) |
Carpooled:
| Cornelia: | 21.7% (972) |
| Georgia: | 10.6% (221,187) |
Walked:
| Cornelia: | 0.9% (41) |
| Georgia: | 1.6% (28,577) |
Other means:
| Cornelia: | 0.5% (24) |
| Georgia: | 1.9% (35,874) |
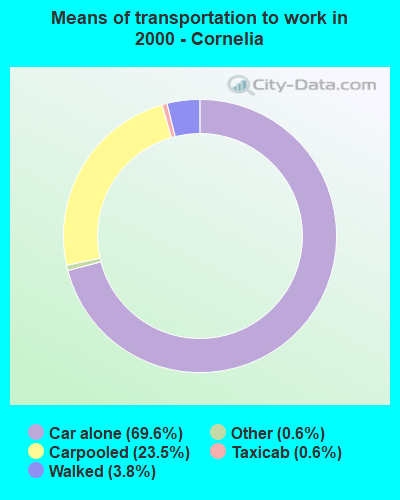
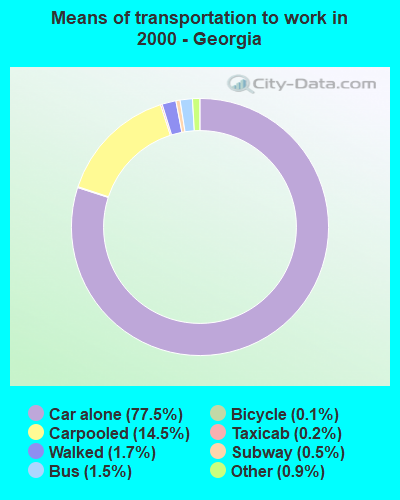
Drove car alone:
| Cornelia: | 69.6% (1,131) |
| Georgia: | 77.5% (2,968,910) |
Carpooled:
| Cornelia: | 23.5% (382) |
| Georgia: | 14.5% (557,062) |
Taxicab:
| Cornelia: | 0.6% (10) |
| Georgia: | 0.2% (7,572) |
Walked:
| Cornelia: | 3.8% (62) |
| Georgia: | 1.7% (65,776) |
Other means:
| Cornelia: | 0.6% (9) |
| Georgia: | 0.9% (33,396) |
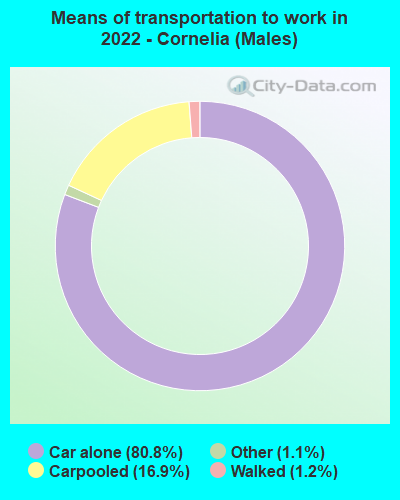

Drove car alone - Males:
| Cornelia: | 80.8% (1,817) |
| Georgia: | 84.2% (1,726,159) |
Carpooled - Males:
| Cornelia: | 16.9% (380) |
| Georgia: | 10.4% (221,187) |
Walked - Males:
| Cornelia: | 1.2% (28) |
| Georgia: | 1.7% (28,577) |
Other means - Males:
| Cornelia: | 1.1% (24) |
| Georgia: | 2.1% (35,874) |
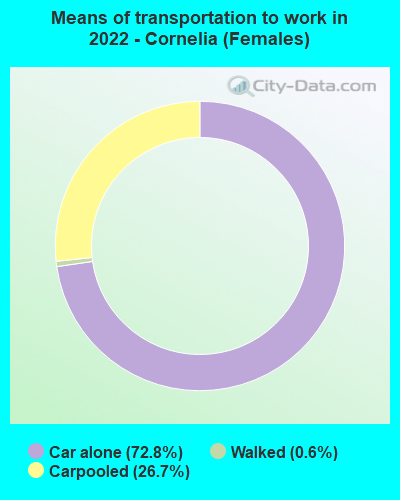

Drove car alone - Females:
| Cornelia: | 72.8% (1,619) |
| Georgia: | 84.7% (1,726,159) |
Carpooled - Females:
| Cornelia: | 26.7% (593) |
| Georgia: | 10.9% (221,187) |
Walked - Females:
| Cornelia: | 0.6% (13) |
| Georgia: | 1.4% (28,577) |
Private vehicle occupancy
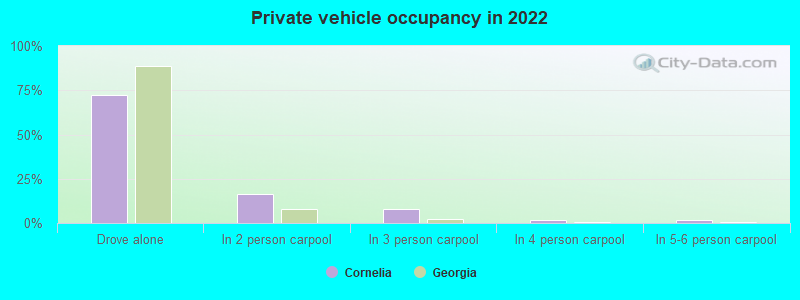
Drove alone:
| Cornelia: | 72.2% (1,434) |
| Georgia: | 88.7% (3,677,830) |
In 2 person carpool:
| Cornelia: | 16.2% (321) |
| Georgia: | 8.0% (330,754) |
In 3 person carpool:
| Cornelia: | 8.1% (161) |
| Georgia: | 2.0% (84,634) |
In 4 person carpool:
| Cornelia: | 1.7% (34) |
| Georgia: | 0.8% (32,435) |
In 5-6 person carpool:
| Cornelia: | 1.8% (36) |
| Georgia: | 0.3% (13,171) |
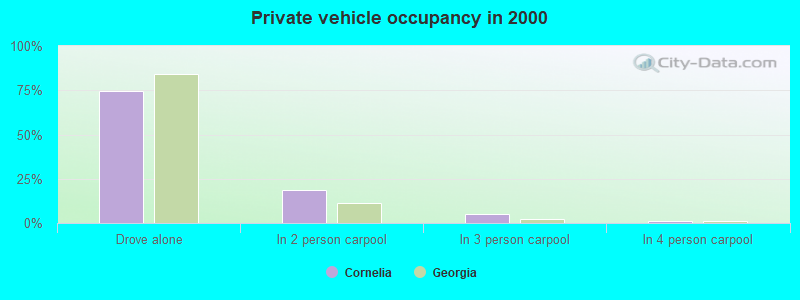
Drove alone:
| Cornelia: | 74.8% (1,131) |
| Georgia: | 84.2% (2,968,910) |
In 2 person carpool:
| Cornelia: | 18.6% (282) |
| Georgia: | 11.5% (406,954) |
In 3 person carpool:
| Cornelia: | 5.0% (76) |
| Georgia: | 2.5% (87,725) |
In 4 person carpool:
| Cornelia: | 0.9% (14) |
| Georgia: | 1.0% (34,505) |
In 5-6 person carpool:
| Cornelia: | 0.7% (10) |
| Georgia: | 0.5% (18,718) |
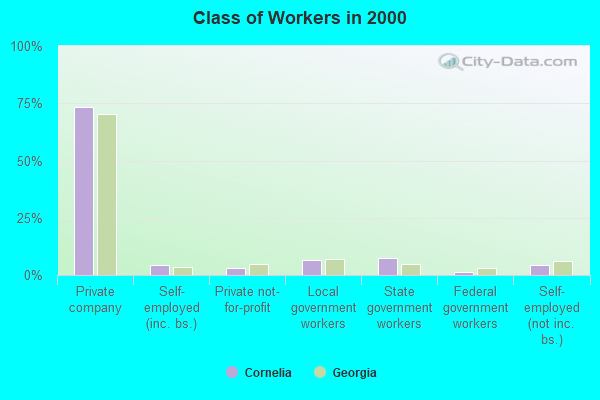
Class of workers
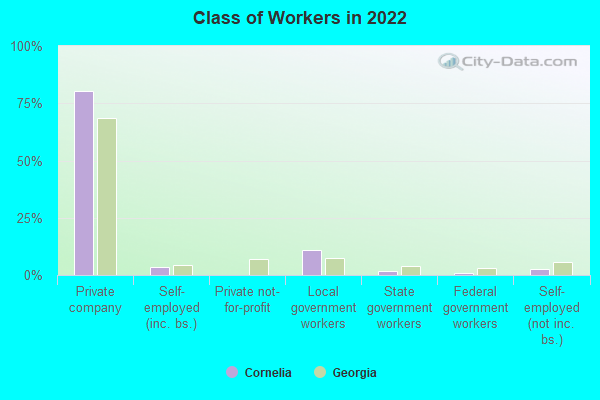
Employee of private company:
| Cornelia: | 80.3% (1,951) |
| Georgia: | 68.6% (3,616,681) |
Self-employed in own incorporated business:
| Cornelia: | 3.6% (87) |
| Georgia: | 4.4% (234,196) |
Local government workers:
| Cornelia: | 10.9% (265) |
| Georgia: | 7.3% (382,883) |
State government workers:
| Cornelia: | 1.7% (42) |
| Georgia: | 3.7% (197,066) |
Federal government workers:
| Cornelia: | 1.0% (25) |
| Georgia: | 3.2% (167,144) |
Self-employed workers in own not incorporated business:
| Cornelia: | 2.5% (60) |
| Georgia: | 5.7% (300,564) |
Employee of private company:
| Cornelia: | 73.2% (1,217) |
| Georgia: | 70.5% (2,705,775) |
Self-employed in own incorporated business:
| Cornelia: | 4.3% (71) |
| Georgia: | 3.6% (137,778) |
Private not-for-profit wage and salary workers:
| Cornelia: | 3.1% (51) |
| Georgia: | 4.8% (185,815) |
Local government workers:
| Cornelia: | 6.5% (108) |
| Georgia: | 6.9% (265,340) |
State government workers:
| Cornelia: | 7.2% (120) |
| Georgia: | 5.0% (190,664) |
Federal government workers:
| Cornelia: | 1.1% (19) |
| Georgia: | 3.1% (118,038) |
Self-employed workers in own not incorporated business:
| Cornelia: | 4.3% (71) |
| Georgia: | 5.9% (226,595) |
Unpaid family workers:
| Cornelia: | 0.3% (5) |
| Georgia: | 0.3% (9,751) |
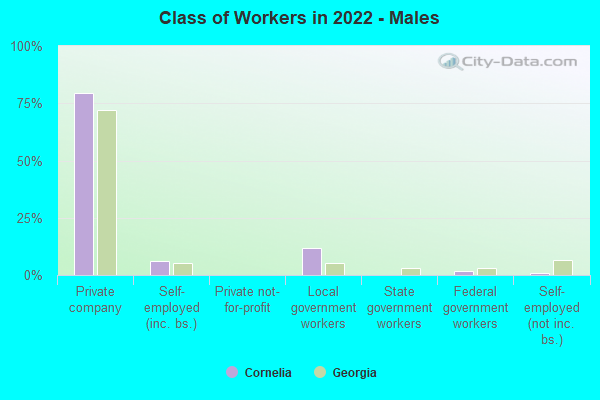
Employee of private company - Males:
| Cornelia: | 79.7% (1,116) |
| Georgia: | 71.9% (1,957,505) |
Self-employed in own incorporated business - Males:
| Cornelia: | 6.0% (84) |
| Georgia: | 5.4% (146,501) |
Local government workers - Males:
| Cornelia: | 11.7% (163) |
| Georgia: | 5.1% (138,226) |
Federal government workers - Males:
| Cornelia: | 1.8% (25) |
| Georgia: | 3.0% (82,423) |
Self-employed workers in own not incorporated business - Males:
| Cornelia: | 0.9% (12) |
| Georgia: | 6.6% (180,413) |
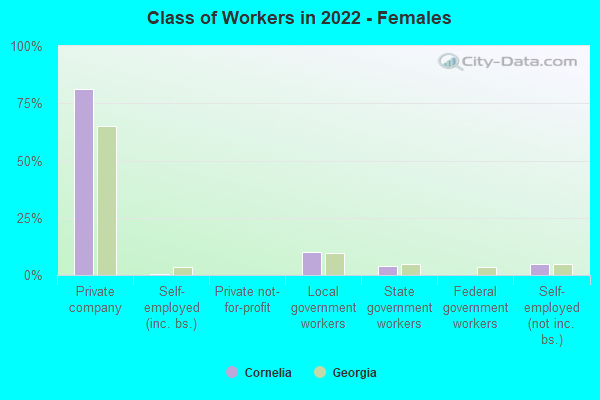
Employee of private company - Females:
| Cornelia: | 81.1% (835) |
| Georgia: | 65.1% (1,659,176) |
Self-employed in own incorporated business - Females:
| Cornelia: | 0.3% (3) |
| Georgia: | 3.4% (87,695) |
Local government workers - Females:
| Cornelia: | 9.9% (102) |
| Georgia: | 9.6% (244,657) |
State government workers - Females:
| Cornelia: | 4.0% (42) |
| Georgia: | 4.6% (118,404) |
Self-employed workers in own not incorporated business - Females:
| Cornelia: | 4.6% (48) |
| Georgia: | 4.7% (120,151) |