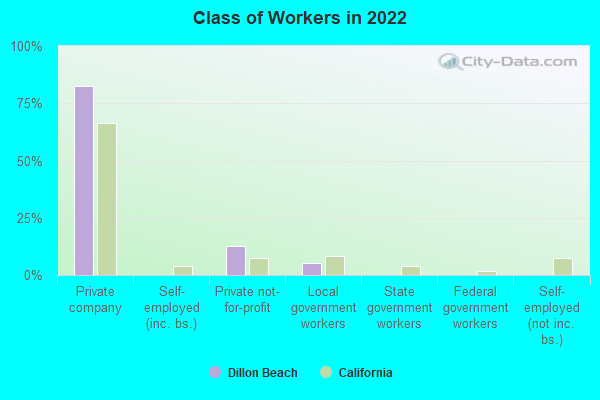
56.1% of workers work in Marin County and 33.8% of all workers work at home. 82.3% of workers are employees of private companies, which is 19.2% greater than the rate of 66.5% across the entire state of California.
Whole page based on the data from 2000 / 2022 when the population of Dillon Beach, California was 319 / 434
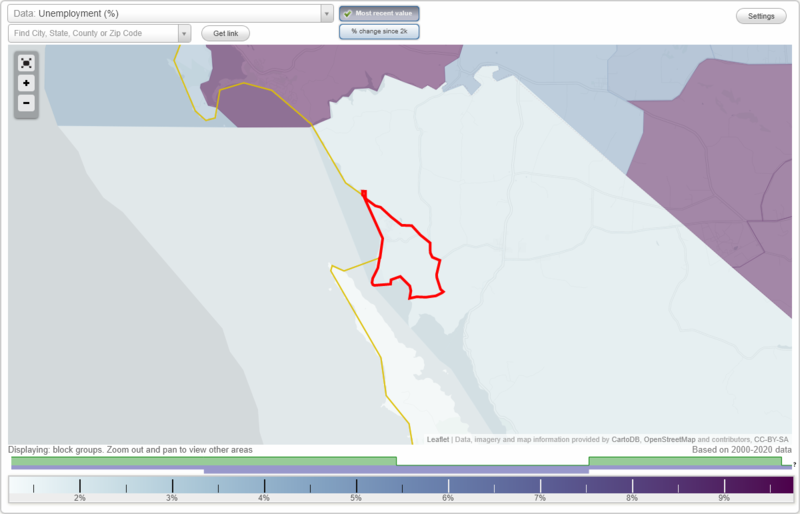
Unemployment in Dillon Beach
Unemployment by race in 2022
Unemployment rate for White non-Hispanic residents
20.4%Females
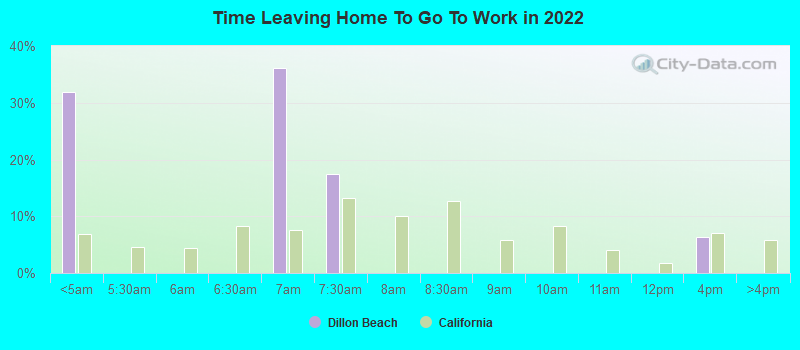
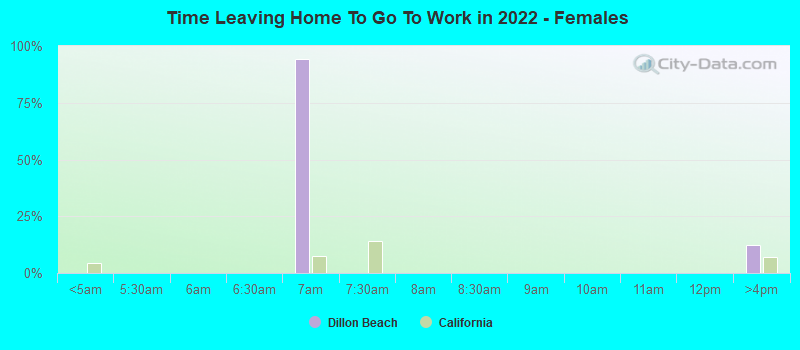
Time leaving home to go to work
12:00 a.m. to 4:59 a.m.:
Dillon Beach:
31.9% (37)
California:
6.8% (1,050,902)
6:30 a.m. to 6:59 a.m.:
Dillon Beach:
36.1% (42)
California:
7.5% (1,156,338)
7:00 a.m. to 7:29 a.m.:
Dillon Beach:
17.5% (20)
California:
13.2% (2,027,702)
12:00 p.m. to 3:59 p.m.:
Dillon Beach:
6.3% (7)
California:
7.0% (1,075,505)
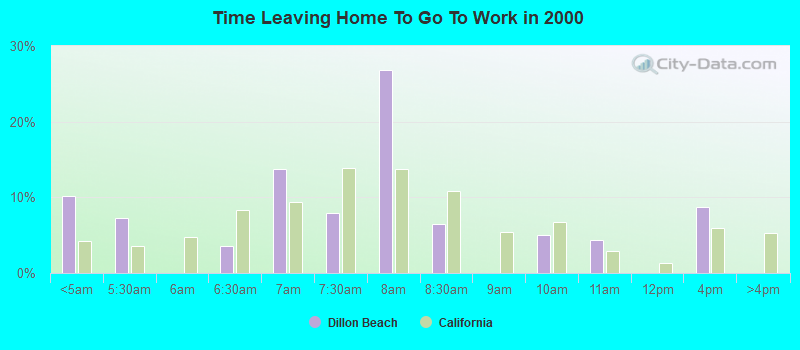
<5am:
Dillon Beach:
10.1% (14)
California:
4.2% (606,086)
5:30am:
Dillon Beach:
7.2% (10)
California:
3.6% (523,209)
6:30am:
Dillon Beach:
3.6% (5)
California:
8.4% (1,216,867)
7am:
Dillon Beach:
13.8% (19)
California:
9.4% (1,362,830)
7:30am:
Dillon Beach:
8.0% (11)
California:
13.8% (2,006,950)
8am:
Dillon Beach:
26.8% (37)
California:
13.7% (1,986,831)
8:30am:
Dillon Beach:
6.5% (9)
California:
10.9% (1,577,815)
10am:
Dillon Beach:
5.1% (7)
California:
6.7% (972,355)
11am:
Dillon Beach:
4.3% (6)
California:
2.9% (414,479)
4pm:
Dillon Beach:
8.7% (12)
California:
6.0% (865,284)
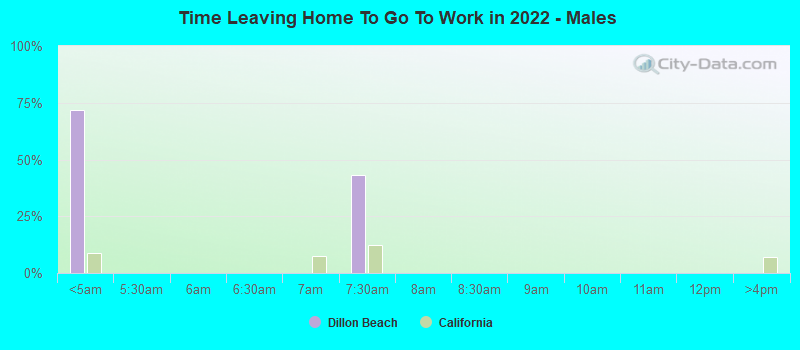
12:00 a.m. to 4:59 a.m. - Males:
Dillon Beach:
71.8% (39)
California:
8.7% (747,612)
7:00 a.m. to 7:29 a.m. - Males:
Dillon Beach:
43.3% (24)
California:
12.4% (1,058,532)
6:30 a.m. to 6:59 a.m. - Females:
Dillon Beach:
94.4% (57)
California:
7.3% (498,781)
12:00 p.m. to 3:59 p.m. - Females:
Dillon Beach:
12.5% (8)
California:
7.0% (480,658)
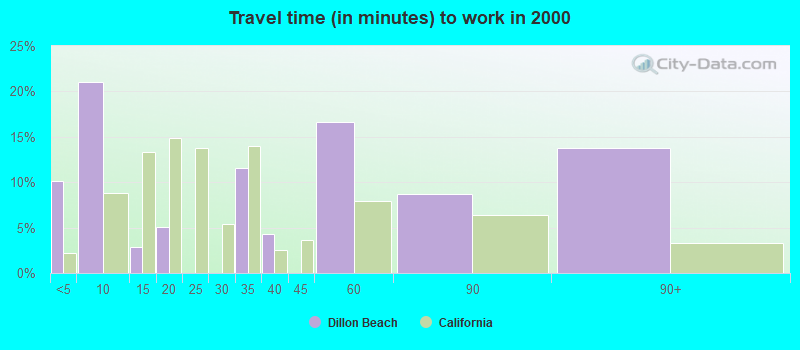
Travel time to work
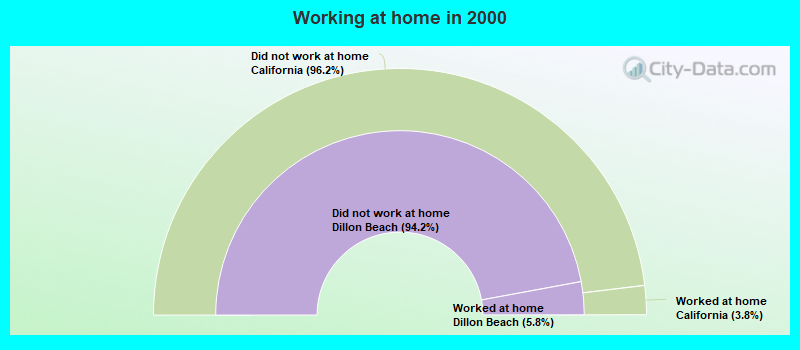
Percentage of workers working in this county: 56.1% Number of people working at home: 64 (33.8% of all workers)
Less than 5 minutes:
Dillon Beach:
10.1% (14)
California:
2.2% (324,703)
5 to 9 minutes:
Dillon Beach:
21.0% (29)
California:
8.8% (1,280,443)
10 to 14 minutes:
Dillon Beach:
2.9% (4)
California:
13.3% (1,930,263)
15 to 19 minutes:
Dillon Beach:
5.1% (7)
California:
14.9% (2,157,970)
30 to 34 minutes:
Dillon Beach:
11.6% (16)
California:
13.9% (2,025,657)
35 to 39 minutes:
Dillon Beach:
4.3% (6)
California:
2.5% (366,487)
45 to 59 minutes:
Dillon Beach:
16.7% (23)
California:
7.9% (1,151,598)
60 to 89 minutes:
Dillon Beach:
8.7% (12)
California:
6.4% (933,123)
90 or more minutes:
Dillon Beach:
13.8% (19)
California:
3.3% (483,698)
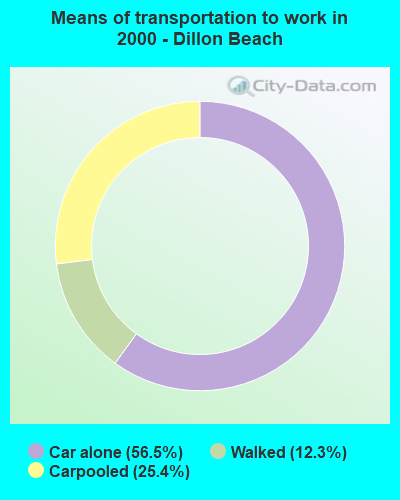
Means of transportation to work
Drove car alone:
Dillon Beach:
56.5% (78)
California:
71.8% (10,432,462)
Carpooled:
Dillon Beach:
25.4% (35)
California:
14.5% (2,113,313)
Walked:
Dillon Beach:
12.3% (17)
California:
2.9% (414,581)
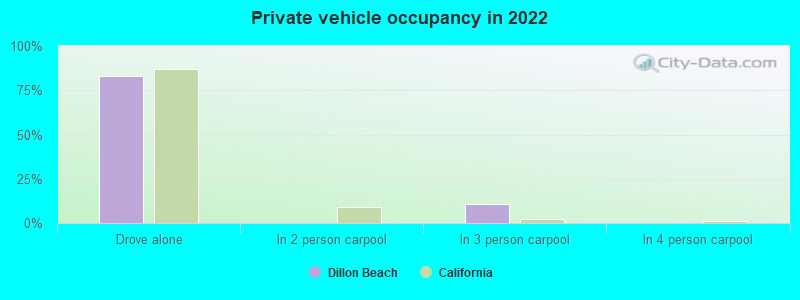
Private vehicle occupancy
Drove alone:
Dillon Beach:
83.3% (93)
California:
86.9% (12,187,486)
In 3 person carpool:
Dillon Beach:
10.7% (12)
California:
2.2% (309,969)
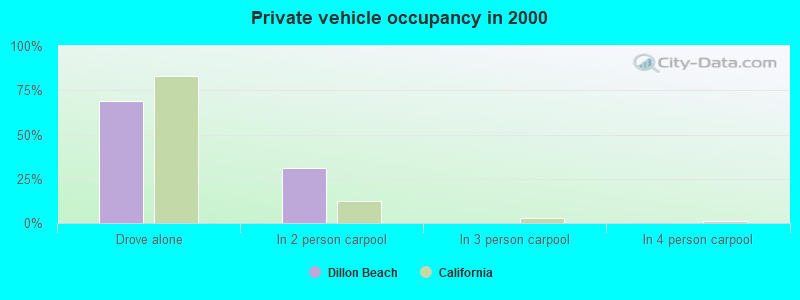
Drove alone:
Dillon Beach:
69.0% (78)
California:
83.2% (10,432,462)
In 2 person carpool:
Dillon Beach:
31.0% (35)
California:
12.5% (1,564,905)
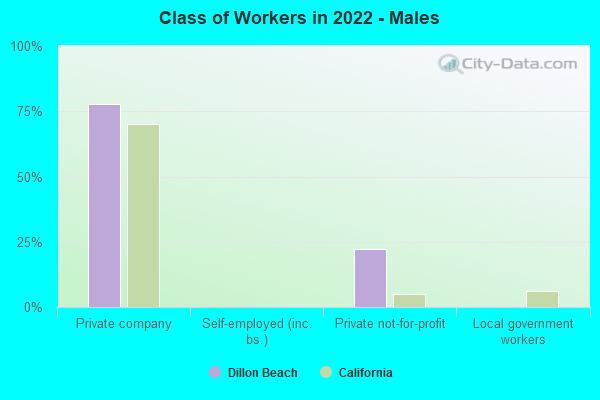
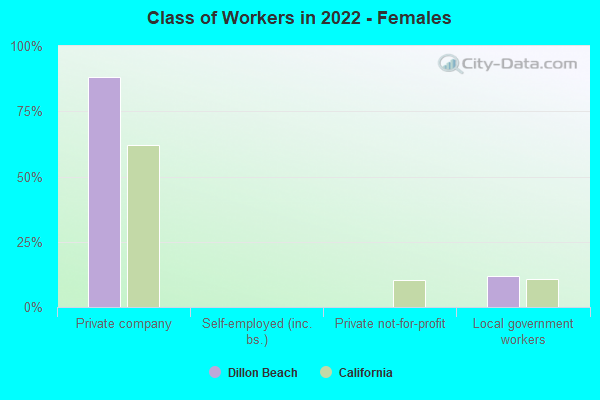
Class of workers
Employee of private company:
Dillon Beach:
82.3% (158)
California:
66.5% (12,596,030)
Private not-for-profit wage and salary workers:
Dillon Beach:
12.6% (24)
California:
7.5% (1,417,407)
Local government workers:
Dillon Beach:
5.1% (10)
California:
8.2% (1,547,056)
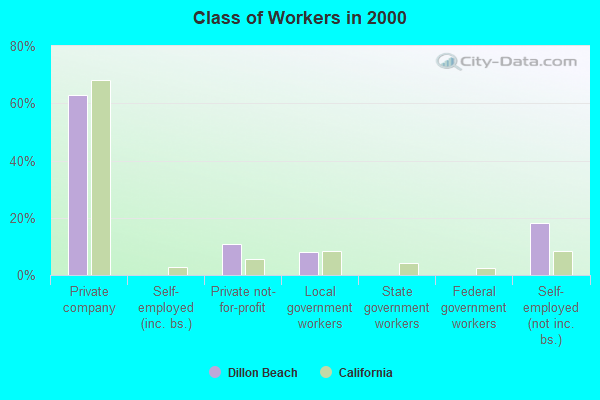
Employee of private company:
Dillon Beach:
63.0% (87)
California:
68.0% (10,009,465)
Private not-for-profit wage and salary workers:
Dillon Beach:
10.9% (15)
California:
5.7% (845,536)
Local government workers:
Dillon Beach:
8.0% (11)
California:
8.3% (1,218,764)
Self-employed workers in own not incorporated business:
Dillon Beach:
18.1% (25)
California:
8.5% (1,249,530)
Employee of private company - Males:
Dillon Beach:
77.9% (85)
California:
70.3% (7,191,252)
Private not-for-profit wage and salary workers - Males:
Dillon Beach:
22.1% (24)
California:
5.2% (529,122)
Employee of private company - Females:
Dillon Beach:
88.2% (73)
California:
62.0% (5,404,778)
Local government workers - Females:
Dillon Beach:
11.8% (10)
California:
10.8% (936,725)
Discuss Dillon Beach, California (CA) on our hugely popular California forum.