Work and Jobs in Dishman, Washington (WA) Detailed Stats
Occupations, Industries, Unemployment, Workers, Commute

Recent posts about work in Dishman, Washington on our local forum with over 2,400,000 registered users:
 | We're moving to Spokane sight unseen...Help (52 replies) |
| Semi rural near Spokane (5 replies) |
| safe fun area to live in spokane area (6 replies) |
| What's Your Favorite Hiking Area/Trail around Spokane?? (22 replies) |
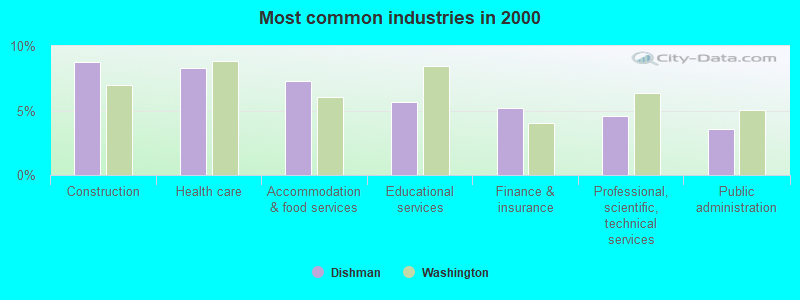
The most common industries in Dishman are: Construction (8.8% of civilian employees), Health care (8.3% of civilian employees), Accommodation & food services (7.3% of civilian employees). 73.2% of workers are employees of private companies, which is 9.9% greater than the rate of 66.0% across the entire state of Washington.
Most common industries
Most common industries | |||
|---|---|---|---|
Industry | All | Males | Females |
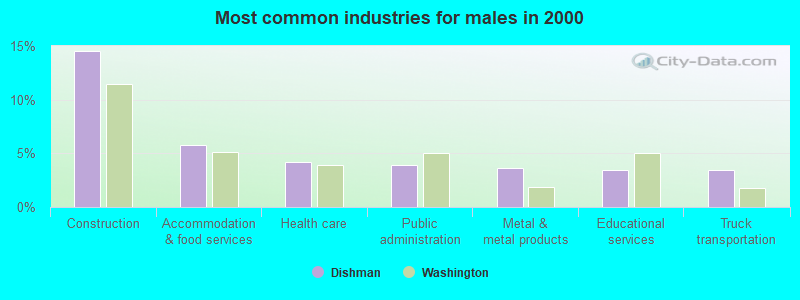
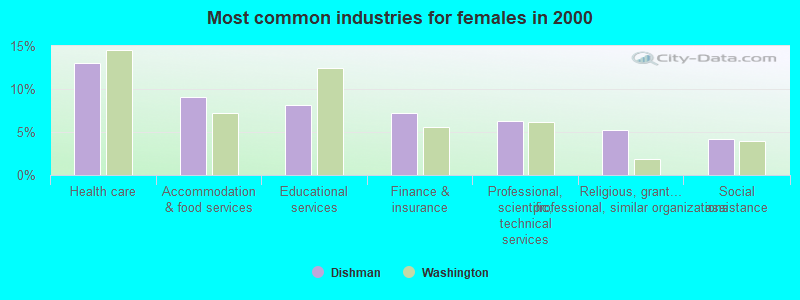
| Construction | 8.8% (415) | 14.5% (367) | 2.2% (48) |
| Health care | 8.3% (394) | 4.2% (105) | 13.1% (289) |
| Accommodation and food services | 7.3% (346) | 5.8% (146) | 9.0% (200) |
| Educational services | 5.7% (269) | 3.5% (88) | 8.2% (181) |
| Finance and insurance | 5.2% (245) | 3.4% (86) | 7.2% (159) |
| Professional, scientific, and technical services | 4.6% (216) | 3.1% (78) | 6.2% (138) |
| Public administration | 3.6% (169) | 3.9% (99) | 3.2% (70) |
| Religious, grantmaking, civic, professional, and similar organizations | 3.3% (156) | 1.6% (41) | 5.2% (115) |
| Administrative and support and waste management services | 2.9% (139) | 3.2% (80) | 2.7% (59) |
| Food and beverage stores | 2.9% (136) | 2.9% (74) | 2.8% (62) |
| Miscellaneous manufacturing | 2.8% (134) | 2.8% (71) | 2.8% (63) |
| Metal and metal products | 2.4% (112) | 3.6% (91) | 0.9% (21) |
| Repair and maintenance | 2.3% (107) | 3.4% (87) | 0.9% (20) |
| Social assistance | 2.1% (99) | 0.3% (7) | 4.2% (92) |
| Motor vehicle and parts dealers | 2.0% (95) | 3.1% (78) | 0.8% (17) |
| Truck transportation | 2.0% (95) | 3.5% (88) | 0.3% (7) |
| Computer and electronic products | 2.0% (95) | 1.1% (28) | 3.0% (67) |
| Department and other general merchandise stores | 1.9% (89) | 0.8% (19) | 3.2% (70) |
| Groceries and related products merchant wholesalers | 1.6% (78) | 2.8% (71) | 0.3% (7) |
| Real estate and rental and leasing | 1.6% (76) | 1.3% (33) | 1.9% (43) |
| Food | 1.4% (66) | 1.7% (43) | 1.0% (23) |
| Personal and laundry services | 1.4% (65) | 0.1% (2) | 2.8% (63) |
| Arts, entertainment, and recreation | 1.4% (65) | 1.3% (34) | 1.4% (31) |
| Building material and garden equipment and supplies dealers | 1.2% (59) | 1.1% (28) | 1.4% (31) |
| U. S. Postal service | 1.1% (53) | 2.1% (53) | 0.0% (0) |
| Other transportation, and support activities, and couriers | 1.1% (52) | 1.8% (46) | 0.3% (6) |
| Publishing, and motion picture and sound recording industries | 1.1% (50) | 1.7% (43) | 0.3% (7) |
| Used merchandise, gift, novelty, and souvenir, and other miscellaneous stores | 1.0% (46) | 0.9% (23) | 1.0% (23) |
| Motor vehicles, parts and supplies merchant wholesalers | 0.9% (44) | 1.2% (30) | 0.6% (14) |
| Wood products | 0.9% (44) | 1.7% (44) | 0.0% (0) |
| Data processing, libraries, and other information services | 0.9% (43) | 1.0% (26) | 0.8% (17) |
| Clothing and accessories, including shoe, stores | 0.9% (41) | 0.0% (0) | 1.9% (41) |
| Machinery, equipment, and supplies merchant wholesalers | 0.7% (35) | 1.1% (28) | 0.3% (7) |
| Radio, TV, and computer stores | 0.7% (34) | 0.8% (20) | 0.6% (14) |
| Paper | 0.7% (34) | 1.0% (25) | 0.4% (9) |
| Machinery | 0.7% (33) | 0.6% (14) | 0.9% (19) |
| Printing and related support activities | 0.6% (28) | 0.2% (4) | 1.1% (24) |
| Utilities | 0.6% (27) | 0.8% (19) | 0.4% (8) |
| Rail transportation | 0.5% (25) | 0.8% (19) | 0.3% (6) |
| Mining, quarrying, and oil and gas extraction | 0.5% (24) | 1.0% (24) | 0.0% (0) |
| Recyclable material merchant wholesalers | 0.5% (24) | 1.0% (24) | 0.0% (0) |
| Nonmetallic mineral products | 0.5% (24) | 1.0% (24) | 0.0% (0) |
| Furniture and related product manufacturing | 0.5% (23) | 0.8% (20) | 0.1% (3) |
| Professional and commercial equipment and supplies merchant wholesalers | 0.5% (23) | 0.7% (18) | 0.2% (5) |
| Electrical and electronic goods merchant wholesalers | 0.5% (23) | 0.7% (18) | 0.2% (5) |
| Paper and paper products merchant wholesalers | 0.5% (22) | 0.7% (17) | 0.2% (5) |
| Gasoline stations | 0.5% (22) | 0.2% (4) | 0.8% (18) |
| Transportation equipment | 0.4% (21) | 0.8% (21) | 0.0% (0) |
| Miscellaneous nondurable goods merchant wholesalers | 0.4% (21) | 0.5% (12) | 0.4% (9) |
| Furniture and home furnishings, and household appliance stores | 0.4% (20) | 0.6% (14) | 0.3% (6) |
| Health and personal care, except drug, stores | 0.4% (20) | 0.0% (0) | 0.9% (20) |
| Sporting goods, camera, and hobby and toy stores | 0.3% (16) | 0.6% (16) | 0.0% (0) |
| Private households | 0.3% (16) | 0.0% (0) | 0.7% (16) |
| Furniture and home furnishing merchant wholesalers | 0.3% (16) | 0.2% (5) | 0.5% (11) |
| Pharmacies and drug stores | 0.3% (16) | 0.0% (0) | 0.7% (16) |
| Broadcasting and telecommunications | 0.3% (15) | 0.6% (15) | 0.0% (0) |
| Lumber and other construction materials merchant wholesalers | 0.3% (12) | 0.0% (0) | 0.5% (12) |
| Fuel dealers | 0.3% (12) | 0.5% (12) | 0.0% (0) |
| Sewing, needlework, and piece goods stores | 0.2% (9) | 0.4% (9) | 0.0% (0) |
| Air transportation | 0.2% (8) | 0.3% (8) | 0.0% (0) |
| Hardware, plumbing and heating equipment, and supplies merchant wholesalers | 0.2% (8) | 0.3% (8) | 0.0% (0) |
| Music stores | 0.1% (7) | 0.3% (7) | 0.0% (0) |
| Other direct selling establishments | 0.1% (7) | 0.0% (0) | 0.3% (7) |
| Petroleum and petroleum products merchant wholesalers | 0.1% (6) | 0.2% (6) | 0.0% (0) |
| Chemicals | 0.1% (6) | 0.2% (6) | 0.0% (0) |
| Electrical equipment, appliances, and components | 0.1% (5) | 0.0% (0) | 0.2% (5) |
| Agriculture, forestry, fishing and hunting | 0.1% (5) | 0.0% (0) | 0.2% (5) |
Unemployment in Dishman
- Unemployment by race in 2000
- Unemployment rate for White non-Hispanic residents
- 6.5%Males
- 5.1%Females
- Unemployment rate for American Indian and Alaska Native residents
- 27.4%Males
- Unemployment rate for two or more race residents
- 26.5%Males
Time leaving home to go to work
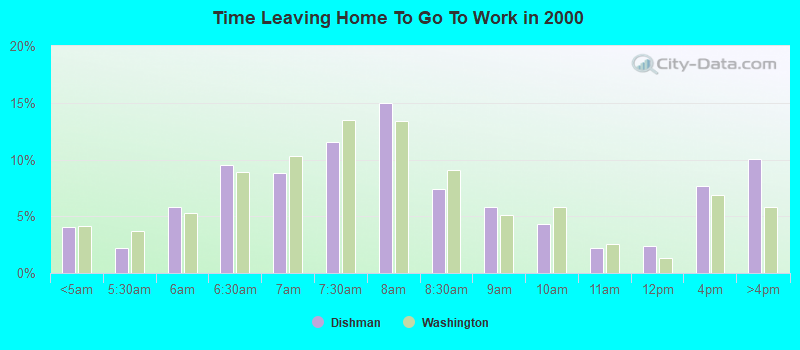
<5am:
| Dishman: | 4.0% (187) |
| Washington: | 4.2% (115,997) |
5:30am:
| Dishman: | 2.2% (104) |
| Washington: | 3.7% (102,868) |
6am:
| Dishman: | 5.9% (273) |
| Washington: | 5.3% (147,812) |
6:30am:
| Dishman: | 9.5% (443) |
| Washington: | 8.9% (248,462) |
7am:
| Dishman: | 8.9% (413) |
| Washington: | 10.3% (288,005) |
7:30am:
| Dishman: | 11.5% (537) |
| Washington: | 13.5% (375,030) |
8am:
| Dishman: | 15.0% (699) |
| Washington: | 13.4% (372,576) |
8:30am:
| Dishman: | 7.4% (347) |
| Washington: | 9.0% (252,058) |
9am:
| Dishman: | 5.8% (271) |
| Washington: | 5.1% (141,936) |
10am:
| Dishman: | 4.3% (202) |
| Washington: | 5.8% (161,204) |
11am:
| Dishman: | 2.2% (104) |
| Washington: | 2.5% (70,123) |
12pm:
| Dishman: | 2.3% (109) |
| Washington: | 1.3% (35,612) |
4pm:
| Dishman: | 7.6% (356) |
| Washington: | 6.8% (190,565) |
>4pm:
| Dishman: | 10.1% (469) |
| Washington: | 5.8% (162,401) |
Travel time to work
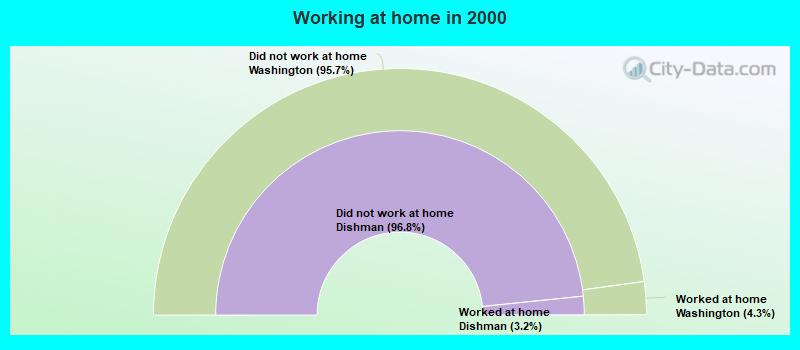
Daytime population change due to commuting: +605 (+6.0%)
Workers who live and work in this place: 587 (12.6%)
Workers who live and work in this place: 587 (12.6%)
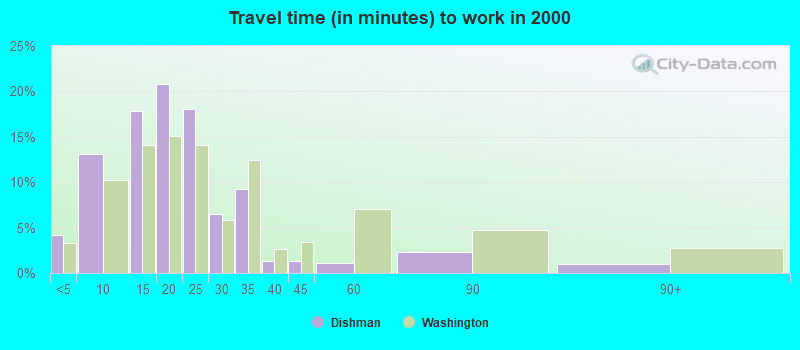
Less than 5 minutes:
| Dishman: | 4.2% (197) |
| Washington: | 3.3% (91,132) |
5 to 9 minutes:
| Dishman: | 13.1% (613) |
| Washington: | 10.3% (286,517) |
10 to 14 minutes:
| Dishman: | 17.9% (833) |
| Washington: | 14.1% (391,606) |
15 to 19 minutes:
| Dishman: | 20.8% (972) |
| Washington: | 15.0% (418,990) |
20 to 24 minutes:
| Dishman: | 18.0% (841) |
| Washington: | 14.2% (394,209) |
25 to 29 minutes:
| Dishman: | 6.5% (303) |
| Washington: | 5.8% (162,590) |
30 to 34 minutes:
| Dishman: | 9.2% (431) |
| Washington: | 12.5% (348,311) |
35 to 39 minutes:
| Dishman: | 1.3% (61) |
| Washington: | 2.6% (73,592) |
40 to 44 minutes:
| Dishman: | 1.3% (62) |
| Washington: | 3.4% (95,182) |
45 to 59 minutes:
| Dishman: | 1.1% (51) |
| Washington: | 7.0% (195,343) |
60 to 89 minutes:
| Dishman: | 2.3% (106) |
| Washington: | 4.7% (131,691) |
90 or more minutes:
| Dishman: | 0.9% (44) |
| Washington: | 2.7% (75,486) |
Means of transportation to work
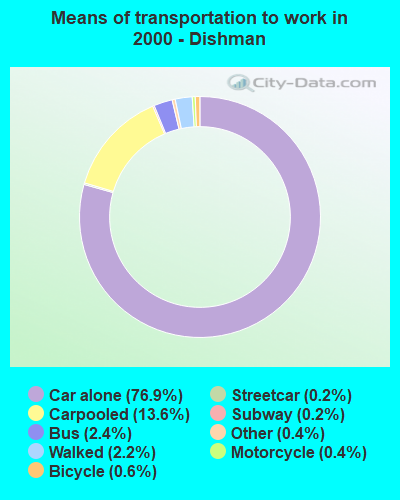

Drove car alone:
| Dishman: | 76.9% (3,587) |
| Washington: | 73.3% (2,040,833) |
Carpooled:
| Dishman: | 13.6% (636) |
| Washington: | 12.8% (357,742) |
Bus or trolley bus:
| Dishman: | 2.4% (110) |
| Washington: | 4.5% (124,450) |
Streetcar or trolley car:
| Dishman: | 0.2% (7) |
| Washington: | 0.0% (589) |
Subway or elevated:
| Dishman: | 0.2% (7) |
| Washington: | 0.0% (598) |
Motorcycle:
| Dishman: | 0.4% (18) |
| Washington: | 0.2% (4,353) |
Bicycle:
| Dishman: | 0.6% (29) |
| Washington: | 0.6% (16,205) |
Walked:
| Dishman: | 2.2% (103) |
| Washington: | 3.2% (89,739) |
Other means:
| Dishman: | 0.4% (17) |
| Washington: | 0.7% (19,499) |
Private vehicle occupancy
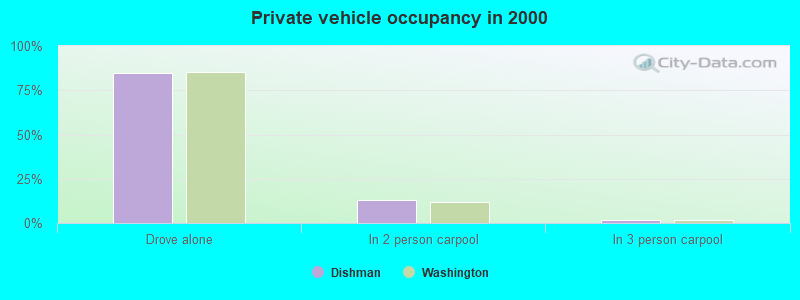
Drove alone:
| Dishman: | 84.9% (3,587) |
| Washington: | 85.1% (2,040,833) |
In 2 person carpool:
| Dishman: | 12.7% (538) |
| Washington: | 11.8% (282,638) |
In 3 person carpool:
| Dishman: | 1.8% (76) |
| Washington: | 1.9% (44,791) |
In 4 person carpool:
| Dishman: | 0.5% (22) |
| Washington: | 0.6% (14,195) |
Class of workers
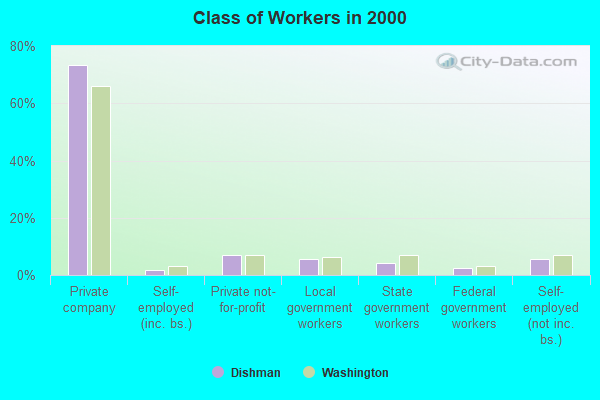
Employee of private company:
| Dishman: | 73.2% (3,470) |
| Washington: | 66.0% (1,843,000) |
Self-employed in own incorporated business:
| Dishman: | 1.6% (75) |
| Washington: | 3.2% (90,102) |
Private not-for-profit wage and salary workers:
| Dishman: | 7.1% (335) |
| Washington: | 6.9% (191,927) |
Local government workers:
| Dishman: | 5.4% (257) |
| Washington: | 6.4% (178,161) |
State government workers:
| Dishman: | 4.2% (200) |
| Washington: | 6.9% (192,408) |
Federal government workers:
| Dishman: | 2.5% (118) |
| Washington: | 3.2% (89,153) |
Self-employed workers in own not incorporated business:
| Dishman: | 5.6% (265) |
| Washington: | 7.2% (199,827) |
Unpaid family workers:
| Dishman: | 0.4% (20) |
| Washington: | 0.3% (9,144) |
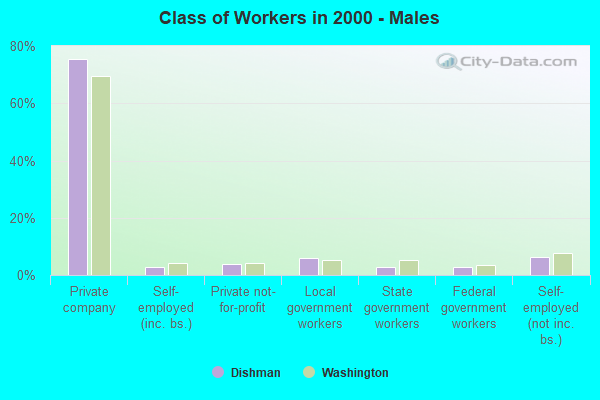
Employee of private company - Males:
| Dishman: | 75.3% (1,903) |
| Washington: | 69.7% (1,044,674) |
Self-employed in own incorporated business - Males:
| Dishman: | 2.8% (70) |
| Washington: | 4.3% (64,169) |
Private not-for-profit wage and salary workers - Males:
| Dishman: | 3.7% (93) |
| Washington: | 4.2% (63,257) |
Local government workers - Males:
| Dishman: | 5.8% (147) |
| Washington: | 5.3% (79,844) |
State government workers - Males:
| Dishman: | 2.9% (72) |
| Washington: | 5.1% (76,834) |
Federal government workers - Males:
| Dishman: | 2.9% (74) |
| Washington: | 3.5% (52,763) |
Self-employed workers in own not incorporated business - Males:
| Dishman: | 6.3% (159) |
| Washington: | 7.6% (114,199) |
Unpaid family workers - Males:
| Dishman: | 0.3% (8) |
| Washington: | 0.3% (3,889) |
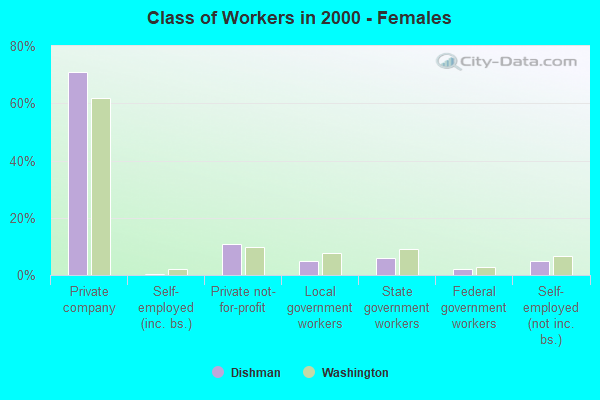
Employee of private company - Females:
| Dishman: | 70.8% (1,567) |
| Washington: | 61.7% (798,326) |
Self-employed in own incorporated business - Females:
| Dishman: | 0.2% (5) |
| Washington: | 2.0% (25,933) |
Private not-for-profit wage and salary workers - Females:
| Dishman: | 10.9% (242) |
| Washington: | 9.9% (128,670) |
Local government workers - Females:
| Dishman: | 5.0% (110) |
| Washington: | 7.6% (98,317) |
State government workers - Females:
| Dishman: | 5.8% (128) |
| Washington: | 8.9% (115,574) |
Federal government workers - Females:
| Dishman: | 2.0% (44) |
| Washington: | 2.8% (36,390) |
Self-employed workers in own not incorporated business - Females:
| Dishman: | 4.8% (106) |
| Washington: | 6.6% (85,628) |
Unpaid family workers - Females:
| Dishman: | 0.5% (12) |
| Washington: | 0.4% (5,255) |