Work and Jobs in Dover, Florida (FL) Detailed Stats
Data:
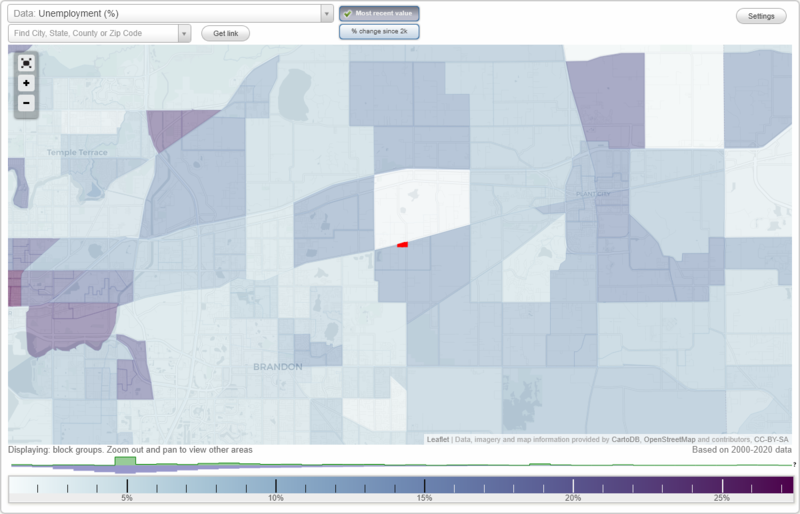
Unemployment (%)
Unemployment (% change since 2000)
Unemployment (%) - White
Unemployment (% change since 2000) - White
Unemployment (%) - Black or African American
Unemployment (% change since 2000) - Black or African American
Unemployment (%) - Asian
Unemployment (% change since 2000) - Asian
Unemployment (%) - Hispanic or Latino
Unemployment (% change since 2000) - Hispanic or Latino
Unemployment (%) - American Indian and Alaska Native
Unemployment (% change since 2000) - American Indian and Alaska Native
Unemployment (%) - Multirace
Unemployment (% change since 2000) - Multirace
Unemployment (%) - Other Race
Unemployment (% change since 2000) - Other Race
Industry diversity
Most Common Industries - Agriculture, forestry, fishing and hunting, and mining (%)
Most Common Industries - Agriculture, forestry, fishing and hunting (%)
Most Common Industries - Mining, quarrying, and oil and gas extraction (%)
Most Common Industries - Construction (%)
Most Common Industries - Manufacturing (%)
Most Common Industries - Wholesale trade (%)
Most Common Industries - Retail trade (%)
Most Common Industries - Transportation and warehousing, and utilities (%)
Most Common Industries - Transportation and warehousing (%)
Most Common Industries - Utilities (%)
Most Common Industries - Information (%)
Most Common Industries - Finance and insurance, and real estate and rental and leasing (%)
Most Common Industries - Finance and insurance (%)
Most Common Industries - Real estate and rental and leasing (%)
Most Common Industries - Professional, scientific, and management, and administrative and waste management services (%)
Most Common Industries - Professional, scientific, and technical services (%)
Most Common Industries - Management of companies and enterprises (%)
Most Common Industries - Administrative and support and waste management services (%)
Most Common Industries - Educational services, and health care and social assistance (%)
Most Common Industries - Educational services (%)
Most Common Industries - Health care and social assistance (%)
Most Common Industries - Arts, entertainment, and recreation, and accommodation and food services (%)
Most Common Industries - Arts, entertainment, and recreation (%)
Most Common Industries - Accommodation and food services (%)
Most Common Industries - Other services, except public administration (%)
Most Common Industries - Public administration (%)
Occupation diversity
Most Common Occupations - Management, business, science, and arts occupations (%)
Most Common Occupations - Management, business, and financial occupations (%)
Most Common Occupations - Management occupations (%)
Most Common Occupations - Business and financial operations occupations (%)
Most Common Occupations - Computer, engineering, and science occupations (%)
Most Common Occupations - Computer and mathematical occupations (%)
Most Common Occupations - Architecture and engineering occupations (%)
Most Common Occupations - Life, physical, and social science occupations (%)
Most Common Occupations - Education, legal, community service, arts, and media occupations (%)
Most Common Occupations - Community and social service occupations (%)
Most Common Occupations - Legal occupations (%)
Most Common Occupations - Education, training, and library occupations (%)
Most Common Occupations - Arts, design, entertainment, sports, and media occupations (%)
Most Common Occupations - Healthcare practitioners and technical occupations (%)
Most Common Occupations - Health diagnosing and treating practitioners and other technical occupations (%)
Most Common Occupations - Health technologists and technicians (%)
Most Common Occupations - Service occupations (%)
Most Common Occupations - Healthcare support occupations (%)
Most Common Occupations - Protective service occupations (%)
Most Common Occupations - Fire fighting and prevention, and other protective service workers including supervisors (%)
Most Common Occupations - Law enforcement workers including supervisors (%)
Most Common Occupations - Food preparation and serving related occupations (%)
Most Common Occupations - Building and grounds cleaning and maintenance occupations (%)
Most Common Occupations - Personal care and service occupations (%)
Most Common Occupations - Sales and office occupations (%)
Most Common Occupations - Sales and related occupations (%)
Most Common Occupations - Office and administrative support occupations (%)
Most Common Occupations - Natural resources, construction, and maintenance occupations (%)
Most Common Occupations - Farming, fishing, and forestry occupations (%)
Most Common Occupations - Construction and extraction occupations (%)
Most Common Occupations - Installation, maintenance, and repair occupations (%)
Most Common Occupations - Production, transportation, and material moving occupations (%)
Most Common Occupations - Production occupations (%)
Most Common Occupations - Transportation occupations (%)
Most Common Occupations - Material moving occupations (%)
Private vehicle occupancy - Drove alone (% change since 2000)
Private vehicle occupancy - Carpooled (%)
Private vehicle occupancy - Carpooled (% change since 2000)
Private vehicle occupancy - In 2-person carpool (%)
Private vehicle occupancy - In 2-person carpool (% change since 2000)
Private vehicle occupancy - In 3-person carpool (%)
Private vehicle occupancy - In 3-person carpool (% change since 2000)
Private vehicle occupancy - In 4-person carpool (%)
Private vehicle occupancy - In 4-person carpool (% change since 2000)
Private vehicle occupancy - In 5- or 6-person carpool (%)
Private vehicle occupancy - In 5- or 6-person carpool (% change since 2000)
Private vehicle occupancy - In 7-or-more-person carpool (%)
Private vehicle occupancy - In 7-or-more-person carpool (% change since 2000)
Time Leaving Home To Go To Work - 12:00 a.m. to 4:59 a.m. (%)
Time Leaving Home To Go To Work - 12:00 a.m. to 4:59 a.m. (% change since 2000)
Time Leaving Home To Go To Work - 5:00 a.m. to 5:59 a.m. (%)
Time Leaving Home To Go To Work - 5:00 a.m. to 5:59 a.m. (% change since 2000)
Time Leaving Home To Go To Work - 6:00 a.m. to 6:59 a.m. (%)
Time Leaving Home To Go To Work - 6:00 a.m. to 6:59 a.m. (% change since 2000)
Time Leaving Home To Go To Work - 7:00 a.m. to 7:59 a.m. (%)
Time Leaving Home To Go To Work - 7:00 a.m. to 7:59 a.m. (% change since 2000)
Time Leaving Home To Go To Work - 8:00 a.m. to 8:59 a.m. (%)
Time Leaving Home To Go To Work - 8:00 a.m. to 8:59 a.m. (% change since 2000)
Time Leaving Home To Go To Work - 9:00 a.m. to 9:59 a.m. (%)
Time Leaving Home To Go To Work - 9:00 a.m. to 9:59 a.m. (% change since 2000)
Time Leaving Home To Go To Work - 10:00 a.m. to 10:59 a.m. (%)
Time Leaving Home To Go To Work - 10:00 a.m. to 10:59 a.m. (% change since 2000)
Time Leaving Home To Go To Work - 11:00 a.m. to 11:59 a.m. (%)
Time Leaving Home To Go To Work - 11:00 a.m. to 11:59 a.m. (% change since 2000)
Time Leaving Home To Go To Work - 12:00 p.m. to 3:59 p.m. (%)
Time Leaving Home To Go To Work - 12:00 p.m. to 3:59 p.m. (% change since 2000)
Time Leaving Home To Go To Work - 4:00 p.m. to 11:59 p.m. (%)
Time Leaving Home To Go To Work - 4:00 p.m. to 11:59 p.m. (% change since 2000)
Class of Workers - Employee of private company (%)
Class of Workers - Employee of private company (% change since 2000)
Class of Workers - Self-employed in own incorporated business (%)
Class of Workers - Self-employed in own incorporated business (% change since 2000)
Class of Workers - Private not-for-profit wage and salary workers (%)
Class of Workers - Private not-for-profit wage and salary workers (% change since 2000)
Class of Workers - Local government workers (%)
Class of Workers - Local government workers (% change since 2000)
Class of Workers - State government workers (%)
Class of Workers - State government workers (% change since 2000)
Class of Workers - Federal government workers (%)
Class of Workers - Federal government workers (% change since 2000)
Class of Workers - Self-employed workers in own not incorporated business and Unpaid family workers (%)
Class of Workers - Self-employed workers in own not incorporated business and Unpaid family workers (% change since 2000)
Means of transportation to work - Drove car alone (%)
Means of transportation to work - Drove car alone (% change since 2000)
Means of transportation to work - Carpooled (%)
Means of transportation to work - Carpooled (% change since 2000)
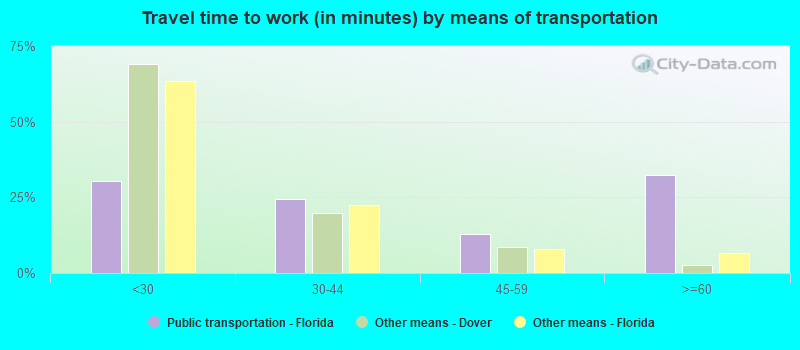
Means of transportation to work - Public transportation (%)
Means of transportation to work - Public transportation (% change since 2000)
Means of transportation to work - Bus or trolley bus (%)
Means of transportation to work - Bus or trolley bus (% change since 2000)
Means of transportation to work - Streetcar or trolley car (%)
Means of transportation to work - Streetcar or trolley car (% change since 2000)
Means of transportation to work - Subway or elevated (%)
Means of transportation to work - Subway or elevated (% change since 2000)
Means of transportation to work - Railroad (%)
Means of transportation to work - Railroad (% change since 2000)
Means of transportation to work - Ferryboat (%)
Means of transportation to work - Ferryboat (% change since 2000)
Means of transportation to work - Taxicab (%)
Means of transportation to work - Taxicab (% change since 2000)
Means of transportation to work - Motorcycle (%)
Means of transportation to work - Motorcycle (% change since 2000)
Means of transportation to work - Bicycle (%)
Means of transportation to work - Bicycle (% change since 2000)
Means of transportation to work - Walked (%)
Means of transportation to work - Walked (% change since 2000)
Means of transportation to work - Other means (%)
Means of transportation to work - Other means (% change since 2000)
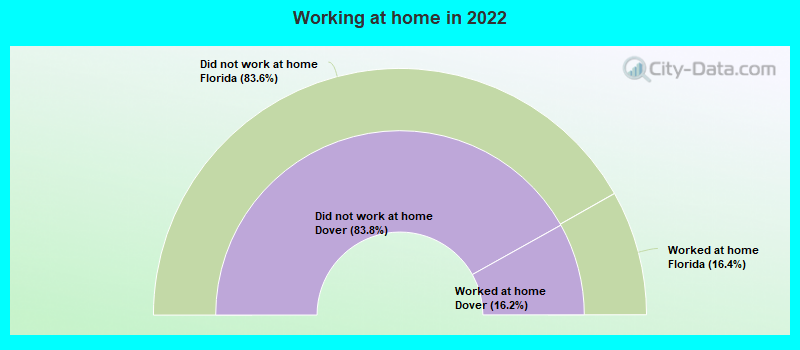
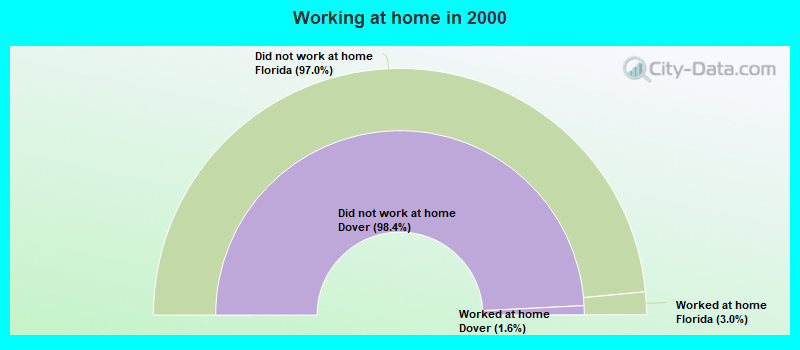
Working at home (%)
Working at home (% change since 2000)
Travel time to work - Less than 5 minutes (%)
Travel time to work - Less than 5 minutes (% change since 2000)
Travel time to work - 5 to 9 minutes (%)
Travel time to work - 5 to 9 minutes (% change since 2000)
Travel time to work - 10 to 19 minutes (%)
Travel time to work - 10 to 19 minutes (% change since 2000)
Travel time to work - 20 to 29 minutes (%)
Travel time to work - 20 to 29 minutes (% change since 2000)
Travel time to work - 30 to 39 minutes (%)
Travel time to work - 30 to 39 minutes (% change since 2000)
Travel time to work - 40 to 59 minutes (%)
Travel time to work - 40 to 59 minutes (% change since 2000)
Travel time to work - 60 to 89 minutes (%)
Travel time to work - 60 to 89 minutes (% change since 2000)
Travel time to work - 90 or more minutes (%)
Travel time to work - 90 or more minutes (% change since 2000)
Latest news about work in Dover, FL collected exclusively by city-data.com from local newspapers, TV, and radio stations
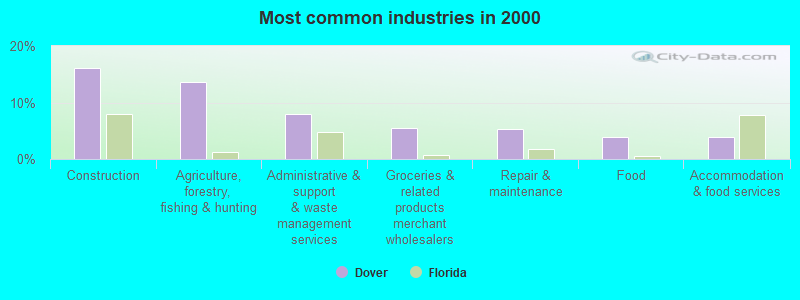
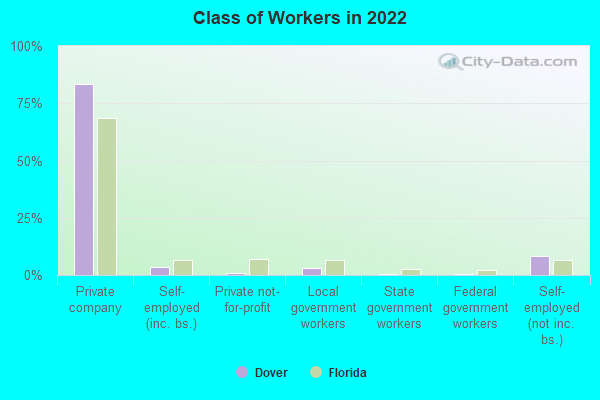
The most common industries in Dover are: Construction (16.1% of civilian employees), Agriculture, forestry, fishing & hunting (13.6% of civilian employees), Administrative & support & waste management services (7.9% of civilian employees). 92.4% of workers work in Hillsborough County and 11.8% of all workers work at home. 83.4% of workers are employees of private companies, which is 17.7% greater than the rate of 68.7% across the entire state of Florida.
Whole page based on the data from 2000 / 2022 when the population of Dover, Florida was 2,798 / 3,346
Most common industries
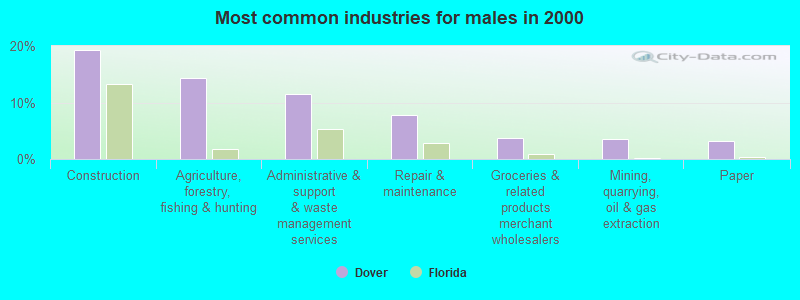
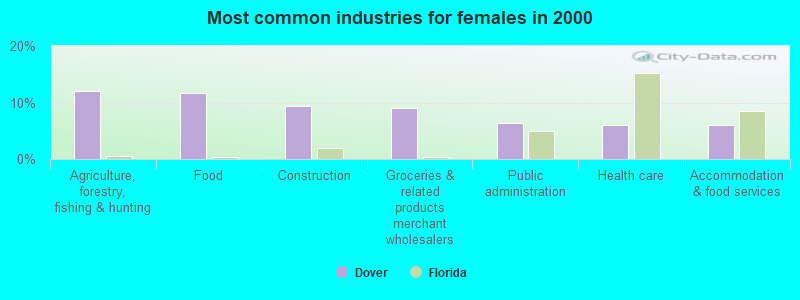
Most common industries Industry All Males Females
Construction 16.1% 19.2% 9.3% Agriculture, forestry, fishing and hunting 13.6% 14.3% 12.0% Administrative and support and waste management services 7.9% 11.6% 0.0% Groceries and related products merchant wholesalers 5.4% 3.8% 9.0% Repair and maintenance 5.3% 7.8% 0.0% Food 3.9% 0.3% 11.7% Accommodation and food services 3.9% 2.9% 6.0% Educational services 3.0% 2.1% 5.1% Health care 2.9% 1.5% 6.0% Paper 2.9% 3.2% 2.1% Mining, quarrying, and oil and gas extraction 2.5% 3.6% 0.0% Social assistance 2.1% 2.2% 1.8% Real estate and rental and leasing 2.1% 3.1% 0.0% Public administration 2.0% 0.0% 6.3% Truck transportation 1.9% 1.3% 3.3% Nonmetallic mineral products 1.7% 2.5% 0.0% Motor vehicle and parts dealers 1.6% 1.0% 3.0% Miscellaneous nondurable goods merchant wholesalers 1.6% 1.0% 3.0% Arts, entertainment, and recreation 1.6% 2.4% 0.0% Furniture and home furnishing merchant wholesalers 1.5% 0.0% 4.8% Furniture and home furnishings, and household appliance stores 1.5% 2.2% 0.0% Other transportation, and support activities, and couriers 1.3% 1.9% 0.0% Pharmacies and drug stores 1.2% 1.3% 1.2% Miscellaneous manufacturing 1.1% 0.0% 3.6% Utilities 1.0% 1.5% 0.0% Food and beverage stores 1.0% 1.4% 0.0% Book stores and news dealers 1.0% 1.4% 0.0% Professional and commercial equipment and supplies merchant wholesalers 0.9% 1.3% 0.0% Professional, scientific, and technical services 0.9% 0.0% 2.7% Rail transportation 0.9% 1.3% 0.0% Machinery 0.8% 0.0% 2.4% Gasoline stations 0.8% 0.0% 2.4% Personal and laundry services 0.8% 0.0% 2.4% Recyclable material merchant wholesalers 0.7% 1.0% 0.0% Building material and garden equipment and supplies dealers 0.7% 1.0% 0.0% Warehousing and storage 0.6% 0.8% 0.0% Plastics and rubber products 0.6% 0.0% 1.8% Publishing, and motion picture and sound recording industries 0.5% 0.7% 0.0% Private households 0.4% 0.6% 0.0%
Unemployment in Dover Unemployment by race in 2022
Unemployment rate for White non-Hispanic residents 4.3% FemalesUnemployment rate for Hispanic or Latino residents 0.6% Males1.9% FemalesUnemployment by race in 2000
Unemployment rate for White non-Hispanic residents 21.0% FemalesUnemployment rate for other race residents 17.4% Males32.3% FemalesUnemployment rate for Hispanic or Latino residents 19.0% Males40.1% Females
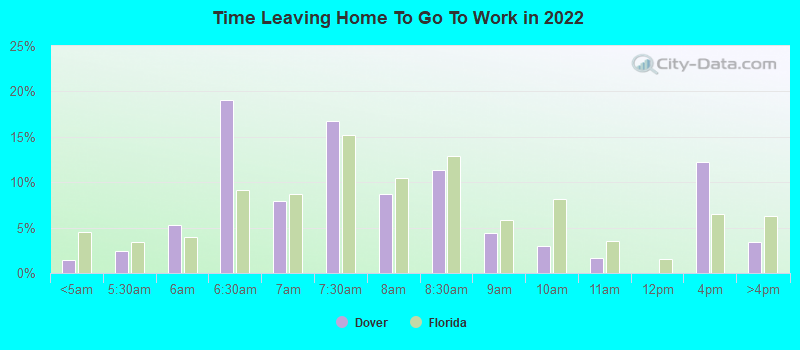
Time leaving home to go to work 12:00 a.m. to 4:59 a.m.: Dover:
1.4% (16)Florida:
4.5% (392,704)
5:00 a.m. to 5:29 a.m.: Dover:
2.4% (27)Florida:
3.4% (297,577)
5:30 a.m. to 5:59 a.m.: Dover:
5.3% (59)Florida:
3.9% (342,315)
6:00 a.m. to 6:29 a.m.: Dover:
19.1% (214)Florida:
9.1% (788,599)
6:30 a.m. to 6:59 a.m.: Dover:
8.0% (90)Florida:
8.7% (756,456)
7:00 a.m. to 7:29 a.m.: Dover:
16.8% (188)Florida:
15.2% (1,316,448)
7:30 a.m. to 7:59 a.m.: Dover:
8.7% (98)Florida:
10.5% (910,842)
8:00 a.m. to 8:29 a.m.: Dover:
11.4% (128)Florida:
12.9% (1,115,241)
8:30 a.m. to 8:59 a.m.: Dover:
4.4% (50)Florida:
5.9% (508,086)
9:00 a.m. to 9:59 a.m.: Dover:
3.0% (33)Florida:
8.2% (709,412)
10:00 a.m. to 10:59 a.m.: Dover:
1.6% (18)Florida:
3.5% (307,177)
12:00 p.m. to 3:59 p.m.: Dover:
12.3% (138)Florida:
6.4% (559,017)
4:00 p.m. to 11:59 p.m.: Dover:
3.4% (39)Florida:
6.2% (539,911)
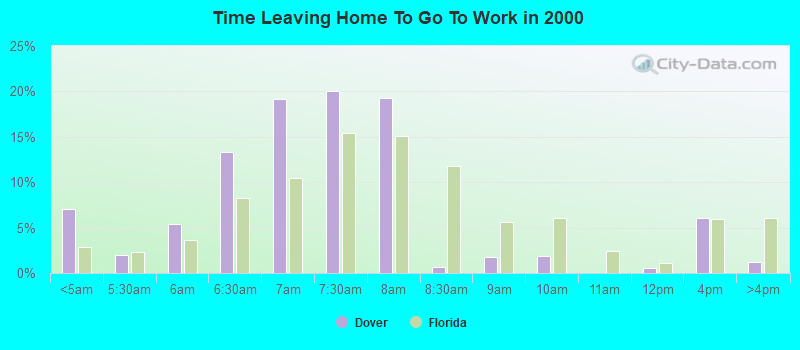
<5am: Dover:
7.0% (74)Florida:
2.8% (195,491)
5:30am: Dover:
2.0% (21)Florida:
2.4% (162,873)
6am: Dover:
5.4% (57)Florida:
3.6% (247,678)
6:30am: Dover:
13.3% (140)Florida:
8.2% (569,201)
7am: Dover:
19.1% (201)Florida:
10.4% (720,998)
7:30am: Dover:
20.0% (210)Florida:
15.4% (1,063,673)
8am: Dover:
19.2% (202)Florida:
15.1% (1,046,414)
8:30am: Dover:
0.7% (7)Florida:
11.8% (812,057)
9am: Dover:
1.7% (18)Florida:
5.6% (388,700)
10am: Dover:
1.9% (20)Florida:
6.1% (419,450)
12pm: Dover:
0.6% (6)Florida:
1.1% (77,065)
4pm: Dover:
6.1% (64)Florida:
6.0% (413,569)
>4pm: Dover:
1.2% (13)Florida:
6.0% (418,050)
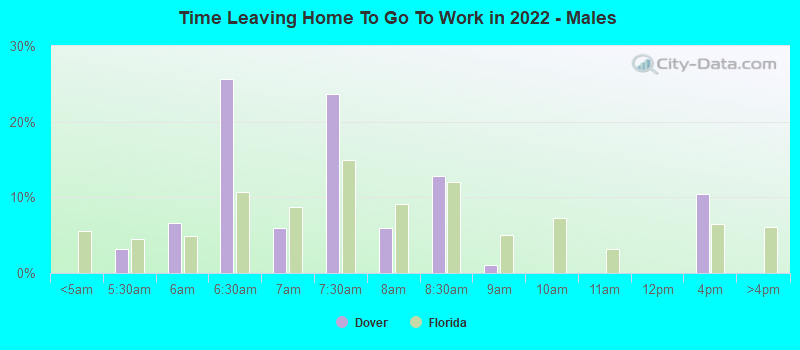
5:00 a.m. to 5:29 a.m. - Males: Dover:
3.1% (23)Florida:
4.5% (211,910)
5:30 a.m. to 5:59 a.m. - Males: Dover:
6.6% (49)Florida:
4.8% (226,216)
6:00 a.m. to 6:29 a.m. - Males: Dover:
25.7% (191)Florida:
10.8% (501,749)
6:30 a.m. to 6:59 a.m. - Males: Dover:
5.9% (44)Florida:
8.7% (407,840)
7:00 a.m. to 7:29 a.m. - Males: Dover:
23.7% (177)Florida:
14.9% (696,502)
7:30 a.m. to 7:59 a.m. - Males: Dover:
6.0% (44)Florida:
9.2% (428,477)
8:00 a.m. to 8:29 a.m. - Males: Dover:
12.8% (95)Florida:
12.0% (561,416)
8:30 a.m. to 8:59 a.m. - Males: Dover:
1.1% (8)Florida:
5.0% (234,209)
12:00 p.m. to 3:59 p.m. - Males: Dover:
10.5% (78)Florida:
6.4% (299,767)
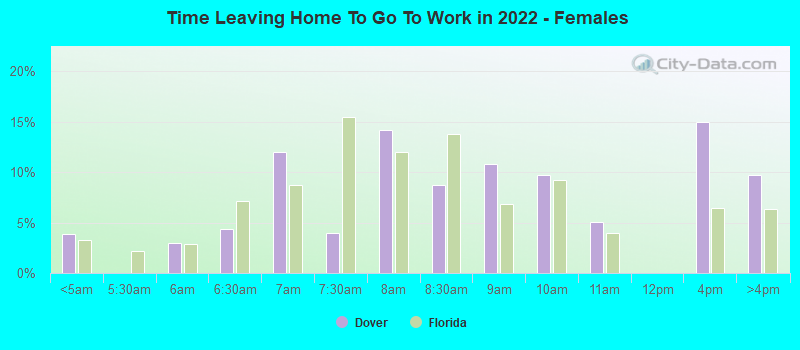
12:00 a.m. to 4:59 a.m. - Females: Dover:
3.9% (15)Florida:
3.3% (131,855)
5:30 a.m. to 5:59 a.m. - Females: Dover:
3.0% (11)Florida:
2.9% (116,099)
6:00 a.m. to 6:29 a.m. - Females: Dover:
4.4% (17)Florida:
7.2% (286,850)
6:30 a.m. to 6:59 a.m. - Females: Dover:
12.0% (45)Florida:
8.7% (348,616)
7:00 a.m. to 7:29 a.m. - Females: Dover:
3.9% (15)Florida:
15.5% (619,946)
7:30 a.m. to 7:59 a.m. - Females: Dover:
14.1% (53)Florida:
12.0% (482,365)
8:00 a.m. to 8:29 a.m. - Females: Dover:
8.8% (33)Florida:
13.8% (553,825)
8:30 a.m. to 8:59 a.m. - Females: Dover:
10.8% (41)Florida:
6.8% (273,877)
9:00 a.m. to 9:59 a.m. - Females: Dover:
9.7% (37)Florida:
9.2% (368,194)
10:00 a.m. to 10:59 a.m. - Females: Dover:
5.1% (19)Florida:
4.0% (160,234)
12:00 p.m. to 3:59 p.m. - Females: Dover:
14.9% (56)Florida:
6.5% (259,250)
4:00 p.m. to 11:59 p.m. - Females: Dover:
9.7% (37)Florida:
6.4% (255,776)
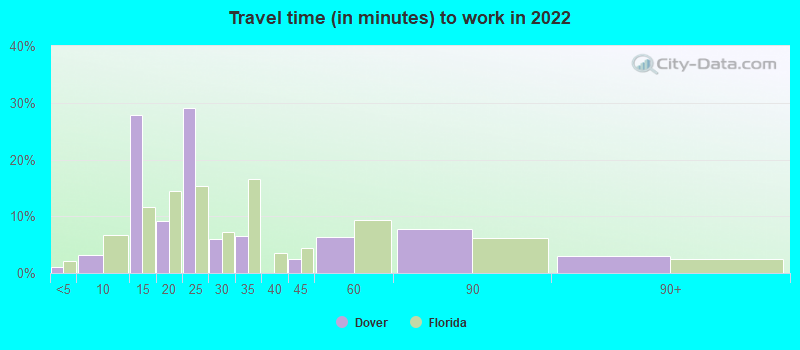
Travel time to work Percentage of workers working in this county: 92.4%Number of people working at home: 161 (11.8% of all workers )
Less than 5 minutes: Dover:
1.1% (13)Florida:
2.1% (184,936)
5 to 9 minutes: Dover:
3.2% (40)Florida:
6.7% (576,605)
10 to 14 minutes: Dover:
27.9% (343)Florida:
11.6% (997,405)
15 to 19 minutes: Dover:
9.2% (113)Florida:
14.4% (1,244,117)
20 to 24 minutes: Dover:
29.2% (358)Florida:
15.4% (1,324,857)
25 to 29 minutes: Dover:
6.0% (73)Florida:
7.3% (626,671)
30 to 34 minutes: Dover:
6.6% (81)Florida:
16.5% (1,426,038)
40 to 44 minutes: Dover:
2.5% (30)Florida:
4.4% (383,465)
45 to 59 minutes: Dover:
6.4% (79)Florida:
9.3% (798,942)
60 to 89 minutes: Dover:
7.8% (96)Florida:
6.2% (539,029)
90 or more minutes: Dover:
3.0% (37)Florida:
2.5% (215,337)
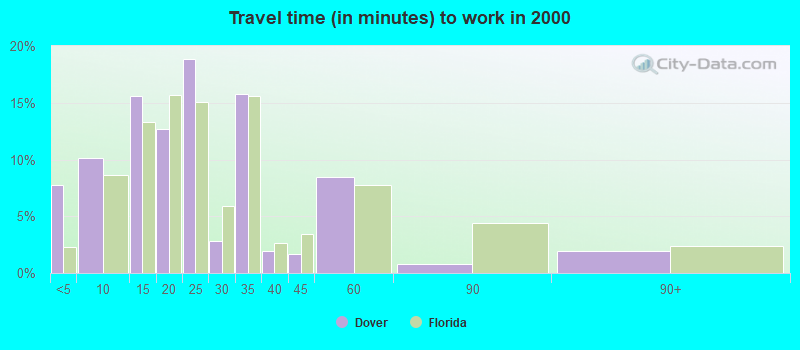
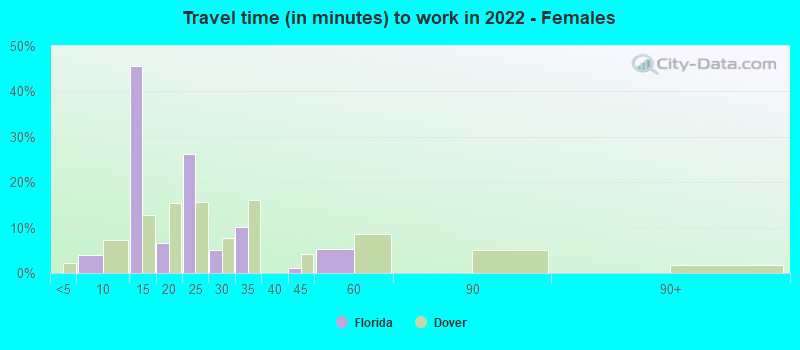
Less than 5 minutes: Dover:
7.7% (81)Florida:
2.3% (155,487)
5 to 9 minutes: Dover:
10.1% (106)Florida:
8.6% (595,769)
10 to 14 minutes: Dover:
15.6% (164)Florida:
13.3% (922,343)
15 to 19 minutes: Dover:
12.7% (133)Florida:
15.7% (1,085,636)
20 to 24 minutes: Dover:
18.9% (198)Florida:
15.1% (1,040,084)
25 to 29 minutes: Dover:
2.9% (30)Florida:
5.9% (404,902)
30 to 34 minutes: Dover:
15.8% (166)Florida:
15.6% (1,078,082)
35 to 39 minutes: Dover:
1.9% (20)Florida:
2.6% (182,138)
40 to 44 minutes: Dover:
1.7% (18)Florida:
3.4% (237,660)
45 to 59 minutes: Dover:
8.5% (89)Florida:
7.7% (534,237)
60 to 89 minutes: Dover:
0.8% (8)Florida:
4.4% (303,002)
90 or more minutes: Dover:
1.9% (20)Florida:
2.4% (163,739)
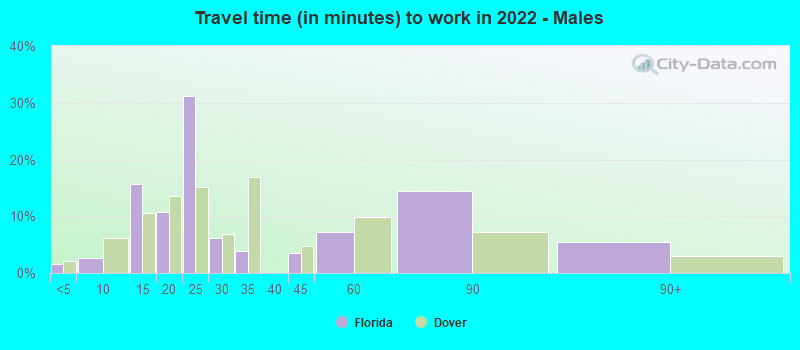
Less than 5 minutes - Males: Dover:
1.6% (11)Florida:
2.1% (95,230)
5 to 9 minutes - Males: Dover:
2.6% (19)Florida:
6.1% (284,191)
10 to 14 minutes - Males: Dover:
15.8% (115)Florida:
10.6% (491,236)
15 to 19 minutes - Males: Dover:
10.8% (79)Florida:
13.6% (630,510)
20 to 24 minutes - Males: Dover:
31.2% (228)Florida:
15.1% (697,633)
25 to 29 minutes - Males: Dover:
6.2% (45)Florida:
6.9% (317,358)
30 to 34 minutes - Males: Dover:
4.0% (29)Florida:
17.0% (784,644)
40 to 44 minutes - Males: Dover:
3.5% (26)Florida:
4.7% (218,235)
45 to 59 minutes - Males: Dover:
7.3% (53)Florida:
9.9% (456,034)
60 to 89 minutes - Males: Dover:
14.4% (105)Florida:
7.3% (336,551)
90 or more minutes - Males: Dover:
5.5% (40)Florida:
3.1% (142,730)
5 to 9 minutes - Females: Dover:
4.0% (20)Florida:
7.3% (292,414)
10 to 14 minutes - Females: Dover:
45.6% (229)Florida:
12.7% (506,169)
15 to 19 minutes - Females: Dover:
6.5% (33)Florida:
15.4% (613,607)
20 to 24 minutes - Females: Dover:
26.2% (131)Florida:
15.7% (627,224)
25 to 29 minutes - Females: Dover:
5.1% (25)Florida:
7.7% (309,313)
30 to 34 minutes - Females: Dover:
10.2% (51)Florida:
16.1% (641,394)
40 to 44 minutes - Females: Dover:
1.2% (6)Florida:
4.1% (165,230)
45 to 59 minutes - Females: Dover:
5.2% (26)Florida:
8.6% (342,908)
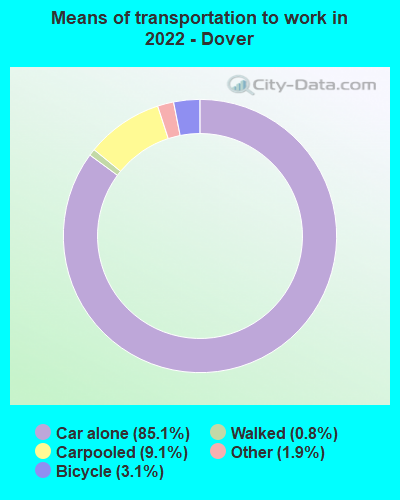
Means of transportation to work Drove car alone: Dover:
85.1% (1,117)Florida:
83.5% (3,317,217)
Carpooled: Dover:
9.1% (120)Florida:
10.8% (464,002)
Bicycle: Dover:
3.1% (40)Florida:
0.6% (13,243)
Walked: Dover:
0.8% (11)Florida:
1.6% (62,403)
Other means: Dover:
1.9% (25)Florida:
2.1% (79,000)
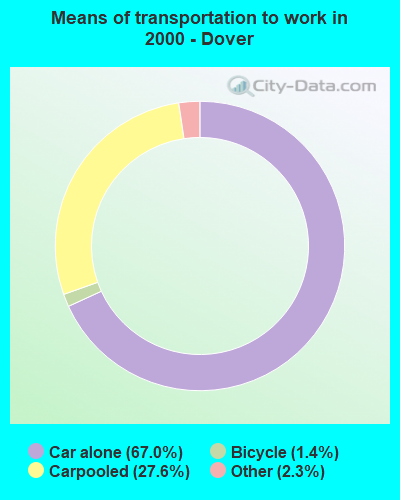
Drove car alone: Dover:
67.0% (704)Florida:
78.8% (5,445,527)
Carpooled: Dover:
27.6% (290)Florida:
12.9% (893,766)
Bicycle: Dover:
1.4% (15)Florida:
0.6% (39,294)
Other means: Dover:
2.3% (24)Florida:
0.9% (62,064)
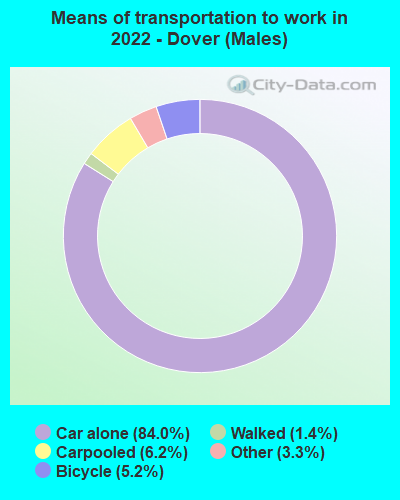
Drove car alone - Males: Dover:
84.0% (648)Florida:
83.9% (3,317,217)
Carpooled - Males: Dover:
6.2% (48)Florida:
10.0% (464,002)
Bicycle - Males: Dover:
5.2% (40)Florida:
0.8% (13,243)
Walked - Males: Dover:
1.4% (11)Florida:
1.7% (62,403)
Other means - Males: Dover:
3.3% (25)Florida:
2.3% (79,000)
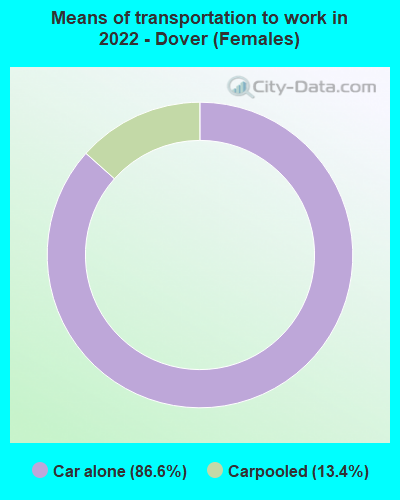
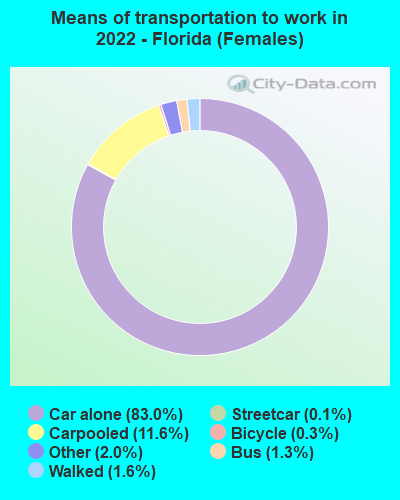
Drove car alone - Females: Dover:
86.6% (469)Florida:
83.0% (3,317,217)
Carpooled - Females: Dover:
13.4% (72)Florida:
11.6% (464,002)
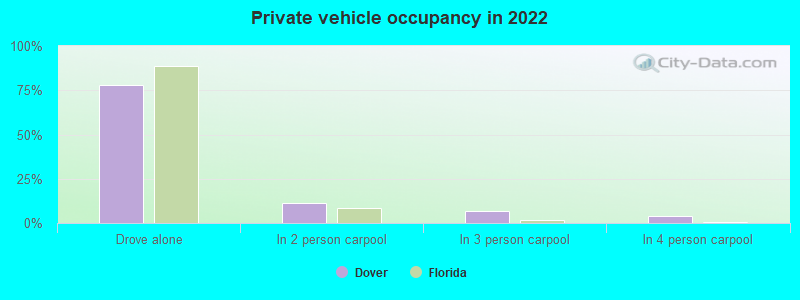
Private vehicle occupancy Drove alone: Dover:
77.8% (675)Florida:
88.6% (7,233,290)
In 2 person carpool: Dover:
11.4% (99)Florida:
8.5% (691,908)
In 3 person carpool: Dover:
6.9% (60)Florida:
1.8% (145,914)
In 4 person carpool: Dover:
3.9% (34)Florida:
0.6% (52,957)
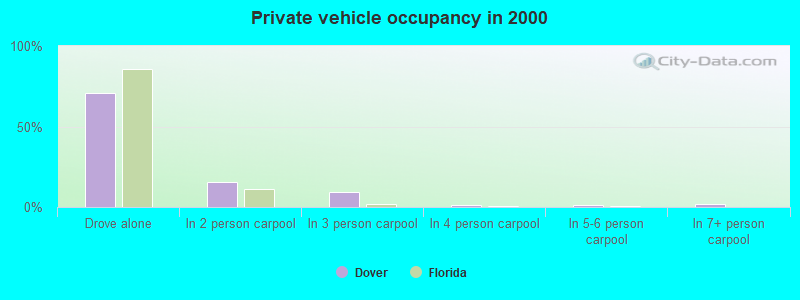
Drove alone: Dover:
70.8% (704)Florida:
85.9% (5,445,527)
In 2 person carpool: Dover:
15.8% (157)Florida:
11.0% (698,577)
In 3 person carpool: Dover:
9.4% (93)Florida:
1.9% (117,465)
In 4 person carpool: Dover:
1.0% (10)Florida:
0.7% (42,034)
In 5-6 person carpool: Dover:
1.4% (14)Florida:
0.3% (22,177)
In 7+ person carpool: Dover:
1.6% (16)Florida:
0.2% (13,513)
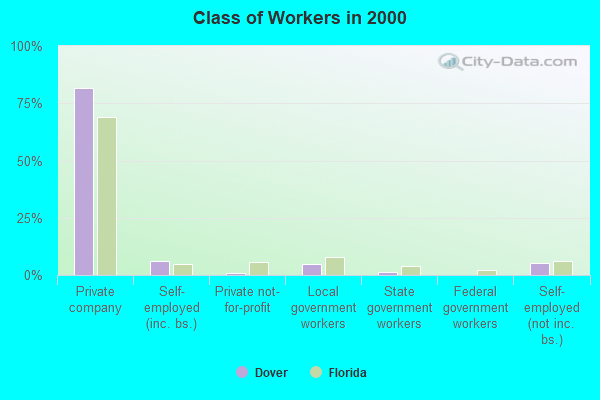
Class of workers
Employee of private company: Dover:
83.4% (1,189)Florida:
68.7% (7,204,504)
Self-employed in own incorporated business: Dover:
3.5% (50)Florida:
6.4% (671,306)
Private not-for-profit wage and salary workers: Dover:
1.0% (15)Florida:
6.8% (713,144)
Local government workers: Dover:
3.0% (43)Florida:
6.4% (671,727)
State government workers: Dover:
0.2% (3)Florida:
2.8% (291,320)
Federal government workers: Dover:
0.3% (4)Florida:
2.2% (233,269)
Self-employed workers in own not incorporated business: Dover:
8.5% (121)Florida:
6.5% (680,593)
Employee of private company: Dover:
81.8% (860)Florida:
69.2% (4,840,105)
Self-employed in own incorporated business: Dover:
5.9% (62)Florida:
4.9% (343,812)
Private not-for-profit wage and salary workers: Dover:
1.0% (11)Florida:
5.7% (395,397)
Local government workers: Dover:
4.9% (51)Florida:
7.7% (542,086)
State government workers: Dover:
1.3% (14)Florida:
3.7% (261,182)
Self-employed workers in own not incorporated business: Dover:
5.0% (53)Florida:
6.2% (435,619)
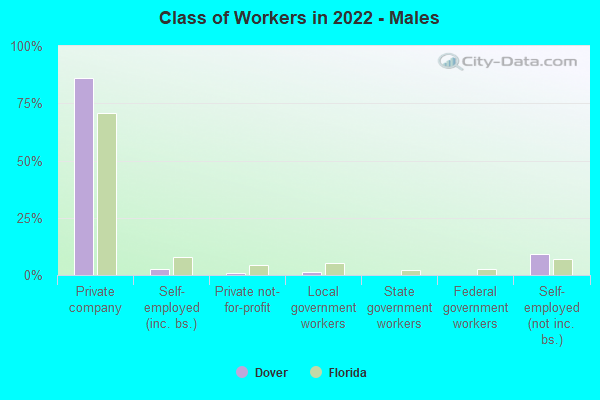
Employee of private company - Males: Dover:
86.2% (791)Florida:
70.6% (3,886,480)
Self-employed in own incorporated business - Males: Dover:
2.8% (25)Florida:
8.0% (439,838)
Private not-for-profit wage and salary workers - Males: Dover:
0.9% (8)Florida:
4.5% (249,154)
Local government workers - Males: Dover:
1.2% (11)Florida:
5.0% (277,922)
Self-employed workers in own not incorporated business - Males: Dover:
9.0% (83)Florida:
7.0% (387,943)
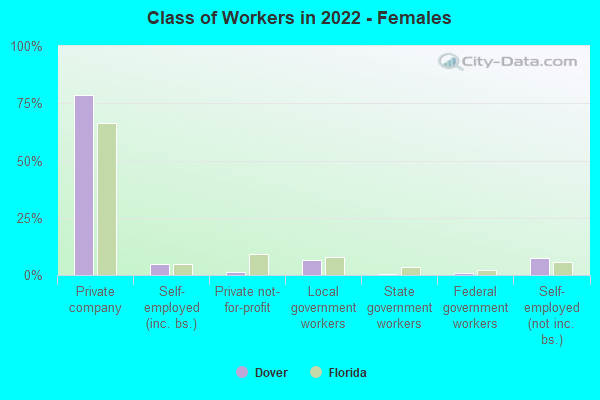
Employee of private company - Females: Dover:
78.5% (398)Florida:
66.6% (3,318,024)
Self-employed in own incorporated business - Females: Dover:
4.8% (24)Florida:
4.6% (231,468)
Private not-for-profit wage and salary workers - Females: Dover:
1.3% (6)Florida:
9.3% (463,990)
Local government workers - Females: Dover:
6.5% (33)Florida:
7.9% (393,805)
State government workers - Females: Dover:
0.6% (3)Florida:
3.4% (171,347)
Federal government workers - Females: Dover:
0.8% (4)Florida:
2.0% (99,276)
Self-employed workers in own not incorporated business - Females: Dover:
7.5% (38)Florida:
5.9% (292,650)