Work and Jobs in Electric City, Washington (WA) Detailed Stats
Occupations, Industries, Unemployment, Workers, Commute
Settings
X


Recent posts about work in Electric City, Washington on our local forum with over 2,400,000 registered users:
 | Help me find a lovely little Washington town? (31 replies) |
| Returning to the USA: Grand Coulee, Electric City? (7 replies) |
| Electric City, Wa State (3 replies) |
| Where to live? (11 replies) |
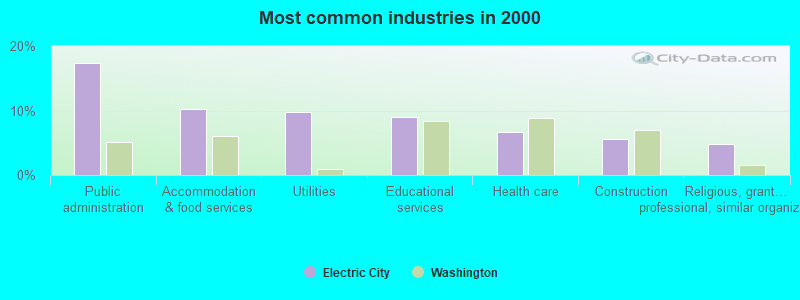
The most common industries in Electric City are: Public administration (17.4% of civilian employees), Accommodation & food services (10.3% of civilian employees), Utilities (9.8% of civilian employees). 81.3% of workers work in Grant County. 29.9% of workers are employees of private companies, which is 121.0% less than the rate of 66.0% across the entire state of Washington.
Whole page based on the data from 2000 / 2022 when the population of Electric City, Washington was 922 / 748
Whole page based on the data from 2000 / 2022 when the population of Electric City, Washington was 922 / 748
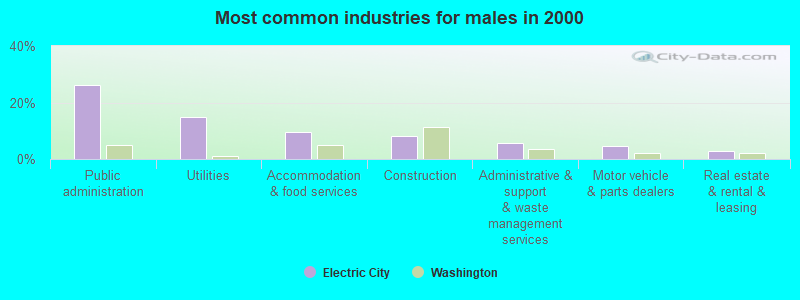
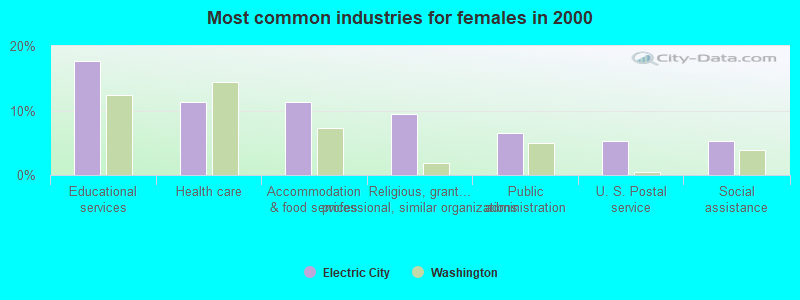
Most common industries
Most common industries | |||
|---|---|---|---|
Industry | All | Males | Females |
| Public administration | 17.4% (66) | 26.2% (55) | 6.5% (11) |
| Accommodation and food services | 10.3% (39) | 9.5% (20) | 11.2% (19) |
| Utilities | 9.8% (37) | 14.8% (31) | 3.6% (6) |
| Educational services | 9.0% (34) | 1.9% (4) | 17.8% (30) |
| Health care | 6.6% (25) | 2.9% (6) | 11.2% (19) |
| Construction | 5.5% (21) | 8.1% (17) | 2.4% (4) |
| Religious, grantmaking, civic, professional, and similar organizations | 4.7% (18) | 1.0% (2) | 9.5% (16) |
| Motor vehicle and parts dealers | 3.7% (14) | 4.8% (10) | 2.4% (4) |
| Administrative and support and waste management services | 3.2% (12) | 5.7% (12) | 0.0% (0) |
| Social assistance | 2.9% (11) | 1.0% (2) | 5.3% (9) |
| U. S. Postal service | 2.4% (9) | 0.0% (0) | 5.3% (9) |
| Arts, entertainment, and recreation | 2.4% (9) | 1.0% (2) | 4.1% (7) |
| Other transportation, and support activities, and couriers | 2.1% (8) | 1.9% (4) | 2.4% (4) |
| Real estate and rental and leasing | 2.1% (8) | 2.9% (6) | 1.2% (2) |
| Food and beverage stores | 2.1% (8) | 1.9% (4) | 2.4% (4) |
| Personal and laundry services | 1.6% (6) | 1.0% (2) | 2.4% (4) |
| Finance and insurance | 1.3% (5) | 1.0% (2) | 1.8% (3) |
| Building material and garden equipment and supplies dealers | 1.1% (4) | 1.0% (2) | 1.2% (2) |
| Clothing and accessories, including shoe, stores | 1.1% (4) | 0.0% (0) | 2.4% (4) |
| Professional, scientific, and technical services | 1.1% (4) | 1.9% (4) | 0.0% (0) |
| Metal and metal products | 0.8% (3) | 1.4% (3) | 0.0% (0) |
| Food | 0.8% (3) | 1.4% (3) | 0.0% (0) |
| Miscellaneous nondurable goods merchant wholesalers | 0.8% (3) | 1.4% (3) | 0.0% (0) |
| Repair and maintenance | 0.8% (3) | 0.5% (1) | 1.2% (2) |
| Beverage and tobacco products | 0.5% (2) | 1.0% (2) | 0.0% (0) |
| Radio, TV, and computer stores | 0.5% (2) | 0.0% (0) | 1.2% (2) |
| Apparel | 0.5% (2) | 0.0% (0) | 1.2% (2) |
| Farm supplies merchant wholesalers | 0.5% (2) | 1.0% (2) | 0.0% (0) |
| Transportation equipment | 0.5% (2) | 1.0% (2) | 0.0% (0) |
| Metals and minerals, except petroleum, merchant wholesalers | 0.5% (2) | 1.0% (2) | 0.0% (0) |
| Publishing, and motion picture and sound recording industries | 0.5% (2) | 0.0% (0) | 1.2% (2) |
| Broadcasting and telecommunications | 0.5% (2) | 1.0% (2) | 0.0% (0) |
| Data processing, libraries, and other information services | 0.5% (2) | 0.0% (0) | 1.2% (2) |
| Gasoline stations | 0.5% (2) | 0.0% (0) | 1.2% (2) |
| Nonmetallic mineral products | 0.5% (2) | 1.0% (2) | 0.0% (0) |
| Agriculture, forestry, fishing and hunting | 0.5% (2) | 1.0% (2) | 0.0% (0) |
| Paper | 0.3% (1) | 0.5% (1) | 0.0% (0) |
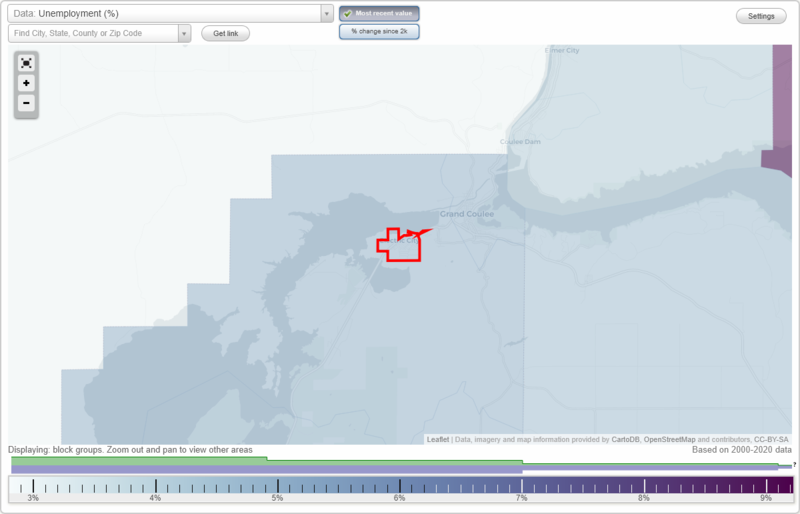
Unemployment in Electric City
- Unemployment by race in 2000
- Unemployment rate for White non-Hispanic residents
- 2.5%Males
- 10.4%Females
- Unemployment rate for American Indian and Alaska Native residents
- 15.4%Males
- 23.1%Females
- Unemployment rate for two or more race residents
- 50.0%Males
- 66.7%Females
Time leaving home to go to work
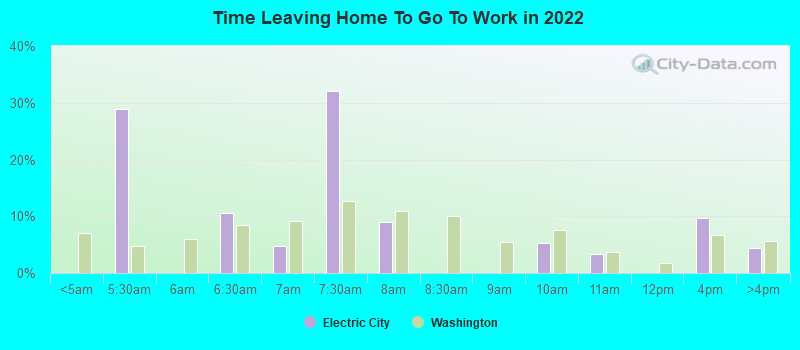
5:00 a.m. to 5:29 a.m.:
| Electric City: | 28.9% (72) |
| Washington: | 4.8% (147,787) |
6:00 a.m. to 6:29 a.m.:
| Electric City: | 10.6% (27) |
| Washington: | 8.4% (257,617) |
6:30 a.m. to 6:59 a.m.:
| Electric City: | 4.8% (12) |
| Washington: | 9.1% (277,560) |
7:00 a.m. to 7:29 a.m.:
| Electric City: | 32.0% (80) |
| Washington: | 12.7% (387,691) |
7:30 a.m. to 7:59 a.m.:
| Electric City: | 9.0% (23) |
| Washington: | 11.0% (335,322) |
9:00 a.m. to 9:59 a.m.:
| Electric City: | 5.4% (13) |
| Washington: | 7.6% (231,053) |
10:00 a.m. to 10:59 a.m.:
| Electric City: | 3.3% (8) |
| Washington: | 3.7% (111,784) |
12:00 p.m. to 3:59 p.m.:
| Electric City: | 9.6% (24) |
| Washington: | 6.7% (205,284) |
4:00 p.m. to 11:59 p.m.:
| Electric City: | 4.4% (11) |
| Washington: | 5.7% (174,677) |
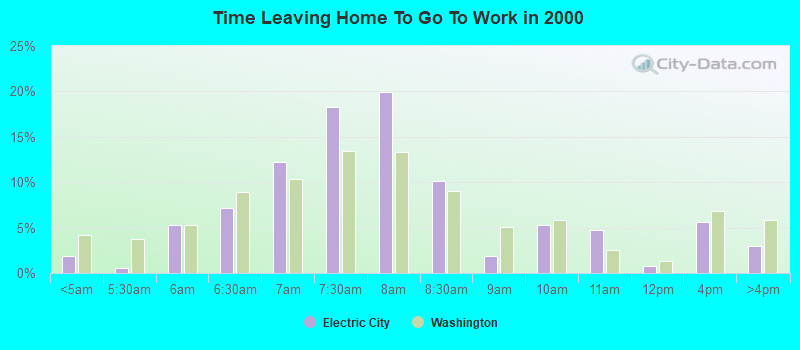
<5am:
| Electric City: | 1.9% (7) |
| Washington: | 4.2% (115,997) |
5:30am:
| Electric City: | 0.5% (2) |
| Washington: | 3.7% (102,868) |
6am:
| Electric City: | 5.3% (20) |
| Washington: | 5.3% (147,812) |
6:30am:
| Electric City: | 7.2% (27) |
| Washington: | 8.9% (248,462) |
7am:
| Electric City: | 12.2% (46) |
| Washington: | 10.3% (288,005) |
7:30am:
| Electric City: | 18.3% (69) |
| Washington: | 13.5% (375,030) |
8am:
| Electric City: | 19.9% (75) |
| Washington: | 13.4% (372,576) |
8:30am:
| Electric City: | 10.1% (38) |
| Washington: | 9.0% (252,058) |
9am:
| Electric City: | 1.9% (7) |
| Washington: | 5.1% (141,936) |
10am:
| Electric City: | 5.3% (20) |
| Washington: | 5.8% (161,204) |
11am:
| Electric City: | 4.8% (18) |
| Washington: | 2.5% (70,123) |
12pm:
| Electric City: | 0.8% (3) |
| Washington: | 1.3% (35,612) |
4pm:
| Electric City: | 5.6% (21) |
| Washington: | 6.8% (190,565) |
>4pm:
| Electric City: | 2.9% (11) |
| Washington: | 5.8% (162,401) |
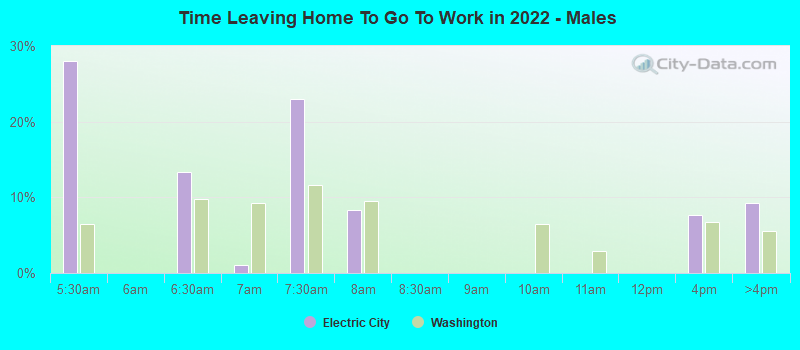
5:00 a.m. to 5:29 a.m. - Males:
| Electric City: | 28.0% (35) |
| Washington: | 6.5% (110,295) |
6:00 a.m. to 6:29 a.m. - Males:
| Electric City: | 13.3% (17) |
| Washington: | 9.8% (166,050) |
6:30 a.m. to 6:59 a.m. - Males:
| Electric City: | 1.1% (1) |
| Washington: | 9.3% (158,128) |
7:00 a.m. to 7:29 a.m. - Males:
| Electric City: | 23.0% (29) |
| Washington: | 11.7% (198,720) |
7:30 a.m. to 7:59 a.m. - Males:
| Electric City: | 8.4% (11) |
| Washington: | 9.6% (162,900) |
12:00 p.m. to 3:59 p.m. - Males:
| Electric City: | 7.7% (10) |
| Washington: | 6.8% (115,643) |
4:00 p.m. to 11:59 p.m. - Males:
| Electric City: | 9.2% (12) |
| Washington: | 5.6% (95,440) |
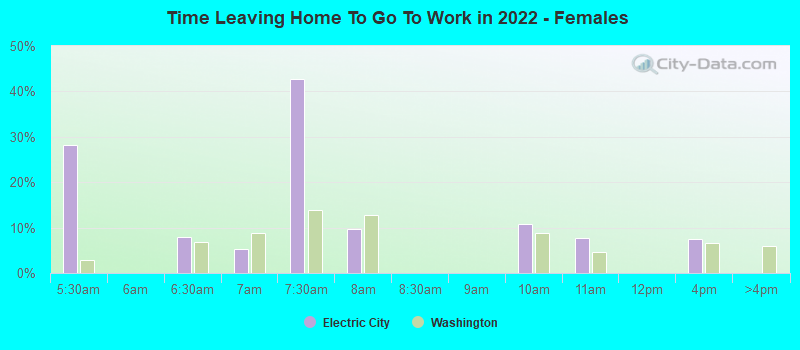
5:00 a.m. to 5:29 a.m. - Females:
| Electric City: | 28.2% (35) |
| Washington: | 2.8% (37,492) |
6:00 a.m. to 6:29 a.m. - Females:
| Electric City: | 8.0% (10) |
| Washington: | 6.8% (91,567) |
6:30 a.m. to 6:59 a.m. - Females:
| Electric City: | 5.3% (7) |
| Washington: | 8.8% (119,432) |
7:00 a.m. to 7:29 a.m. - Females:
| Electric City: | 42.8% (53) |
| Washington: | 13.9% (188,971) |
7:30 a.m. to 7:59 a.m. - Females:
| Electric City: | 9.7% (12) |
| Washington: | 12.7% (172,422) |
9:00 a.m. to 9:59 a.m. - Females:
| Electric City: | 10.8% (13) |
| Washington: | 8.8% (119,802) |
10:00 a.m. to 10:59 a.m. - Females:
| Electric City: | 7.8% (10) |
| Washington: | 4.6% (61,816) |
12:00 p.m. to 3:59 p.m. - Females:
| Electric City: | 7.5% (9) |
| Washington: | 6.6% (89,641) |
Travel time to work
Percentage of workers working in this county: 81.3%
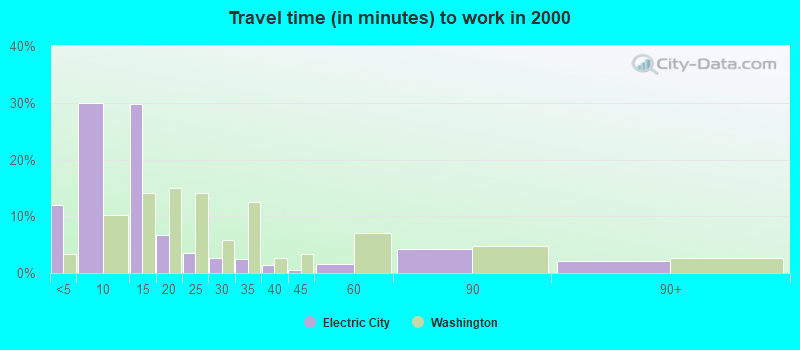
Less than 5 minutes:
| Electric City: | 11.9% (45) |
| Washington: | 3.3% (91,132) |
5 to 9 minutes:
| Electric City: | 30.0% (113) |
| Washington: | 10.3% (286,517) |
10 to 14 minutes:
| Electric City: | 29.7% (112) |
| Washington: | 14.1% (391,606) |
15 to 19 minutes:
| Electric City: | 6.6% (25) |
| Washington: | 15.0% (418,990) |
20 to 24 minutes:
| Electric City: | 3.4% (13) |
| Washington: | 14.2% (394,209) |
25 to 29 minutes:
| Electric City: | 2.7% (10) |
| Washington: | 5.8% (162,590) |
30 to 34 minutes:
| Electric City: | 2.4% (9) |
| Washington: | 12.5% (348,311) |
35 to 39 minutes:
| Electric City: | 1.3% (5) |
| Washington: | 2.6% (73,592) |
40 to 44 minutes:
| Electric City: | 0.5% (2) |
| Washington: | 3.4% (95,182) |
45 to 59 minutes:
| Electric City: | 1.6% (6) |
| Washington: | 7.0% (195,343) |
60 to 89 minutes:
| Electric City: | 4.2% (16) |
| Washington: | 4.7% (131,691) |
90 or more minutes:
| Electric City: | 2.1% (8) |
| Washington: | 2.7% (75,486) |
Means of transportation to work
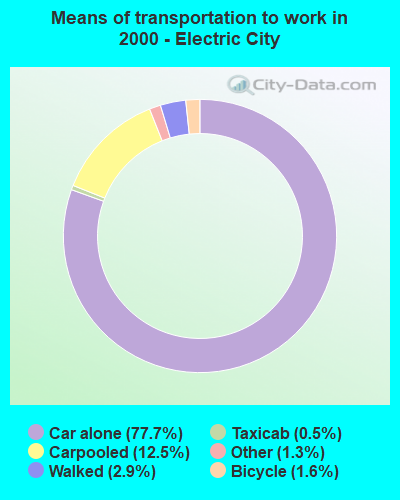

Drove car alone:
| Electric City: | 77.7% (293) |
| Washington: | 73.3% (2,040,833) |
Carpooled:
| Electric City: | 12.5% (47) |
| Washington: | 12.8% (357,742) |
Taxicab:
| Electric City: | 0.5% (2) |
| Washington: | 0.1% (1,417) |
Bicycle:
| Electric City: | 1.6% (6) |
| Washington: | 0.6% (16,205) |
Walked:
| Electric City: | 2.9% (11) |
| Washington: | 3.2% (89,739) |
Other means:
| Electric City: | 1.3% (5) |
| Washington: | 0.7% (19,499) |
Private vehicle occupancy
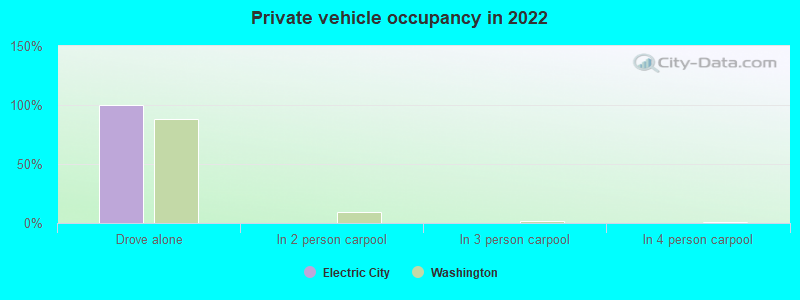
Drove alone:
| Electric City: | 99.6% (206) |
| Washington: | 87.8% (2,415,775) |
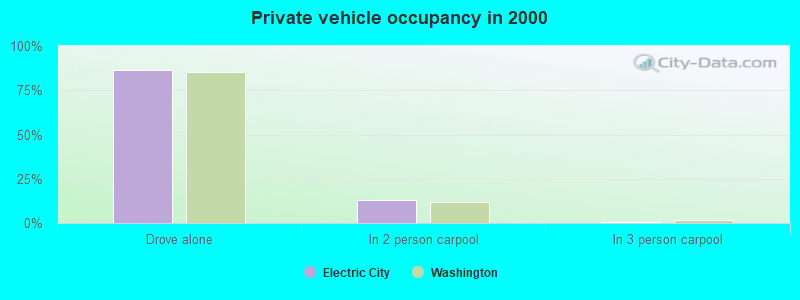
Drove alone:
| Electric City: | 86.2% (293) |
| Washington: | 85.1% (2,040,833) |
In 2 person carpool:
| Electric City: | 13.2% (45) |
| Washington: | 11.8% (282,638) |
In 3 person carpool:
| Electric City: | 0.6% (2) |
| Washington: | 1.9% (44,791) |
Class of workers
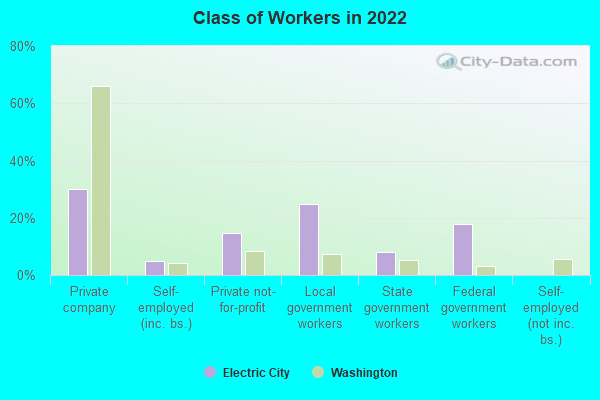
Employee of private company:
| Electric City: | 29.9% (73) |
| Washington: | 66.0% (2,552,907) |
Self-employed in own incorporated business:
| Electric City: | 5.0% (12) |
| Washington: | 4.2% (161,426) |
Private not-for-profit wage and salary workers:
| Electric City: | 14.5% (35) |
| Washington: | 8.6% (330,637) |
Local government workers:
| Electric City: | 24.9% (60) |
| Washington: | 7.3% (281,034) |
State government workers:
| Electric City: | 7.9% (19) |
| Washington: | 5.2% (201,670) |
Federal government workers:
| Electric City: | 17.8% (43) |
| Washington: | 3.1% (118,044) |
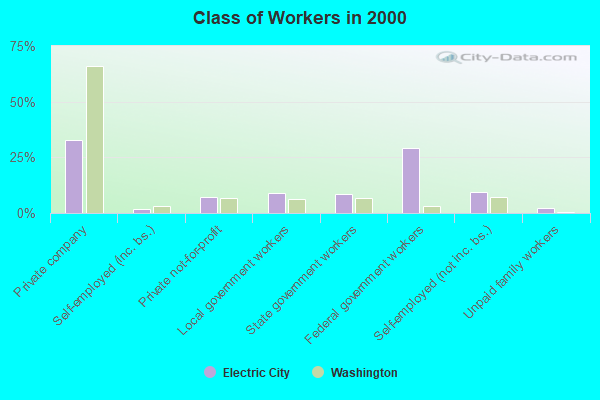
Employee of private company:
| Electric City: | 33.0% (125) |
| Washington: | 66.0% (1,843,000) |
Self-employed in own incorporated business:
| Electric City: | 1.6% (6) |
| Washington: | 3.2% (90,102) |
Private not-for-profit wage and salary workers:
| Electric City: | 7.4% (28) |
| Washington: | 6.9% (191,927) |
Local government workers:
| Electric City: | 9.0% (34) |
| Washington: | 6.4% (178,161) |
State government workers:
| Electric City: | 8.4% (32) |
| Washington: | 6.9% (192,408) |
Federal government workers:
| Electric City: | 29.0% (110) |
| Washington: | 3.2% (89,153) |
Self-employed workers in own not incorporated business:
| Electric City: | 9.5% (36) |
| Washington: | 7.2% (199,827) |
Unpaid family workers:
| Electric City: | 2.1% (8) |
| Washington: | 0.3% (9,144) |
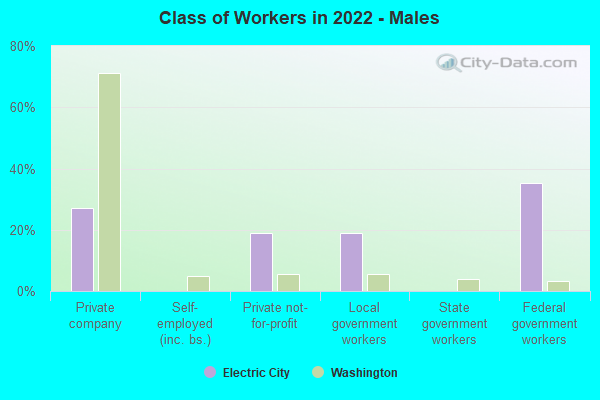
Employee of private company - Males:
| Electric City: | 27.0% (33) |
| Washington: | 71.1% (1,491,511) |
Private not-for-profit wage and salary workers - Males:
| Electric City: | 18.9% (23) |
| Washington: | 5.5% (116,374) |
Local government workers - Males:
| Electric City: | 18.9% (23) |
| Washington: | 5.4% (114,033) |
Federal government workers - Males:
| Electric City: | 35.2% (43) |
| Washington: | 3.4% (70,622) |
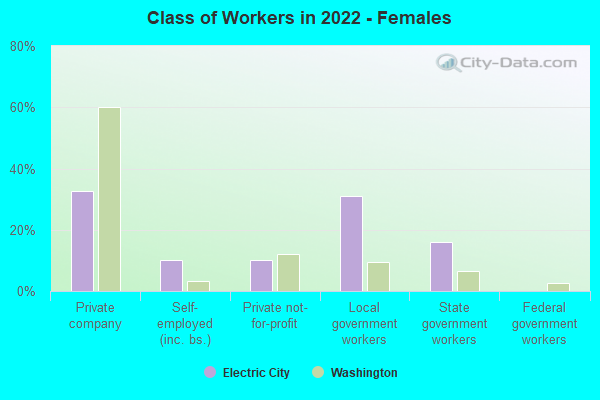
Employee of private company - Females:
| Electric City: | 32.8% (39) |
| Washington: | 60.0% (1,061,396) |
Self-employed in own incorporated business - Females:
| Electric City: | 10.1% (12) |
| Washington: | 3.3% (58,377) |
Private not-for-profit wage and salary workers - Females:
| Electric City: | 10.1% (12) |
| Washington: | 12.1% (214,263) |
Local government workers - Females:
| Electric City: | 31.1% (37) |
| Washington: | 9.4% (167,001) |
State government workers - Females:
| Electric City: | 16.0% (19) |
| Washington: | 6.6% (116,701) |