Work and Jobs in Ewing, Illinois (IL) Detailed Stats
Occupations, Industries, Unemployment, Workers, Commute
Settings
X


Recent posts about work in Ewing, Illinois on our local forum with over 2,400,000 registered users:
 | Remembering great restaurants (65 replies) |
| Chicago: #4 economically in the world? (46 replies) |
| Moving to Bloomington-Normal from Madison, WI (13 replies) |
| Peoria-walkable urban areas (43 replies) |
| Might move to Marion area, looking for info (29 replies) |
| Hispanic comunity (19 replies) |
Latest news about work in Ewing, IL collected exclusively by city-data.com from local newspapers, TV, and radio stations
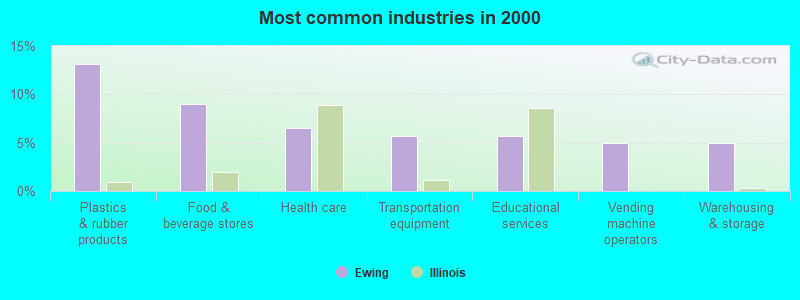
The most common industries in Ewing are: Plastics & rubber products (13.1% of civilian employees), Food & beverage stores (9.0% of civilian employees), Health care (6.6% of civilian employees). 43.5% of workers work in Franklin County and 3.1% of all workers work at home. 60.6% of workers are employees of private companies, which is 12.7% less than the rate of 68.3% across the entire state of Illinois.
Whole page based on the data from 2000 / 2022 when the population of Ewing, Illinois was 310 / 391
Whole page based on the data from 2000 / 2022 when the population of Ewing, Illinois was 310 / 391
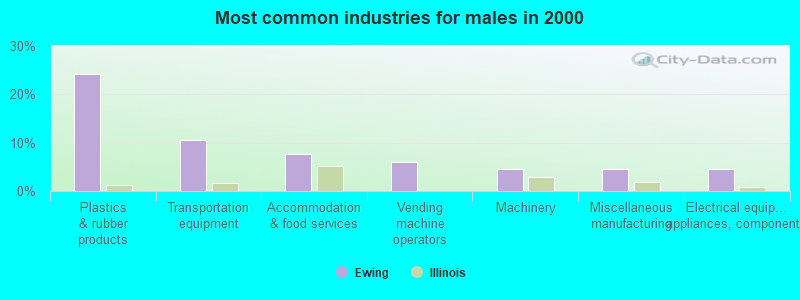
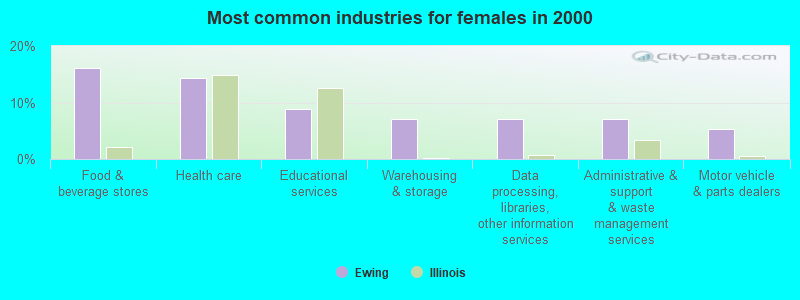
Most common industries
Most common industries | |||
|---|---|---|---|
Industry | All | Males | Females |
| Plastics and rubber products | 13.1% (16) | 24.2% (16) | 0.0% (0) |
| Food and beverage stores | 9.0% (11) | 3.0% (2) | 16.1% (9) |
| Health care | 6.6% (8) | 0.0% (0) | 14.3% (8) |
| Transportation equipment | 5.7% (7) | 10.6% (7) | 0.0% (0) |
| Educational services | 5.7% (7) | 3.0% (2) | 8.9% (5) |
| Vending machine operators | 4.9% (6) | 6.1% (4) | 3.6% (2) |
| Warehousing and storage | 4.9% (6) | 3.0% (2) | 7.1% (4) |
| Administrative and support and waste management services | 4.9% (6) | 3.0% (2) | 7.1% (4) |
| Other transportation, and support activities, and couriers | 4.1% (5) | 4.5% (3) | 3.6% (2) |
| Utilities | 4.1% (5) | 4.5% (3) | 3.6% (2) |
| Accommodation and food services | 4.1% (5) | 7.6% (5) | 0.0% (0) |
| Metal and metal products | 3.3% (4) | 3.0% (2) | 3.6% (2) |
| Data processing, libraries, and other information services | 3.3% (4) | 0.0% (0) | 7.1% (4) |
| Miscellaneous manufacturing | 2.5% (3) | 4.5% (3) | 0.0% (0) |
| Machinery | 2.5% (3) | 4.5% (3) | 0.0% (0) |
| Motor vehicle and parts dealers | 2.5% (3) | 0.0% (0) | 5.4% (3) |
| Electrical equipment, appliances, and components | 2.5% (3) | 4.5% (3) | 0.0% (0) |
| Broadcasting and telecommunications | 2.5% (3) | 0.0% (0) | 5.4% (3) |
| Public administration | 1.6% (2) | 0.0% (0) | 3.6% (2) |
| Miscellaneous nondurable goods merchant wholesalers | 1.6% (2) | 0.0% (0) | 3.6% (2) |
| Department and other general merchandise stores | 1.6% (2) | 0.0% (0) | 3.6% (2) |
| Printing and related support activities | 1.6% (2) | 3.0% (2) | 0.0% (0) |
| Truck transportation | 1.6% (2) | 3.0% (2) | 0.0% (0) |
| Finance and insurance | 1.6% (2) | 0.0% (0) | 3.6% (2) |
| Professional, scientific, and technical services | 1.6% (2) | 3.0% (2) | 0.0% (0) |
| Repair and maintenance | 1.6% (2) | 3.0% (2) | 0.0% (0) |
| Other direct selling establishments | 0.8% (1) | 1.5% (1) | 0.0% (0) |
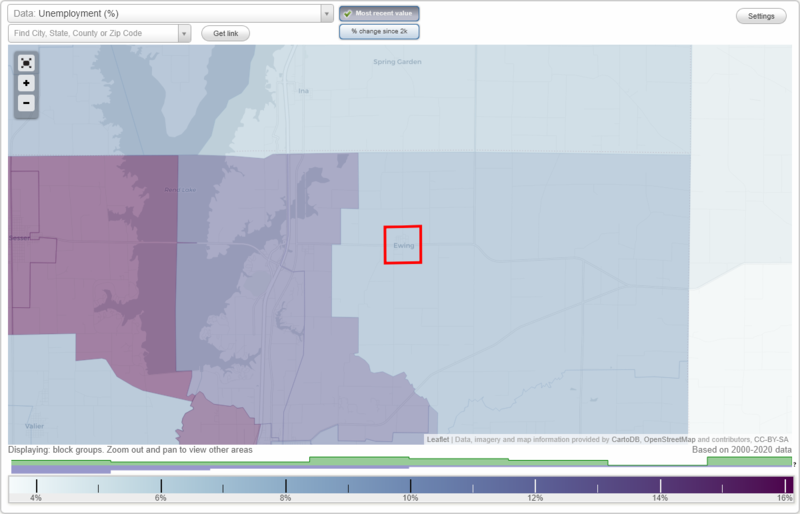
Unemployment in Ewing
- Unemployment by race in 2022
- Unemployment rate for White non-Hispanic residents
- 7.1%Males
- 2.4%Females
- Unemployment by race in 2000
- Unemployment rate for White non-Hispanic residents
- 10.0%Males
Time leaving home to go to work
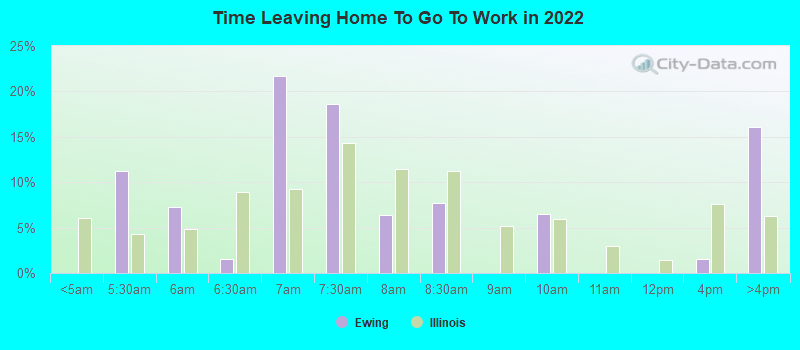
5:00 a.m. to 5:29 a.m.:
| Ewing: | 11.3% (20) |
| Illinois: | 4.3% (226,583) |
5:30 a.m. to 5:59 a.m.:
| Ewing: | 7.3% (13) |
| Illinois: | 4.9% (254,951) |
6:00 a.m. to 6:29 a.m.:
| Ewing: | 1.5% (3) |
| Illinois: | 8.9% (466,416) |
6:30 a.m. to 6:59 a.m.:
| Ewing: | 21.7% (39) |
| Illinois: | 9.3% (484,300) |
7:00 a.m. to 7:29 a.m.:
| Ewing: | 18.6% (33) |
| Illinois: | 14.3% (746,798) |
7:30 a.m. to 7:59 a.m.:
| Ewing: | 6.4% (11) |
| Illinois: | 11.5% (597,236) |
8:00 a.m. to 8:29 a.m.:
| Ewing: | 7.7% (14) |
| Illinois: | 11.2% (585,810) |
9:00 a.m. to 9:59 a.m.:
| Ewing: | 6.6% (12) |
| Illinois: | 6.0% (310,820) |
12:00 p.m. to 3:59 p.m.:
| Ewing: | 1.6% (3) |
| Illinois: | 7.6% (397,128) |
4:00 p.m. to 11:59 p.m.:
| Ewing: | 16.1% (29) |
| Illinois: | 6.3% (328,692) |
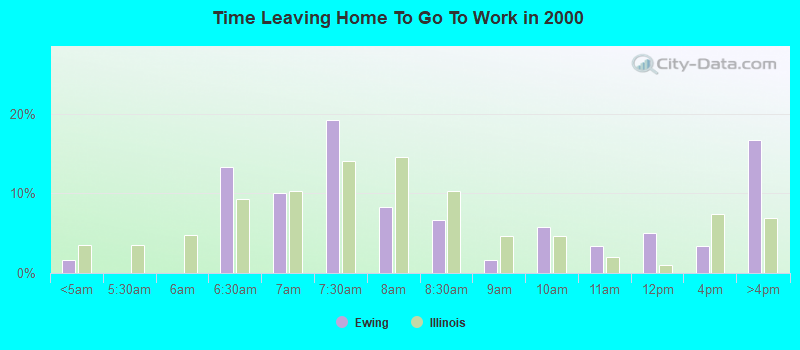
<5am:
| Ewing: | 1.7% (2) |
| Illinois: | 3.6% (205,429) |
6:30am:
| Ewing: | 13.3% (16) |
| Illinois: | 9.3% (532,224) |
7am:
| Ewing: | 10.0% (12) |
| Illinois: | 10.3% (593,196) |
7:30am:
| Ewing: | 19.2% (23) |
| Illinois: | 14.1% (808,399) |
8am:
| Ewing: | 8.3% (10) |
| Illinois: | 14.5% (834,444) |
8:30am:
| Ewing: | 6.7% (8) |
| Illinois: | 10.2% (588,282) |
9am:
| Ewing: | 1.7% (2) |
| Illinois: | 4.6% (266,648) |
10am:
| Ewing: | 5.8% (7) |
| Illinois: | 4.7% (269,854) |
11am:
| Ewing: | 3.3% (4) |
| Illinois: | 2.1% (118,418) |
12pm:
| Ewing: | 5.0% (6) |
| Illinois: | 1.0% (59,913) |
4pm:
| Ewing: | 3.3% (4) |
| Illinois: | 7.4% (425,049) |
>4pm:
| Ewing: | 16.7% (20) |
| Illinois: | 6.8% (393,506) |
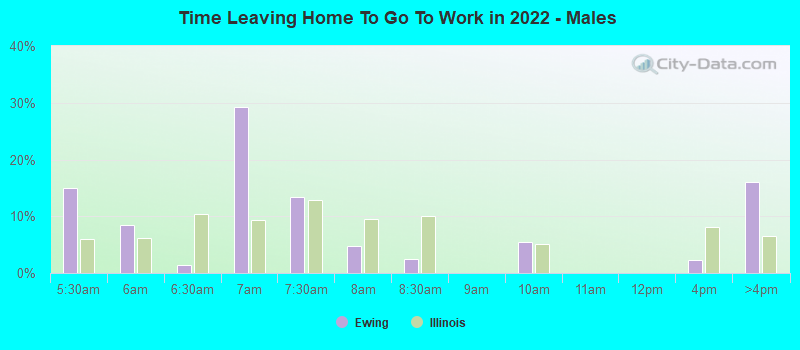
5:00 a.m. to 5:29 a.m. - Males:
| Ewing: | 15.0% (19) |
| Illinois: | 5.9% (165,953) |
5:30 a.m. to 5:59 a.m. - Males:
| Ewing: | 8.5% (11) |
| Illinois: | 6.1% (170,969) |
6:00 a.m. to 6:29 a.m. - Males:
| Ewing: | 1.5% (2) |
| Illinois: | 10.5% (292,003) |
6:30 a.m. to 6:59 a.m. - Males:
| Ewing: | 29.2% (36) |
| Illinois: | 9.4% (261,362) |
7:00 a.m. to 7:29 a.m. - Males:
| Ewing: | 13.4% (17) |
| Illinois: | 12.9% (360,098) |
7:30 a.m. to 7:59 a.m. - Males:
| Ewing: | 4.7% (6) |
| Illinois: | 9.5% (265,464) |
8:00 a.m. to 8:29 a.m. - Males:
| Ewing: | 2.4% (3) |
| Illinois: | 10.1% (280,890) |
9:00 a.m. to 9:59 a.m. - Males:
| Ewing: | 5.4% (7) |
| Illinois: | 5.1% (141,789) |
12:00 p.m. to 3:59 p.m. - Males:
| Ewing: | 2.3% (3) |
| Illinois: | 8.0% (224,733) |
4:00 p.m. to 11:59 p.m. - Males:
| Ewing: | 16.0% (20) |
| Illinois: | 6.4% (179,820) |
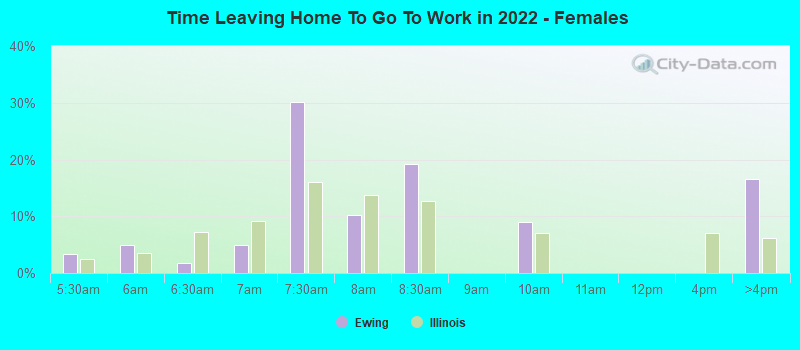
5:00 a.m. to 5:29 a.m. - Females:
| Ewing: | 3.3% (2) |
| Illinois: | 2.5% (60,630) |
5:30 a.m. to 5:59 a.m. - Females:
| Ewing: | 4.9% (3) |
| Illinois: | 3.5% (83,982) |
6:00 a.m. to 6:29 a.m. - Females:
| Ewing: | 1.7% (1) |
| Illinois: | 7.2% (174,413) |
6:30 a.m. to 6:59 a.m. - Females:
| Ewing: | 5.0% (3) |
| Illinois: | 9.2% (222,938) |
7:00 a.m. to 7:29 a.m. - Females:
| Ewing: | 30.1% (17) |
| Illinois: | 16.0% (386,700) |
7:30 a.m. to 7:59 a.m. - Females:
| Ewing: | 10.2% (6) |
| Illinois: | 13.7% (331,772) |
8:00 a.m. to 8:29 a.m. - Females:
| Ewing: | 19.3% (11) |
| Illinois: | 12.6% (304,920) |
9:00 a.m. to 9:59 a.m. - Females:
| Ewing: | 9.0% (5) |
| Illinois: | 7.0% (169,031) |
4:00 p.m. to 11:59 p.m. - Females:
| Ewing: | 16.6% (9) |
| Illinois: | 6.2% (148,872) |
Travel time to work
Percentage of workers working in this county: 43.5%
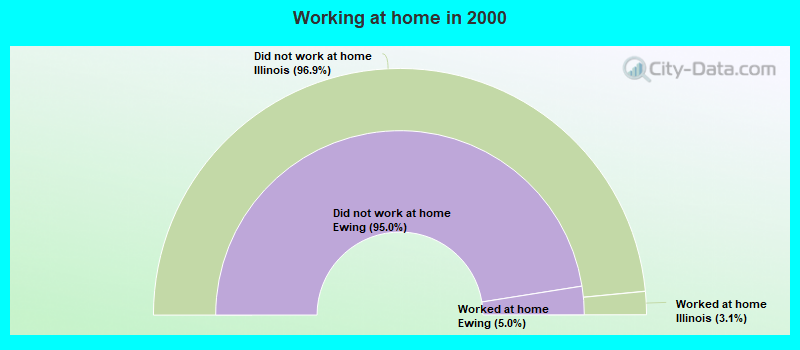
Number of people working at home: 6 (3.1% of all workers)
Number of people working at home: 6 (3.1% of all workers)
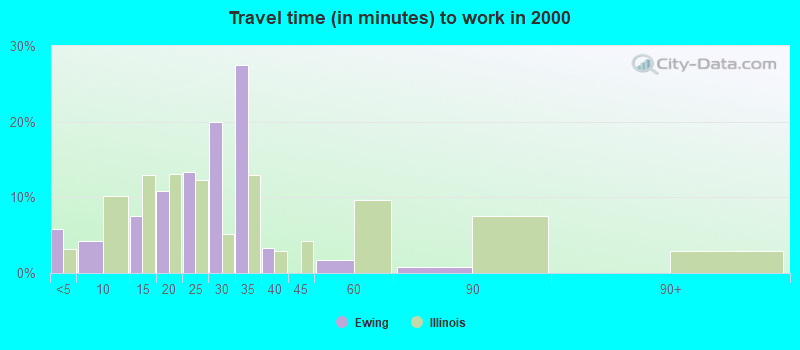
Less than 5 minutes:
| Ewing: | 5.8% (7) |
| Illinois: | 3.2% (183,600) |
5 to 9 minutes:
| Ewing: | 4.2% (5) |
| Illinois: | 10.2% (587,746) |
10 to 14 minutes:
| Ewing: | 7.5% (9) |
| Illinois: | 12.9% (743,149) |
15 to 19 minutes:
| Ewing: | 10.8% (13) |
| Illinois: | 13.0% (748,578) |
20 to 24 minutes:
| Ewing: | 13.3% (16) |
| Illinois: | 12.2% (703,743) |
25 to 29 minutes:
| Ewing: | 20.0% (24) |
| Illinois: | 5.2% (298,361) |
30 to 34 minutes:
| Ewing: | 27.5% (33) |
| Illinois: | 12.9% (741,188) |
35 to 39 minutes:
| Ewing: | 3.3% (4) |
| Illinois: | 2.9% (165,521) |
45 to 59 minutes:
| Ewing: | 1.7% (2) |
| Illinois: | 9.6% (551,290) |
60 to 89 minutes:
| Ewing: | 0.8% (1) |
| Illinois: | 7.5% (432,921) |
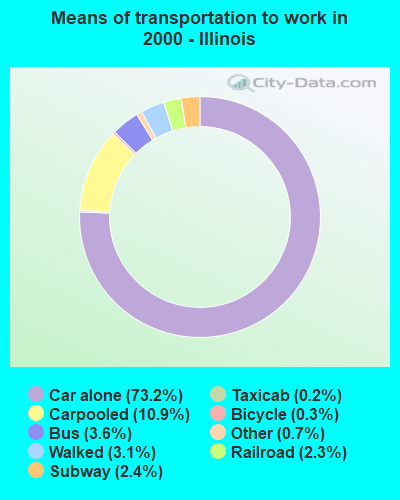
Means of transportation to work
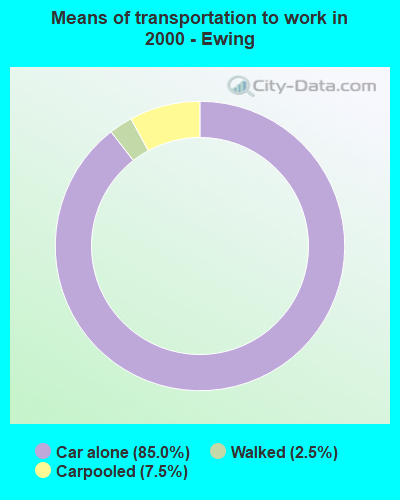
Drove car alone:
| Ewing: | 85.0% (102) |
| Illinois: | 73.2% (4,207,339) |
Carpooled:
| Ewing: | 7.5% (9) |
| Illinois: | 10.9% (625,411) |
Walked:
| Ewing: | 2.5% (3) |
| Illinois: | 3.1% (180,119) |
Private vehicle occupancy
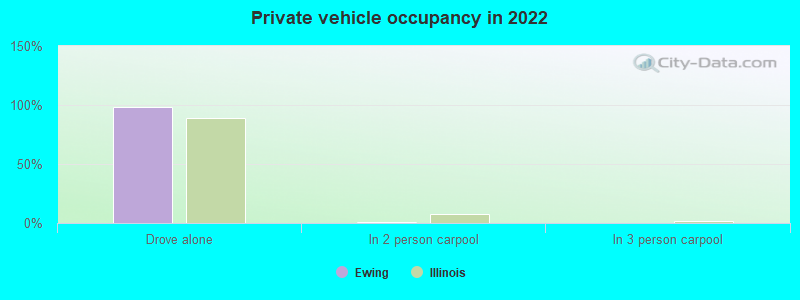
Drove alone:
| Ewing: | 98.3% (179) |
| Illinois: | 89.3% (4,089,987) |
In 2 person carpool:
| Ewing: | 1.1% (2) |
| Illinois: | 7.9% (361,887) |
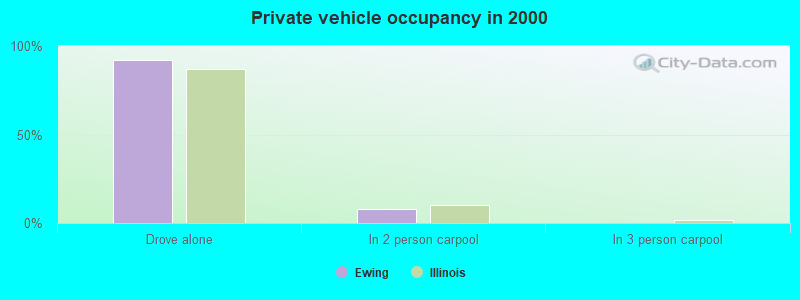
Drove alone:
| Ewing: | 91.9% (102) |
| Illinois: | 87.1% (4,207,339) |
In 2 person carpool:
| Ewing: | 8.1% (9) |
| Illinois: | 10.0% (484,652) |
Class of workers
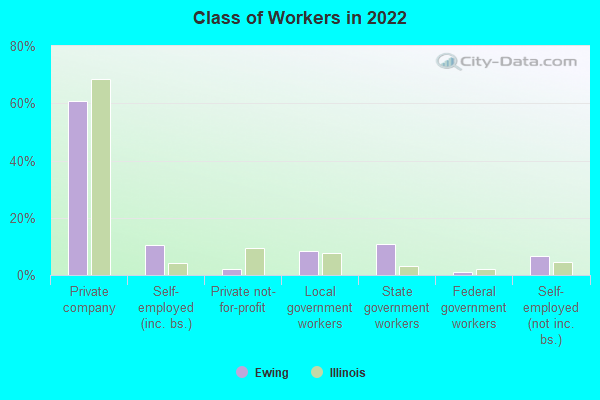
Employee of private company:
| Ewing: | 60.6% (117) |
| Illinois: | 68.3% (4,298,982) |
Self-employed in own incorporated business:
| Ewing: | 10.4% (20) |
| Illinois: | 4.3% (267,866) |
Private not-for-profit wage and salary workers:
| Ewing: | 2.1% (4) |
| Illinois: | 9.5% (597,909) |
Local government workers:
| Ewing: | 8.3% (16) |
| Illinois: | 7.8% (491,805) |
State government workers:
| Ewing: | 10.9% (21) |
| Illinois: | 3.3% (207,590) |
Federal government workers:
| Ewing: | 1.0% (2) |
| Illinois: | 1.9% (122,680) |
Self-employed workers in own not incorporated business:
| Ewing: | 6.7% (13) |
| Illinois: | 4.7% (295,989) |
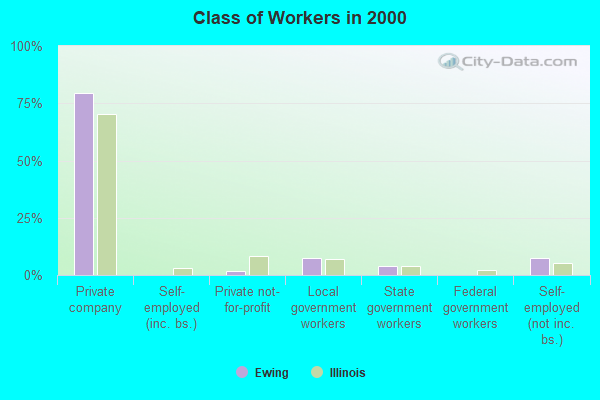
Employee of private company:
| Ewing: | 79.5% (97) |
| Illinois: | 70.3% (4,102,786) |
Private not-for-profit wage and salary workers:
| Ewing: | 1.6% (2) |
| Illinois: | 8.3% (484,163) |
Local government workers:
| Ewing: | 7.4% (9) |
| Illinois: | 6.8% (395,132) |
State government workers:
| Ewing: | 4.1% (5) |
| Illinois: | 3.8% (220,995) |
Self-employed workers in own not incorporated business:
| Ewing: | 7.4% (9) |
| Illinois: | 5.3% (307,691) |
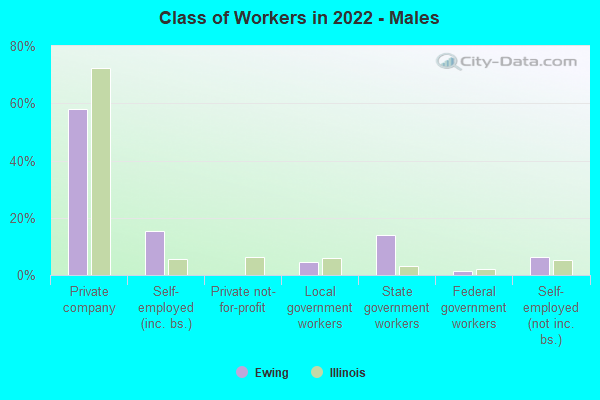
Employee of private company - Males:
| Ewing: | 58.1% (75) |
| Illinois: | 72.3% (2,390,375) |
Self-employed in own incorporated business - Males:
| Ewing: | 15.5% (20) |
| Illinois: | 5.4% (179,821) |
Local government workers - Males:
| Ewing: | 4.7% (6) |
| Illinois: | 5.9% (193,630) |
State government workers - Males:
| Ewing: | 14.0% (18) |
| Illinois: | 3.0% (98,934) |
Federal government workers - Males:
| Ewing: | 1.6% (2) |
| Illinois: | 2.0% (64,842) |
Self-employed workers in own not incorporated business - Males:
| Ewing: | 6.2% (8) |
| Illinois: | 5.1% (167,665) |
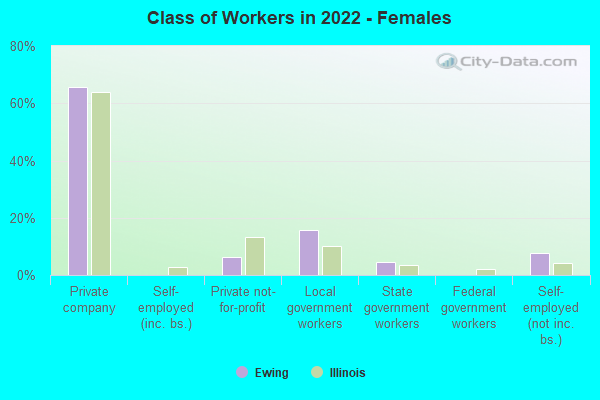
Employee of private company - Females:
| Ewing: | 65.6% (42) |
| Illinois: | 63.9% (1,908,607) |
Private not-for-profit wage and salary workers - Females:
| Ewing: | 6.2% (4) |
| Illinois: | 13.1% (392,281) |
Local government workers - Females:
| Ewing: | 15.6% (10) |
| Illinois: | 10.0% (298,175) |
State government workers - Females:
| Ewing: | 4.7% (3) |
| Illinois: | 3.6% (108,656) |
Self-employed workers in own not incorporated business - Females:
| Ewing: | 7.8% (5) |
| Illinois: | 4.3% (128,324) |