Work and Jobs in Georgetown, Connecticut (CT) Detailed Stats
Data:
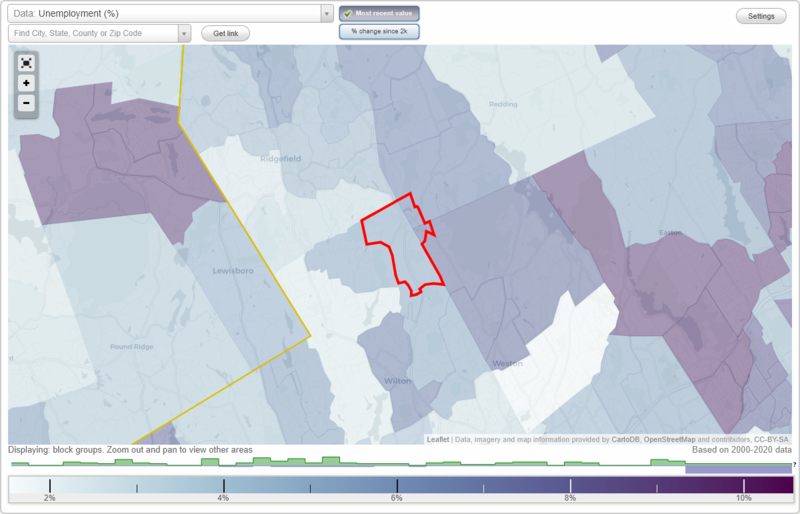
Unemployment (%)
Unemployment (% change since 2000)
Unemployment (%) - White
Unemployment (% change since 2000) - White
Unemployment (%) - Black or African American
Unemployment (% change since 2000) - Black or African American
Unemployment (%) - Asian
Unemployment (% change since 2000) - Asian
Unemployment (%) - Hispanic or Latino
Unemployment (% change since 2000) - Hispanic or Latino
Unemployment (%) - American Indian and Alaska Native
Unemployment (% change since 2000) - American Indian and Alaska Native
Unemployment (%) - Multirace
Unemployment (% change since 2000) - Multirace
Unemployment (%) - Other Race
Unemployment (% change since 2000) - Other Race
Industry diversity
Most Common Industries - Agriculture, forestry, fishing and hunting, and mining (%)
Most Common Industries - Agriculture, forestry, fishing and hunting (%)
Most Common Industries - Mining, quarrying, and oil and gas extraction (%)
Most Common Industries - Construction (%)
Most Common Industries - Manufacturing (%)
Most Common Industries - Wholesale trade (%)
Most Common Industries - Retail trade (%)
Most Common Industries - Transportation and warehousing, and utilities (%)
Most Common Industries - Transportation and warehousing (%)
Most Common Industries - Utilities (%)
Most Common Industries - Information (%)
Most Common Industries - Finance and insurance, and real estate and rental and leasing (%)
Most Common Industries - Finance and insurance (%)
Most Common Industries - Real estate and rental and leasing (%)
Most Common Industries - Professional, scientific, and management, and administrative and waste management services (%)
Most Common Industries - Professional, scientific, and technical services (%)
Most Common Industries - Management of companies and enterprises (%)
Most Common Industries - Administrative and support and waste management services (%)
Most Common Industries - Educational services, and health care and social assistance (%)
Most Common Industries - Educational services (%)
Most Common Industries - Health care and social assistance (%)
Most Common Industries - Arts, entertainment, and recreation, and accommodation and food services (%)
Most Common Industries - Arts, entertainment, and recreation (%)
Most Common Industries - Accommodation and food services (%)
Most Common Industries - Other services, except public administration (%)
Most Common Industries - Public administration (%)
Occupation diversity
Most Common Occupations - Management, business, science, and arts occupations (%)
Most Common Occupations - Management, business, and financial occupations (%)
Most Common Occupations - Management occupations (%)
Most Common Occupations - Business and financial operations occupations (%)
Most Common Occupations - Computer, engineering, and science occupations (%)
Most Common Occupations - Computer and mathematical occupations (%)
Most Common Occupations - Architecture and engineering occupations (%)
Most Common Occupations - Life, physical, and social science occupations (%)
Most Common Occupations - Education, legal, community service, arts, and media occupations (%)
Most Common Occupations - Community and social service occupations (%)
Most Common Occupations - Legal occupations (%)
Most Common Occupations - Education, training, and library occupations (%)
Most Common Occupations - Arts, design, entertainment, sports, and media occupations (%)
Most Common Occupations - Healthcare practitioners and technical occupations (%)
Most Common Occupations - Health diagnosing and treating practitioners and other technical occupations (%)
Most Common Occupations - Health technologists and technicians (%)
Most Common Occupations - Service occupations (%)
Most Common Occupations - Healthcare support occupations (%)
Most Common Occupations - Protective service occupations (%)
Most Common Occupations - Fire fighting and prevention, and other protective service workers including supervisors (%)
Most Common Occupations - Law enforcement workers including supervisors (%)
Most Common Occupations - Food preparation and serving related occupations (%)
Most Common Occupations - Building and grounds cleaning and maintenance occupations (%)
Most Common Occupations - Personal care and service occupations (%)
Most Common Occupations - Sales and office occupations (%)
Most Common Occupations - Sales and related occupations (%)
Most Common Occupations - Office and administrative support occupations (%)
Most Common Occupations - Natural resources, construction, and maintenance occupations (%)
Most Common Occupations - Farming, fishing, and forestry occupations (%)
Most Common Occupations - Construction and extraction occupations (%)
Most Common Occupations - Installation, maintenance, and repair occupations (%)
Most Common Occupations - Production, transportation, and material moving occupations (%)
Most Common Occupations - Production occupations (%)
Most Common Occupations - Transportation occupations (%)
Most Common Occupations - Material moving occupations (%)
Private vehicle occupancy - Drove alone (% change since 2000)
Private vehicle occupancy - Carpooled (%)
Private vehicle occupancy - Carpooled (% change since 2000)
Private vehicle occupancy - In 2-person carpool (%)
Private vehicle occupancy - In 2-person carpool (% change since 2000)
Private vehicle occupancy - In 3-person carpool (%)
Private vehicle occupancy - In 3-person carpool (% change since 2000)
Private vehicle occupancy - In 4-person carpool (%)
Private vehicle occupancy - In 4-person carpool (% change since 2000)
Private vehicle occupancy - In 5- or 6-person carpool (%)
Private vehicle occupancy - In 5- or 6-person carpool (% change since 2000)
Private vehicle occupancy - In 7-or-more-person carpool (%)
Private vehicle occupancy - In 7-or-more-person carpool (% change since 2000)
Time Leaving Home To Go To Work - 12:00 a.m. to 4:59 a.m. (%)
Time Leaving Home To Go To Work - 12:00 a.m. to 4:59 a.m. (% change since 2000)
Time Leaving Home To Go To Work - 5:00 a.m. to 5:59 a.m. (%)
Time Leaving Home To Go To Work - 5:00 a.m. to 5:59 a.m. (% change since 2000)
Time Leaving Home To Go To Work - 6:00 a.m. to 6:59 a.m. (%)
Time Leaving Home To Go To Work - 6:00 a.m. to 6:59 a.m. (% change since 2000)
Time Leaving Home To Go To Work - 7:00 a.m. to 7:59 a.m. (%)
Time Leaving Home To Go To Work - 7:00 a.m. to 7:59 a.m. (% change since 2000)
Time Leaving Home To Go To Work - 8:00 a.m. to 8:59 a.m. (%)
Time Leaving Home To Go To Work - 8:00 a.m. to 8:59 a.m. (% change since 2000)
Time Leaving Home To Go To Work - 9:00 a.m. to 9:59 a.m. (%)
Time Leaving Home To Go To Work - 9:00 a.m. to 9:59 a.m. (% change since 2000)
Time Leaving Home To Go To Work - 10:00 a.m. to 10:59 a.m. (%)
Time Leaving Home To Go To Work - 10:00 a.m. to 10:59 a.m. (% change since 2000)
Time Leaving Home To Go To Work - 11:00 a.m. to 11:59 a.m. (%)
Time Leaving Home To Go To Work - 11:00 a.m. to 11:59 a.m. (% change since 2000)
Time Leaving Home To Go To Work - 12:00 p.m. to 3:59 p.m. (%)
Time Leaving Home To Go To Work - 12:00 p.m. to 3:59 p.m. (% change since 2000)
Time Leaving Home To Go To Work - 4:00 p.m. to 11:59 p.m. (%)
Time Leaving Home To Go To Work - 4:00 p.m. to 11:59 p.m. (% change since 2000)
Class of Workers - Employee of private company (%)
Class of Workers - Employee of private company (% change since 2000)
Class of Workers - Self-employed in own incorporated business (%)
Class of Workers - Self-employed in own incorporated business (% change since 2000)
Class of Workers - Private not-for-profit wage and salary workers (%)
Class of Workers - Private not-for-profit wage and salary workers (% change since 2000)
Class of Workers - Local government workers (%)
Class of Workers - Local government workers (% change since 2000)
Class of Workers - State government workers (%)
Class of Workers - State government workers (% change since 2000)
Class of Workers - Federal government workers (%)
Class of Workers - Federal government workers (% change since 2000)
Class of Workers - Self-employed workers in own not incorporated business and Unpaid family workers (%)
Class of Workers - Self-employed workers in own not incorporated business and Unpaid family workers (% change since 2000)
Means of transportation to work - Drove car alone (%)
Means of transportation to work - Drove car alone (% change since 2000)
Means of transportation to work - Carpooled (%)
Means of transportation to work - Carpooled (% change since 2000)
Means of transportation to work - Public transportation (%)
Means of transportation to work - Public transportation (% change since 2000)
Means of transportation to work - Bus or trolley bus (%)
Means of transportation to work - Bus or trolley bus (% change since 2000)
Means of transportation to work - Streetcar or trolley car (%)
Means of transportation to work - Streetcar or trolley car (% change since 2000)
Means of transportation to work - Subway or elevated (%)
Means of transportation to work - Subway or elevated (% change since 2000)
Means of transportation to work - Railroad (%)
Means of transportation to work - Railroad (% change since 2000)
Means of transportation to work - Ferryboat (%)
Means of transportation to work - Ferryboat (% change since 2000)
Means of transportation to work - Taxicab (%)
Means of transportation to work - Taxicab (% change since 2000)
Means of transportation to work - Motorcycle (%)
Means of transportation to work - Motorcycle (% change since 2000)
Means of transportation to work - Bicycle (%)
Means of transportation to work - Bicycle (% change since 2000)
Means of transportation to work - Walked (%)
Means of transportation to work - Walked (% change since 2000)
Means of transportation to work - Other means (%)
Means of transportation to work - Other means (% change since 2000)
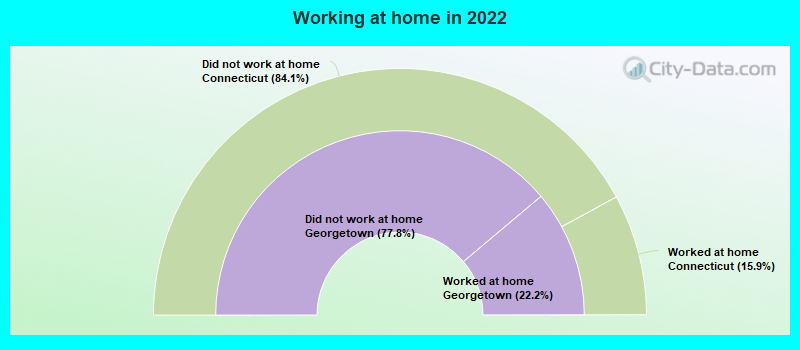
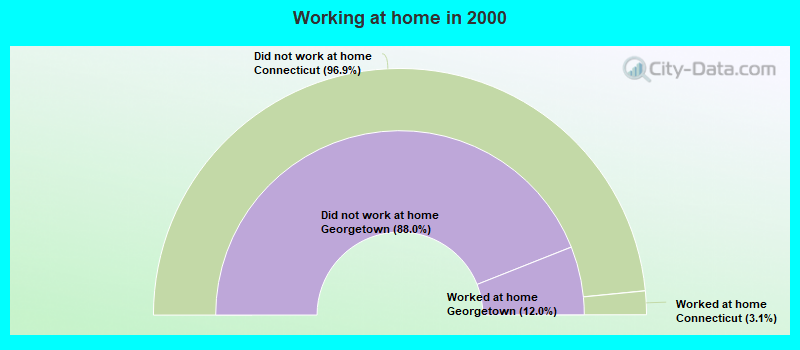
Working at home (%)
Working at home (% change since 2000)
Travel time to work - Less than 5 minutes (%)
Travel time to work - Less than 5 minutes (% change since 2000)
Travel time to work - 5 to 9 minutes (%)
Travel time to work - 5 to 9 minutes (% change since 2000)
Travel time to work - 10 to 19 minutes (%)
Travel time to work - 10 to 19 minutes (% change since 2000)
Travel time to work - 20 to 29 minutes (%)
Travel time to work - 20 to 29 minutes (% change since 2000)
Travel time to work - 30 to 39 minutes (%)
Travel time to work - 30 to 39 minutes (% change since 2000)
Travel time to work - 40 to 59 minutes (%)
Travel time to work - 40 to 59 minutes (% change since 2000)
Travel time to work - 60 to 89 minutes (%)
Travel time to work - 60 to 89 minutes (% change since 2000)
Travel time to work - 90 or more minutes (%)
Travel time to work - 90 or more minutes (% change since 2000)
Latest news about work in Georgetown, CT collected exclusively by city-data.com from local newspapers, TV, and radio stations
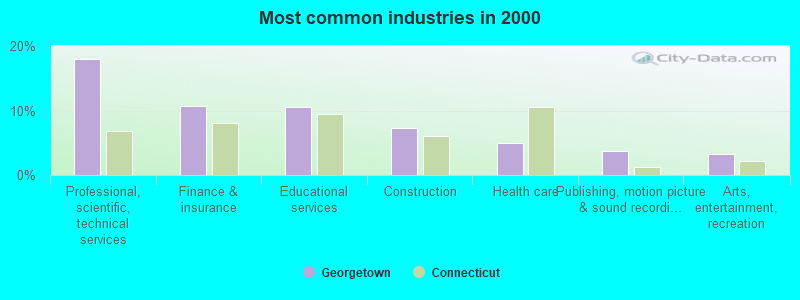
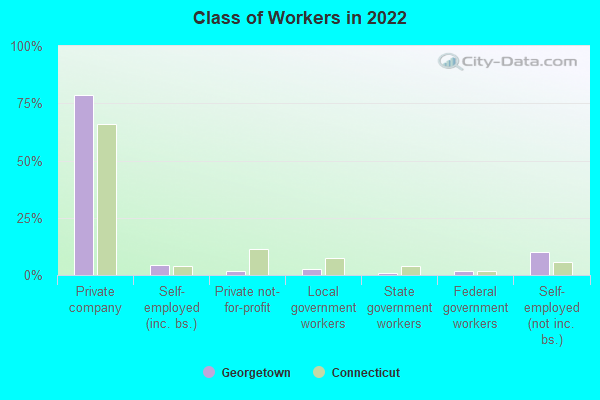
The most common industries in Georgetown are: Professional, scientific, technical services (17.9% of civilian employees), Finance & insurance (10.7% of civilian employees), Educational services (10.6% of civilian employees). 70.6% of workers work in Fairfield County and 17.6% of all workers work at home. 78.8% of workers are employees of private companies, which is 16.4% greater than the rate of 65.9% across the entire state of Connecticut.
Whole page based on the data from 2000 / 2022 when the population of Georgetown, Connecticut was 1,650 / 1,663
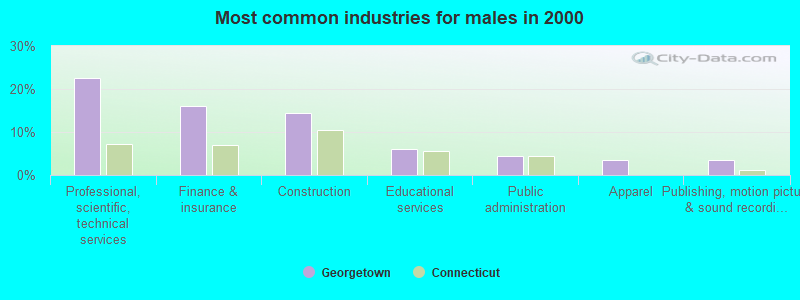
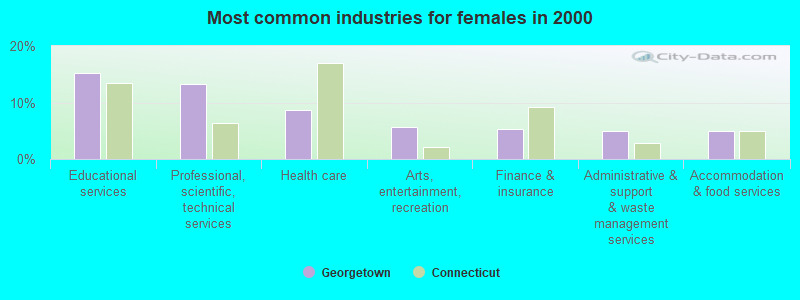
Most common industries
Most common industries Industry All Males Females
Professional, scientific, and technical services 17.9% 22.5% 13.3% Finance and insurance 10.7% 16.0% 5.4% Educational services 10.6% 6.0% 15.2% Construction 7.2% 14.4% 0.0% Health care 4.9% 1.2% 8.7% Publishing, and motion picture and sound recording industries 3.7% 3.5% 4.0% Arts, entertainment, and recreation 3.3% 0.9% 5.6% Public administration 3.1% 4.4% 1.9% Chemicals 3.1% 1.6% 4.7% Apparel 2.6% 3.5% 1.6% Administrative and support and waste management services 2.4% 0.0% 4.9% Accommodation and food services 2.4% 0.0% 4.9% Other transportation, and support activities, and couriers 2.0% 2.3% 1.6% Furniture and home furnishings, and household appliance stores 1.9% 0.0% 3.7% Computer and electronic products 1.7% 2.1% 1.4% Social assistance 1.6% 1.2% 2.1% Food 1.5% 0.0% 3.0% Broadcasting and telecommunications 1.5% 3.0% 0.0% Building material and garden equipment and supplies dealers 1.5% 3.0% 0.0% Apparel, fabrics, and notions merchant wholesalers 1.5% 3.0% 0.0% Miscellaneous nondurable goods merchant wholesalers 1.4% 1.2% 1.6% Real estate and rental and leasing 1.3% 1.4% 1.2% Metal and metal products 1.0% 0.0% 2.1% Sewing, needlework, and piece goods stores 0.9% 0.0% 1.9% Used merchandise, gift, novelty, and souvenir, and other miscellaneous stores 0.9% 0.0% 1.9% Machinery, equipment, and supplies merchant wholesalers 0.9% 0.0% 1.9% Petroleum and petroleum products merchant wholesalers 0.9% 0.0% 1.9% Radio, TV, and computer stores 0.9% 0.0% 1.9% Repair and maintenance 0.9% 1.9% 0.0% Food and beverage stores 0.8% 1.6% 0.0% Miscellaneous manufacturing 0.7% 1.4% 0.0% Data processing, libraries, and other information services 0.7% 1.4% 0.0% Professional and commercial equipment and supplies merchant wholesalers 0.7% 0.0% 1.4% Truck transportation 0.7% 1.4% 0.0% Personal and laundry services 0.7% 0.0% 1.4% Motor vehicle and parts dealers 0.6% 1.2% 0.0% Religious, grantmaking, civic, professional, and similar organizations 0.3% 0.0% 0.7%
Unemployment in Georgetown Unemployment by race in 2022
Unemployment rate for White non-Hispanic residents 3.8% Males11.0% FemalesUnemployment by race in 2000
Unemployment rate for White non-Hispanic residents 5.4% Males2.2% Females
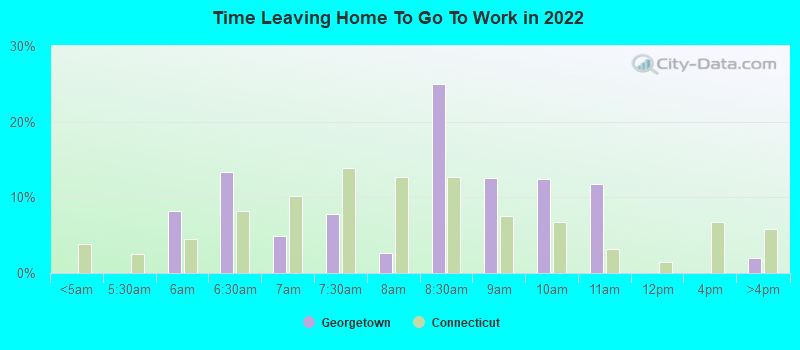
Time leaving home to go to work 5:30 a.m. to 5:59 a.m.: Georgetown:
8.3% (69)Connecticut:
4.4% (68,313)
6:00 a.m. to 6:29 a.m.: Georgetown:
13.4% (112)Connecticut:
8.2% (126,765)
6:30 a.m. to 6:59 a.m.: Georgetown:
4.9% (41)Connecticut:
10.2% (156,057)
7:00 a.m. to 7:29 a.m.: Georgetown:
7.8% (65)Connecticut:
13.9% (213,958)
7:30 a.m. to 7:59 a.m.: Georgetown:
2.6% (22)Connecticut:
12.7% (194,512)
8:00 a.m. to 8:29 a.m.: Georgetown:
25.0% (209)Connecticut:
12.7% (195,728)
8:30 a.m. to 8:59 a.m.: Georgetown:
12.6% (105)Connecticut:
7.5% (115,107)
9:00 a.m. to 9:59 a.m.: Georgetown:
12.4% (103)Connecticut:
6.7% (102,921)
10:00 a.m. to 10:59 a.m.: Georgetown:
11.8% (98)Connecticut:
3.2% (49,596)
4:00 p.m. to 11:59 p.m.: Georgetown:
2.0% (16)Connecticut:
5.8% (89,151)
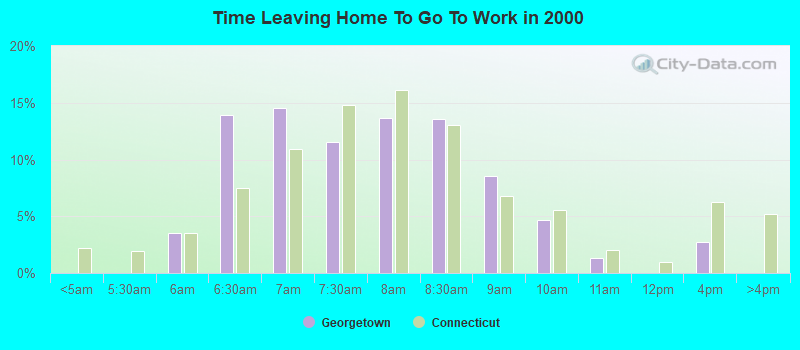
6am: Georgetown:
3.6% (30)Connecticut:
3.5% (57,499)
6:30am: Georgetown:
13.9% (117)Connecticut:
7.5% (123,062)
7am: Georgetown:
14.5% (122)Connecticut:
10.9% (179,325)
7:30am: Georgetown:
11.5% (97)Connecticut:
14.8% (242,766)
8am: Georgetown:
13.7% (115)Connecticut:
16.2% (265,137)
8:30am: Georgetown:
13.6% (114)Connecticut:
13.1% (214,263)
9am: Georgetown:
8.6% (72)Connecticut:
6.8% (110,992)
10am: Georgetown:
4.6% (39)Connecticut:
5.6% (91,313)
11am: Georgetown:
1.3% (11)Connecticut:
2.0% (33,574)
4pm: Georgetown:
2.7% (23)Connecticut:
6.3% (102,744)
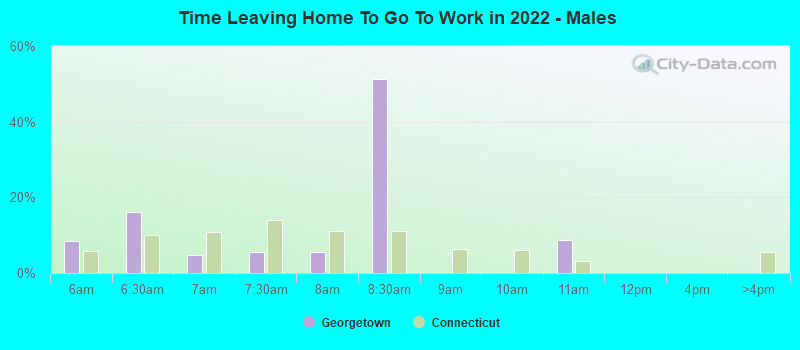
5:30 a.m. to 5:59 a.m. - Males: Georgetown:
8.5% (35)Connecticut:
5.9% (47,322)
6:00 a.m. to 6:29 a.m. - Males: Georgetown:
16.2% (66)Connecticut:
9.9% (80,180)
6:30 a.m. to 6:59 a.m. - Males: Georgetown:
4.8% (20)Connecticut:
10.8% (87,477)
7:00 a.m. to 7:29 a.m. - Males: Georgetown:
5.5% (22)Connecticut:
13.9% (112,702)
7:30 a.m. to 7:59 a.m. - Males: Georgetown:
5.5% (22)Connecticut:
11.2% (90,454)
8:00 a.m. to 8:29 a.m. - Males: Georgetown:
51.3% (209)Connecticut:
11.1% (89,543)
10:00 a.m. to 10:59 a.m. - Males: Georgetown:
8.7% (35)Connecticut:
3.1% (25,063)
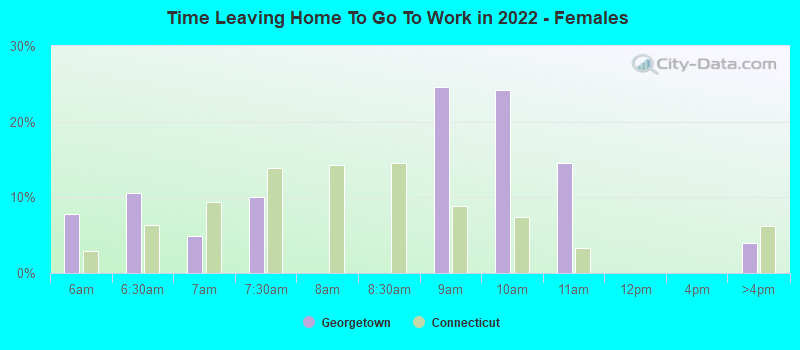
5:30 a.m. to 5:59 a.m. - Females: Georgetown:
7.7% (33)Connecticut:
2.9% (20,991)
6:00 a.m. to 6:29 a.m. - Females: Georgetown:
10.6% (45)Connecticut:
6.4% (46,585)
6:30 a.m. to 6:59 a.m. - Females: Georgetown:
4.9% (21)Connecticut:
9.4% (68,580)
7:00 a.m. to 7:29 a.m. - Females: Georgetown:
10.0% (43)Connecticut:
13.9% (101,256)
8:30 a.m. to 8:59 a.m. - Females: Georgetown:
24.6% (105)Connecticut:
8.8% (64,400)
9:00 a.m. to 9:59 a.m. - Females: Georgetown:
24.2% (103)Connecticut:
7.5% (54,370)
10:00 a.m. to 10:59 a.m. - Females: Georgetown:
14.5% (62)Connecticut:
3.4% (24,533)
4:00 p.m. to 11:59 p.m. - Females: Georgetown:
3.9% (17)Connecticut:
6.2% (45,279)
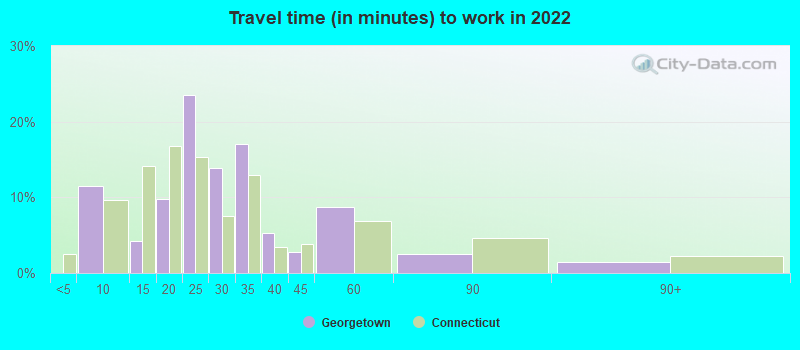
Travel time to work Percentage of workers working in this county: 70.6%Number of people working at home: 185 (17.6% of all workers )
5 to 9 minutes: Georgetown:
11.6% (88)Connecticut:
9.6% (142,067)
10 to 14 minutes: Georgetown:
4.3% (32)Connecticut:
14.1% (207,591)
15 to 19 minutes: Georgetown:
9.7% (74)Connecticut:
16.8% (247,587)
20 to 24 minutes: Georgetown:
23.6% (179)Connecticut:
15.3% (224,955)
25 to 29 minutes: Georgetown:
13.8% (105)Connecticut:
7.6% (111,679)
30 to 34 minutes: Georgetown:
17.1% (130)Connecticut:
13.0% (191,622)
35 to 39 minutes: Georgetown:
5.2% (40)Connecticut:
3.4% (49,861)
40 to 44 minutes: Georgetown:
2.8% (22)Connecticut:
3.9% (57,316)
45 to 59 minutes: Georgetown:
8.7% (66)Connecticut:
6.9% (102,115)
60 to 89 minutes: Georgetown:
2.5% (19)Connecticut:
4.6% (67,390)
90 or more minutes: Georgetown:
1.5% (11)Connecticut:
2.3% (33,578)
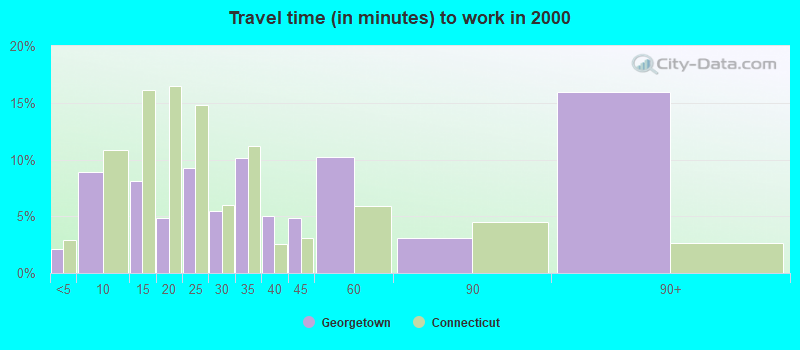
Less than 5 minutes: Georgetown:
2.1% (18)Connecticut:
2.9% (47,035)
5 to 9 minutes: Georgetown:
8.9% (75)Connecticut:
10.8% (177,296)
10 to 14 minutes: Georgetown:
8.1% (68)Connecticut:
16.1% (264,948)
15 to 19 minutes: Georgetown:
4.9% (41)Connecticut:
16.4% (269,915)
20 to 24 minutes: Georgetown:
9.3% (78)Connecticut:
14.8% (242,914)
25 to 29 minutes: Georgetown:
5.5% (46)Connecticut:
6.0% (98,144)
30 to 34 minutes: Georgetown:
10.1% (85)Connecticut:
11.2% (184,005)
35 to 39 minutes: Georgetown:
5.0% (42)Connecticut:
2.6% (41,860)
40 to 44 minutes: Georgetown:
4.9% (41)Connecticut:
3.1% (50,084)
45 to 59 minutes: Georgetown:
10.2% (86)Connecticut:
5.9% (96,492)
60 to 89 minutes: Georgetown:
3.1% (26)Connecticut:
4.5% (74,032)
90 or more minutes: Georgetown:
15.9% (134)Connecticut:
2.6% (42,680)
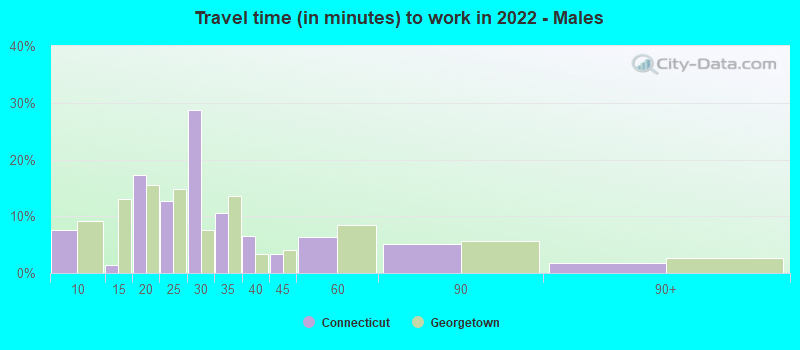
5 to 9 minutes - Males: Georgetown:
7.6% (27)Connecticut:
9.1% (70,667)
10 to 14 minutes - Males: Georgetown:
1.4% (5)Connecticut:
13.0% (101,072)
15 to 19 minutes - Males: Georgetown:
17.3% (61)Connecticut:
15.5% (120,344)
20 to 24 minutes - Males: Georgetown:
12.7% (45)Connecticut:
14.8% (114,908)
25 to 29 minutes - Males: Georgetown:
28.7% (101)Connecticut:
7.6% (58,765)
30 to 34 minutes - Males: Georgetown:
10.5% (37)Connecticut:
13.5% (104,684)
35 to 39 minutes - Males: Georgetown:
6.6% (23)Connecticut:
3.3% (25,589)
40 to 44 minutes - Males: Georgetown:
3.3% (12)Connecticut:
4.1% (31,958)
45 to 59 minutes - Males: Georgetown:
6.4% (23)Connecticut:
8.4% (65,295)
60 to 89 minutes - Males: Georgetown:
5.0% (18)Connecticut:
5.6% (43,405)
90 or more minutes - Males: Georgetown:
1.7% (6)Connecticut:
2.7% (21,092)
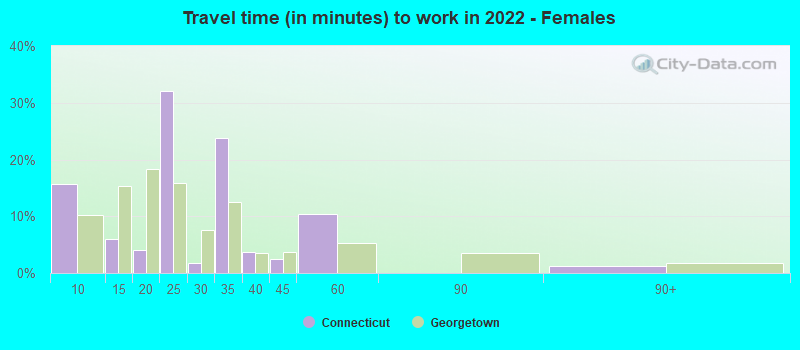
5 to 9 minutes - Females: Georgetown:
15.7% (64)Connecticut:
10.2% (71,400)
10 to 14 minutes - Females: Georgetown:
6.0% (24)Connecticut:
15.3% (106,519)
15 to 19 minutes - Females: Georgetown:
4.0% (16)Connecticut:
18.3% (127,243)
20 to 24 minutes - Females: Georgetown:
32.1% (130)Connecticut:
15.8% (110,047)
25 to 29 minutes - Females: Georgetown:
1.9% (8)Connecticut:
7.6% (52,914)
30 to 34 minutes - Females: Georgetown:
23.9% (97)Connecticut:
12.5% (86,938)
35 to 39 minutes - Females: Georgetown:
3.8% (15)Connecticut:
3.5% (24,272)
40 to 44 minutes - Females: Georgetown:
2.5% (10)Connecticut:
3.6% (25,358)
45 to 59 minutes - Females: Georgetown:
10.4% (42)Connecticut:
5.3% (36,820)
90 or more minutes - Females: Georgetown:
1.3% (5)Connecticut:
1.8% (12,486)
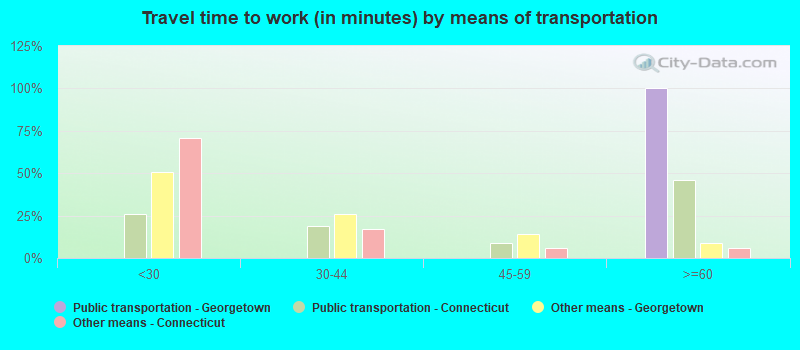
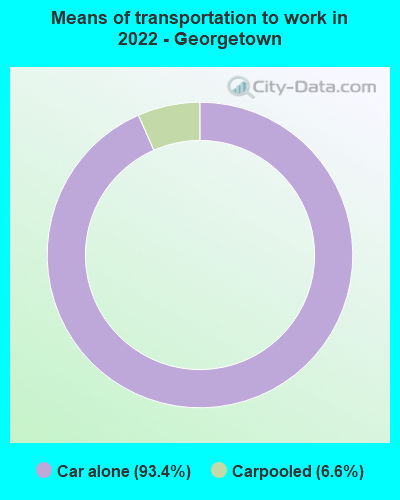
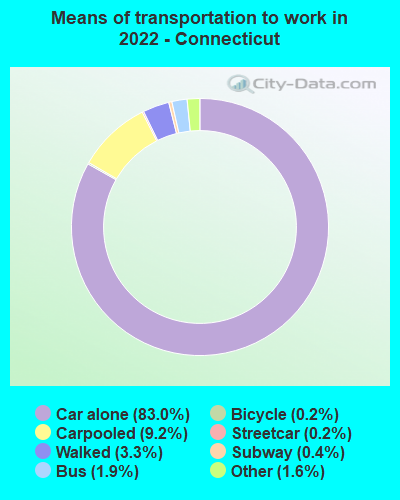
Means of transportation to work Drove car alone: Georgetown:
93.4% (777)Connecticut:
83.0% (571,430)
Carpooled: Georgetown:
6.6% (55)Connecticut:
9.2% (66,348)
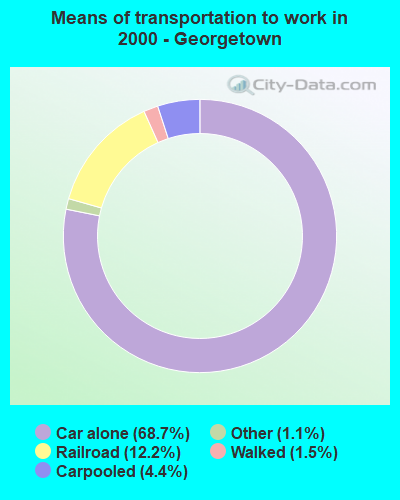
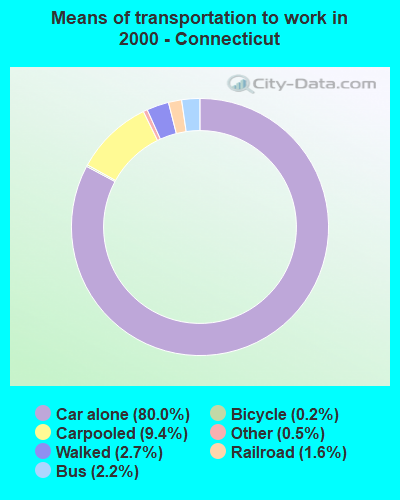
Drove car alone: Georgetown:
68.7% (578)Connecticut:
80.0% (1,312,700)
Carpooled: Georgetown:
4.4% (37)Connecticut:
9.4% (154,400)
Railroad: Georgetown:
12.2% (103)Connecticut:
1.6% (26,659)
Walked: Georgetown:
1.5% (13)Connecticut:
2.7% (44,348)
Other means: Georgetown:
1.1% (9)Connecticut:
0.5% (8,479)
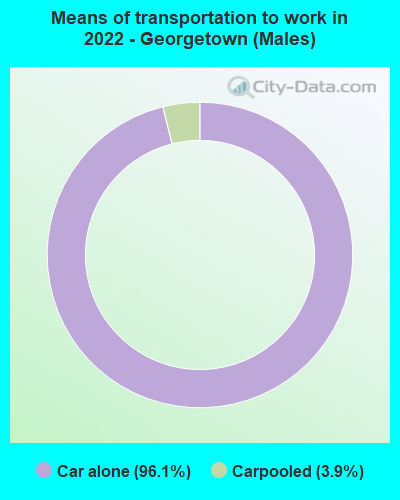
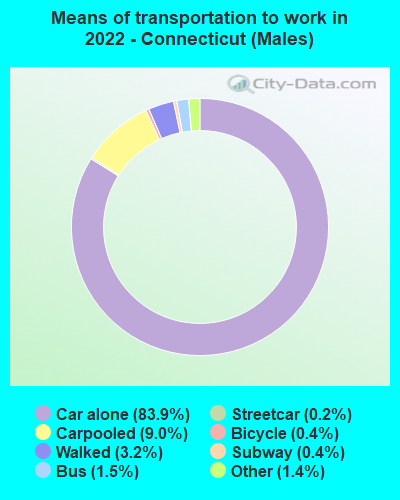
Drove car alone - Males: Georgetown:
96.1% (370)Connecticut:
83.9% (571,430)
Carpooled - Males: Georgetown:
3.9% (15)Connecticut:
9.0% (66,348)
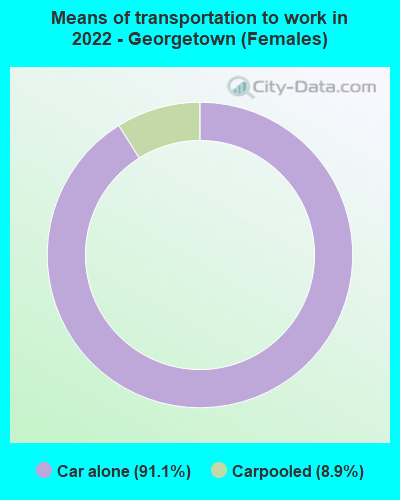
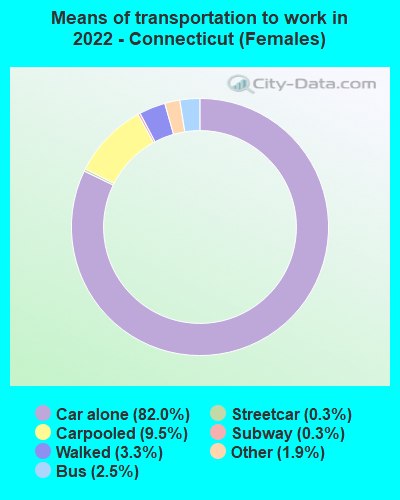
Drove car alone - Females: Georgetown:
91.1% (407)Connecticut:
82.0% (571,430)
Carpooled - Females: Georgetown:
8.9% (40)Connecticut:
9.5% (66,348)
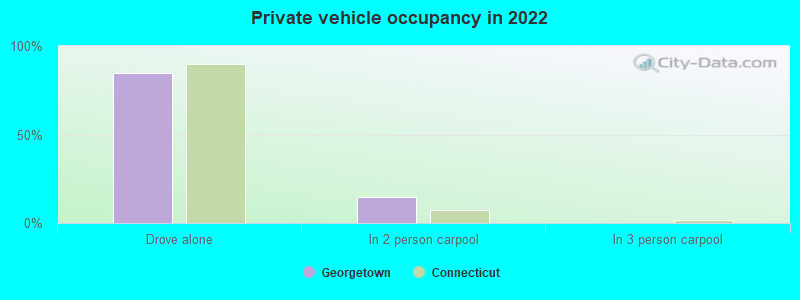
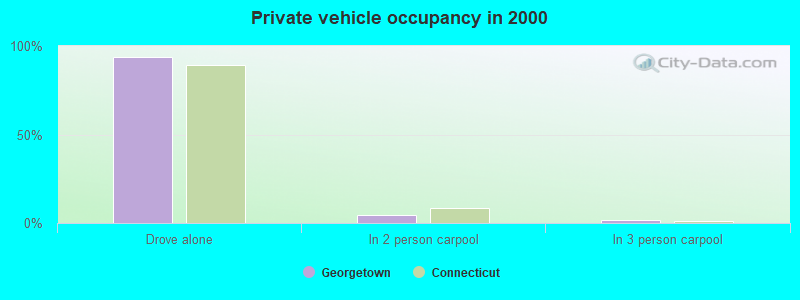
Private vehicle occupancy Drove alone: Georgetown:
84.5% (642)Connecticut:
90.0% (1,260,309)
In 2 person carpool: Georgetown:
14.9% (113)Connecticut:
7.4% (103,259)
Drove alone: Georgetown:
94.0% (578)Connecticut:
89.5% (1,312,700)
In 2 person carpool: Georgetown:
4.6% (28)Connecticut:
8.5% (124,051)
In 3 person carpool: Georgetown:
1.5% (9)Connecticut:
1.2% (17,722)
Class of workers
Employee of private company: Georgetown:
78.8% (830)Connecticut:
65.9% (1,226,268)
Self-employed in own incorporated business: Georgetown:
4.2% (45)Connecticut:
3.9% (73,132)
Private not-for-profit wage and salary workers: Georgetown:
1.8% (19)Connecticut:
11.4% (212,916)
Local government workers: Georgetown:
2.6% (27)Connecticut:
7.3% (135,635)
State government workers: Georgetown:
1.0% (10)Connecticut:
3.9% (73,243)
Federal government workers: Georgetown:
1.7% (18)Connecticut:
1.5% (28,602)
Self-employed workers in own not incorporated business: Georgetown:
9.8% (104)Connecticut:
5.9% (109,627)
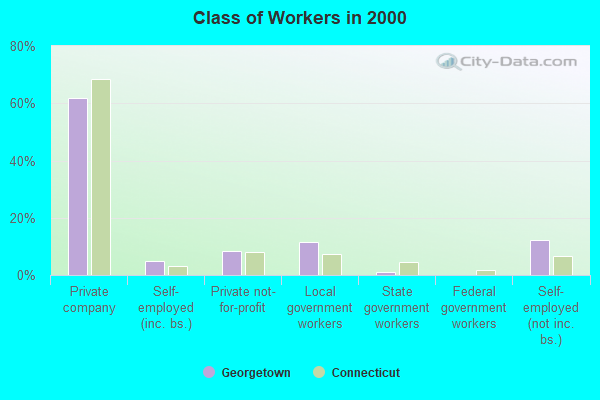
Employee of private company: Georgetown:
61.8% (530)Connecticut:
68.6% (1,141,965)
Self-employed in own incorporated business: Georgetown:
4.8% (41)Connecticut:
3.3% (54,345)
Private not-for-profit wage and salary workers: Georgetown:
8.5% (73)Connecticut:
8.1% (134,058)
Local government workers: Georgetown:
11.7% (100)Connecticut:
7.3% (121,409)
State government workers: Georgetown:
0.9% (8)Connecticut:
4.4% (73,377)
Self-employed workers in own not incorporated business: Georgetown:
12.4% (106)Connecticut:
6.5% (108,945)
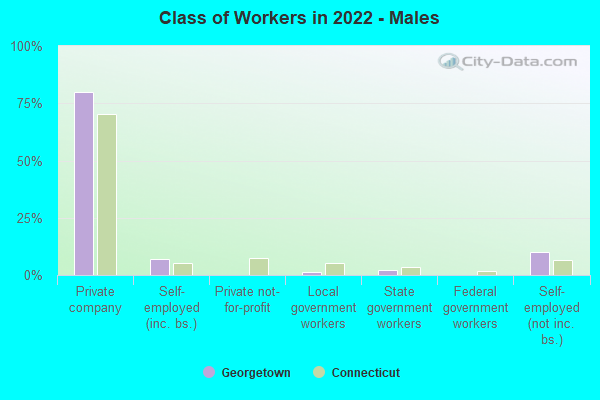
Employee of private company - Males: Georgetown:
79.9% (396)Connecticut:
70.3% (676,274)
Self-employed in own incorporated business - Males: Georgetown:
7.0% (35)Connecticut:
5.5% (52,445)
Local government workers - Males: Georgetown:
1.2% (6)Connecticut:
5.0% (48,435)
State government workers - Males: Georgetown:
2.0% (10)Connecticut:
3.5% (33,921)
Self-employed workers in own not incorporated business - Males: Georgetown:
9.8% (49)Connecticut:
6.5% (62,582)
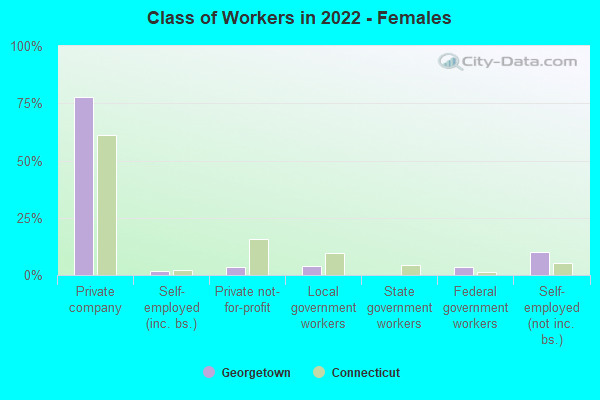
Employee of private company - Females: Georgetown:
77.8% (434)Connecticut:
61.2% (549,994)
Self-employed in own incorporated business - Females: Georgetown:
1.8% (10)Connecticut:
2.3% (20,687)
Private not-for-profit wage and salary workers - Females: Georgetown:
3.5% (19)Connecticut:
15.6% (140,684)
Local government workers - Females: Georgetown:
3.8% (21)Connecticut:
9.7% (87,200)
Federal government workers - Females: Georgetown:
3.3% (18)Connecticut:
1.4% (12,844)
Self-employed workers in own not incorporated business - Females: Georgetown:
9.8% (55)Connecticut:
5.2% (47,045)