Work and Jobs in Golconda, Nevada (NV) Detailed Stats
Occupations, Industries, Unemployment, Workers, Commute
Settings
X

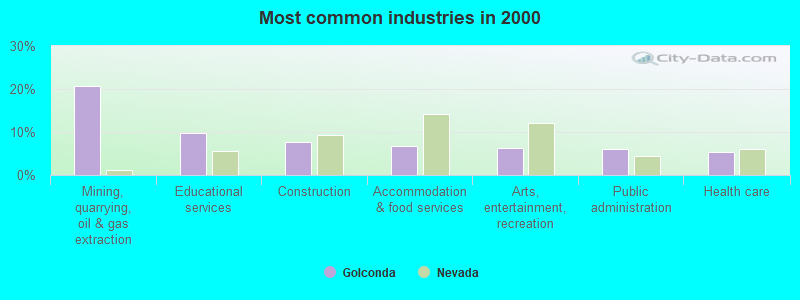
The most common industries in Golconda are: Mining, quarrying, oil & gas extraction (20.7% of civilian employees), Educational services (9.8% of civilian employees), Construction (7.7% of civilian employees). 69.3% of workers are employees of private companies, which is 10.8% less than the rate of 76.8% across the entire state of Nevada.
Most common industries
Most common industries | |||
|---|---|---|---|
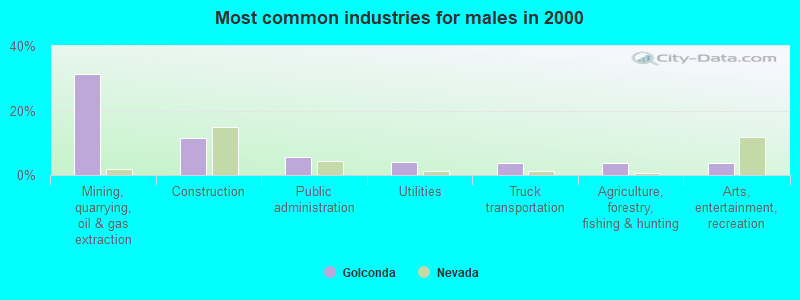
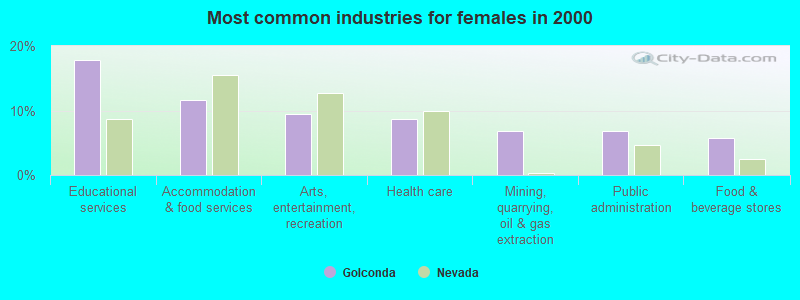
Industry | All | Males | Females |
| Mining, quarrying, and oil and gas extraction | 20.7% (896) | 31.3% (769) | 6.8% (127) |
| Educational services | 9.8% (426) | 3.7% (92) | 17.8% (334) |
| Construction | 7.7% (332) | 11.5% (283) | 2.6% (49) |
| Accommodation and food services | 6.8% (296) | 3.2% (78) | 11.6% (218) |
| Arts, entertainment, and recreation | 6.2% (269) | 3.8% (93) | 9.4% (176) |
| Public administration | 6.1% (263) | 5.5% (136) | 6.8% (127) |
| Health care | 5.4% (233) | 2.8% (70) | 8.7% (163) |
| Food and beverage stores | 3.8% (166) | 2.4% (58) | 5.8% (108) |
| Agriculture, forestry, fishing and hunting | 2.6% (111) | 3.8% (93) | 1.0% (18) |
| Administrative and support and waste management services | 2.5% (109) | 3.0% (74) | 1.9% (35) |
| Utilities | 2.5% (107) | 4.0% (98) | 0.5% (9) |
| Truck transportation | 2.3% (101) | 3.8% (94) | 0.4% (7) |
| Motor vehicle and parts dealers | 2.1% (89) | 2.1% (51) | 2.0% (38) |
| Furniture and home furnishings, and household appliance stores | 1.6% (71) | 1.3% (31) | 2.1% (40) |
| Repair and maintenance | 1.6% (71) | 2.2% (54) | 0.9% (17) |
| Department and other general merchandise stores | 1.5% (64) | 0.8% (19) | 2.4% (45) |
| Personal and laundry services | 1.5% (64) | 1.3% (31) | 1.8% (33) |
| Finance and insurance | 1.3% (58) | 0.7% (17) | 2.2% (41) |
| Food | 1.2% (53) | 1.8% (45) | 0.4% (8) |
| Professional, scientific, and technical services | 1.0% (43) | 0.7% (16) | 1.4% (27) |
| Publishing, and motion picture and sound recording industries | 1.0% (42) | 0.3% (7) | 1.9% (35) |
| Social assistance | 0.9% (41) | 0.0% (0) | 2.2% (41) |
| Plastics and rubber products | 0.9% (40) | 1.6% (40) | 0.0% (0) |
| Gasoline stations | 0.9% (39) | 0.3% (8) | 1.7% (31) |
| Used merchandise, gift, novelty, and souvenir, and other miscellaneous stores | 0.8% (35) | 0.4% (9) | 1.4% (26) |
| Chemicals | 0.7% (29) | 1.2% (29) | 0.0% (0) |
| Radio, TV, and computer stores | 0.6% (27) | 0.4% (10) | 0.9% (17) |
| Building material and garden equipment and supplies dealers | 0.6% (25) | 0.7% (18) | 0.4% (7) |
| Petroleum and petroleum products merchant wholesalers | 0.4% (18) | 0.5% (13) | 0.3% (5) |
| Broadcasting and telecommunications | 0.4% (16) | 0.3% (8) | 0.4% (8) |
| Rail transportation | 0.3% (15) | 0.6% (15) | 0.0% (0) |
| Transportation equipment | 0.3% (14) | 0.6% (14) | 0.0% (0) |
| Private households | 0.3% (12) | 0.0% (0) | 0.6% (12) |
| Jewelry, luggage, and leather goods stores | 0.3% (11) | 0.0% (0) | 0.6% (11) |
| Machinery | 0.3% (11) | 0.2% (6) | 0.3% (5) |
| Miscellaneous nondurable goods merchant wholesalers | 0.2% (10) | 0.4% (10) | 0.0% (0) |
| Metals and minerals, except petroleum, merchant wholesalers | 0.2% (10) | 0.4% (10) | 0.0% (0) |
| Religious, grantmaking, civic, professional, and similar organizations | 0.2% (10) | 0.0% (0) | 0.5% (10) |
| Miscellaneous manufacturing | 0.2% (9) | 0.0% (0) | 0.5% (9) |
| Metal and metal products | 0.2% (9) | 0.4% (9) | 0.0% (0) |
| Drugs, sundries, and chemical and allied products merchant wholesalers | 0.2% (8) | 0.0% (0) | 0.4% (8) |
| Electronic shopping and mail-order houses | 0.2% (8) | 0.0% (0) | 0.4% (8) |
| U. S. Postal service | 0.2% (8) | 0.0% (0) | 0.4% (8) |
| Groceries and related products merchant wholesalers | 0.2% (8) | 0.3% (8) | 0.0% (0) |
| Professional and commercial equipment and supplies merchant wholesalers | 0.2% (8) | 0.0% (0) | 0.4% (8) |
| Computer and electronic products | 0.2% (7) | 0.3% (7) | 0.0% (0) |
| Pharmacies and drug stores | 0.2% (7) | 0.0% (0) | 0.4% (7) |
| Vending machine operators | 0.2% (7) | 0.3% (7) | 0.0% (0) |
| Other transportation, and support activities, and couriers | 0.2% (7) | 0.3% (7) | 0.0% (0) |
| Nonmetallic mineral products | 0.1% (6) | 0.2% (6) | 0.0% (0) |
| Warehousing and storage | 0.1% (6) | 0.2% (6) | 0.0% (0) |
| Other direct selling establishments | 0.1% (5) | 0.2% (5) | 0.0% (0) |
| Machinery, equipment, and supplies merchant wholesalers | 0.1% (5) | 0.2% (5) | 0.0% (0) |
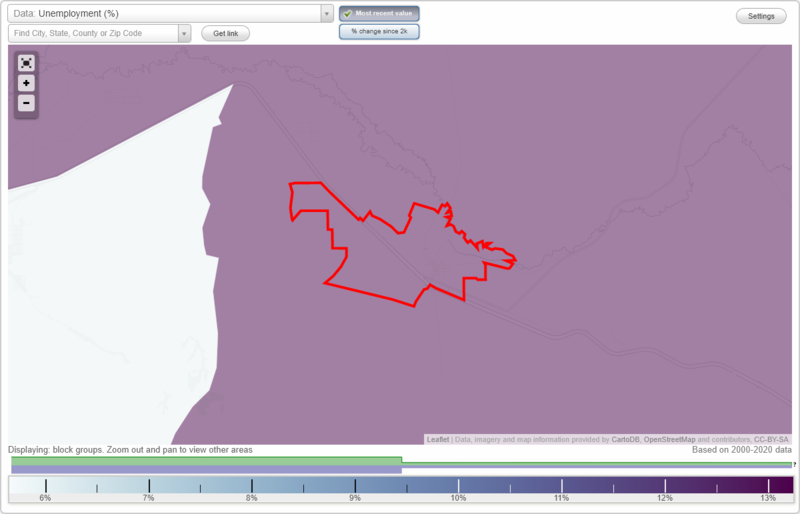
Unemployment in Golconda
- Unemployment by race in 2000
- Unemployment rate for White non-Hispanic residents
- 6.9%Males
- 8.2%Females
- Unemployment rate for Black residents
- 40.0%Males
- 50.0%Females
- Unemployment rate for American Indian and Alaska Native residents
- 12.0%Males
- Unemployment rate for other race residents
- 10.1%Females
- Unemployment rate for two or more race residents
- 15.5%Males
- Unemployment rate for Hispanic or Latino residents
- 9.3%Males
- 9.0%Females
Time leaving home to go to work
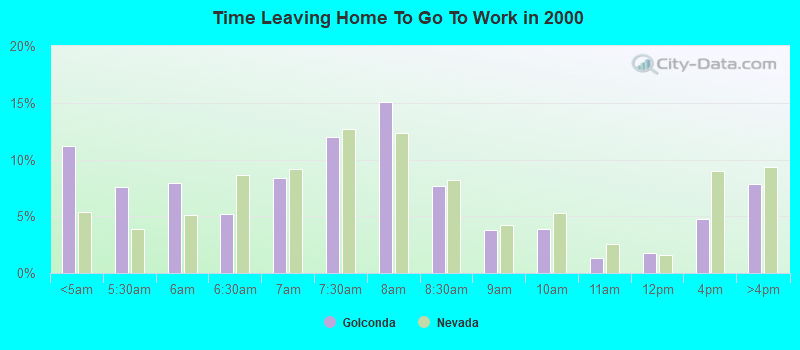
<5am:
| Golconda: | 11.2% (485) |
| Nevada: | 5.4% (49,950) |
5:30am:
| Golconda: | 7.6% (327) |
| Nevada: | 3.9% (35,924) |
6am:
| Golconda: | 7.9% (343) |
| Nevada: | 5.1% (47,324) |
6:30am:
| Golconda: | 5.2% (226) |
| Nevada: | 8.6% (79,614) |
7am:
| Golconda: | 8.4% (362) |
| Nevada: | 9.1% (84,251) |
7:30am:
| Golconda: | 12.0% (518) |
| Nevada: | 12.7% (117,088) |
8am:
| Golconda: | 15.0% (649) |
| Nevada: | 12.3% (113,773) |
8:30am:
| Golconda: | 7.6% (330) |
| Nevada: | 8.2% (75,666) |
9am:
| Golconda: | 3.8% (162) |
| Nevada: | 4.2% (38,916) |
10am:
| Golconda: | 3.9% (167) |
| Nevada: | 5.3% (48,591) |
11am:
| Golconda: | 1.3% (56) |
| Nevada: | 2.6% (23,932) |
12pm:
| Golconda: | 1.7% (75) |
| Nevada: | 1.6% (14,997) |
4pm:
| Golconda: | 4.8% (207) |
| Nevada: | 9.0% (83,088) |
>4pm:
| Golconda: | 7.8% (339) |
| Nevada: | 9.3% (86,164) |
Travel time to work
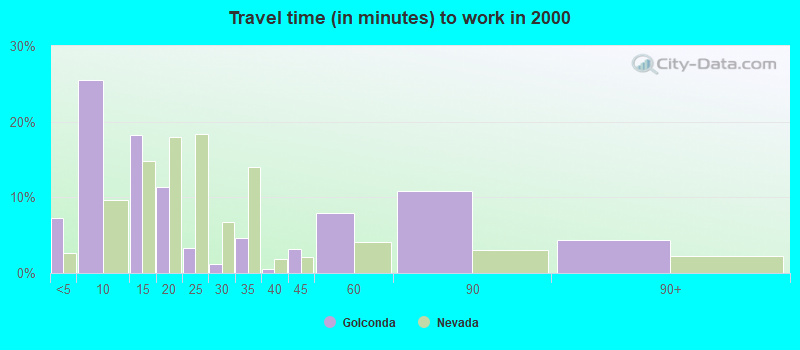
Less than 5 minutes:
| Golconda: | 7.3% (316) |
| Nevada: | 2.7% (24,637) |
5 to 9 minutes:
| Golconda: | 25.4% (1,099) |
| Nevada: | 9.6% (88,626) |
10 to 14 minutes:
| Golconda: | 18.2% (788) |
| Nevada: | 14.9% (137,121) |
15 to 19 minutes:
| Golconda: | 11.3% (489) |
| Nevada: | 17.9% (165,652) |
20 to 24 minutes:
| Golconda: | 3.4% (145) |
| Nevada: | 18.3% (169,033) |
25 to 29 minutes:
| Golconda: | 1.2% (52) |
| Nevada: | 6.7% (62,292) |
30 to 34 minutes:
| Golconda: | 4.6% (200) |
| Nevada: | 14.0% (129,026) |
35 to 39 minutes:
| Golconda: | 0.5% (22) |
| Nevada: | 1.8% (17,061) |
40 to 44 minutes:
| Golconda: | 3.2% (138) |
| Nevada: | 2.1% (19,732) |
45 to 59 minutes:
| Golconda: | 7.9% (342) |
| Nevada: | 4.0% (37,254) |
60 to 89 minutes:
| Golconda: | 10.9% (469) |
| Nevada: | 3.1% (28,357) |
90 or more minutes:
| Golconda: | 4.3% (186) |
| Nevada: | 2.2% (20,487) |
Means of transportation to work
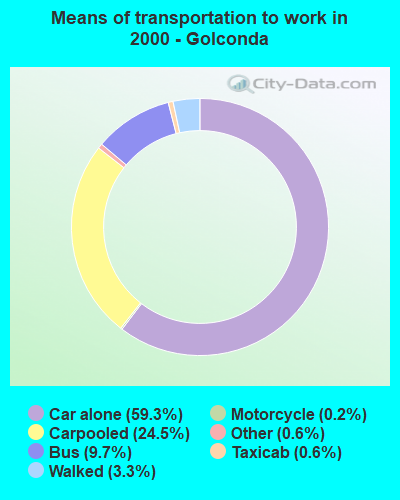
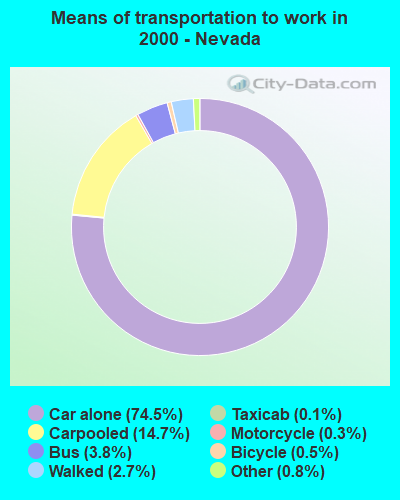
Drove car alone:
| Golconda: | 59.3% (2,561) |
| Nevada: | 74.5% (687,368) |
Carpooled:
| Golconda: | 24.5% (1,058) |
| Nevada: | 14.7% (135,874) |
Bus or trolley bus:
| Golconda: | 9.7% (420) |
| Nevada: | 3.8% (35,031) |
Taxicab:
| Golconda: | 0.6% (28) |
| Nevada: | 0.1% (957) |
Motorcycle:
| Golconda: | 0.2% (10) |
| Nevada: | 0.3% (2,693) |
Walked:
| Golconda: | 3.3% (142) |
| Nevada: | 2.7% (24,875) |
Other means:
| Golconda: | 0.6% (27) |
| Nevada: | 0.8% (7,477) |
Private vehicle occupancy
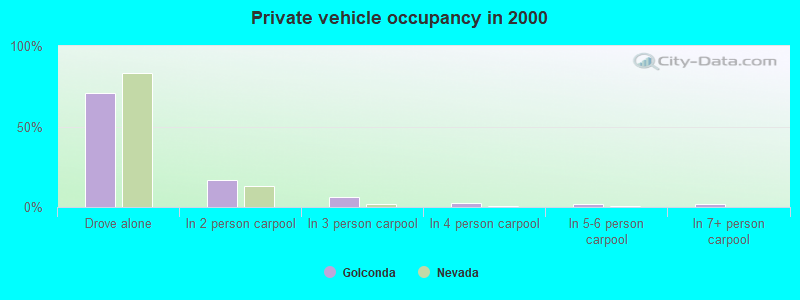
Drove alone:
| Golconda: | 70.8% (2,561) |
| Nevada: | 83.5% (687,368) |
In 2 person carpool:
| Golconda: | 17.0% (616) |
| Nevada: | 13.1% (108,073) |
In 3 person carpool:
| Golconda: | 6.2% (226) |
| Nevada: | 2.1% (17,292) |
In 4 person carpool:
| Golconda: | 2.2% (79) |
| Nevada: | 0.8% (6,404) |
In 5-6 person carpool:
| Golconda: | 2.0% (73) |
| Nevada: | 0.3% (2,878) |
In 7+ person carpool:
| Golconda: | 1.8% (64) |
| Nevada: | 0.1% (1,227) |
Class of workers
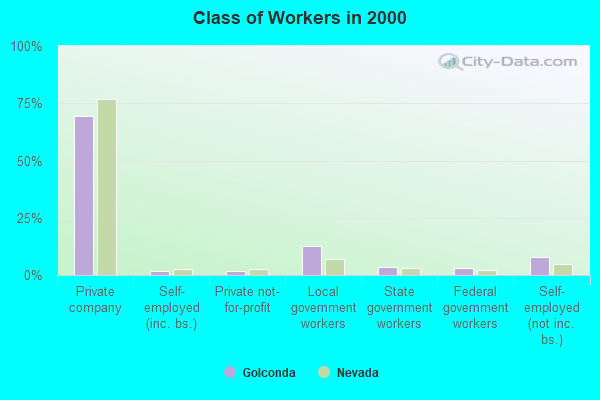
Employee of private company:
| Golconda: | 69.3% (3,005) |
| Nevada: | 76.8% (716,774) |
Self-employed in own incorporated business:
| Golconda: | 1.5% (67) |
| Nevada: | 2.8% (26,180) |
Private not-for-profit wage and salary workers:
| Golconda: | 1.8% (76) |
| Nevada: | 2.8% (26,101) |
Local government workers:
| Golconda: | 12.6% (548) |
| Nevada: | 7.0% (65,211) |
State government workers:
| Golconda: | 3.7% (159) |
| Nevada: | 3.2% (30,014) |
Federal government workers:
| Golconda: | 3.0% (129) |
| Nevada: | 2.3% (21,071) |
Self-employed workers in own not incorporated business:
| Golconda: | 7.7% (332) |
| Nevada: | 4.9% (45,578) |
Unpaid family workers:
| Golconda: | 0.4% (19) |
| Nevada: | 0.3% (2,351) |
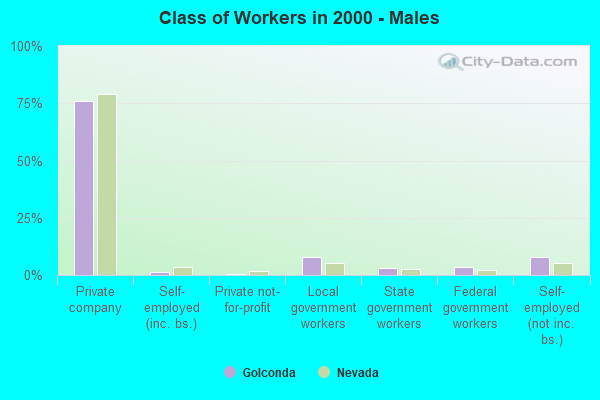
Employee of private company - Males:
| Golconda: | 76.1% (1,871) |
| Nevada: | 79.0% (405,296) |
Self-employed in own incorporated business - Males:
| Golconda: | 1.3% (33) |
| Nevada: | 3.6% (18,490) |
Private not-for-profit wage and salary workers - Males:
| Golconda: | 0.2% (6) |
| Nevada: | 1.8% (9,380) |
Local government workers - Males:
| Golconda: | 7.8% (193) |
| Nevada: | 5.3% (27,032) |
State government workers - Males:
| Golconda: | 3.0% (73) |
| Nevada: | 2.6% (13,333) |
Federal government workers - Males:
| Golconda: | 3.5% (86) |
| Nevada: | 2.4% (12,139) |
Self-employed workers in own not incorporated business - Males:
| Golconda: | 7.7% (190) |
| Nevada: | 5.2% (26,559) |
Unpaid family workers - Males:
| Golconda: | 0.3% (7) |
| Nevada: | 0.2% (997) |
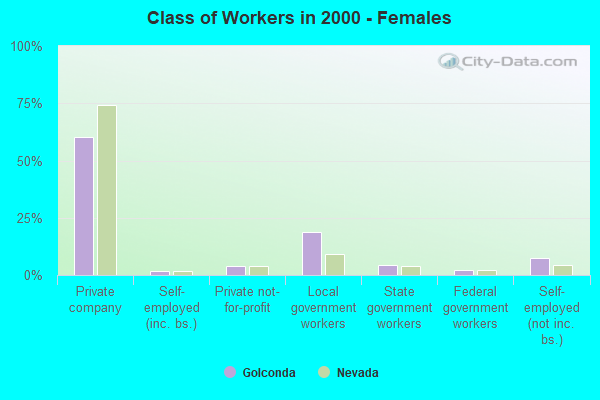
Employee of private company - Females:
| Golconda: | 60.4% (1,134) |
| Nevada: | 74.2% (311,478) |
Self-employed in own incorporated business - Females:
| Golconda: | 1.8% (34) |
| Nevada: | 1.8% (7,690) |
Private not-for-profit wage and salary workers - Females:
| Golconda: | 3.7% (70) |
| Nevada: | 4.0% (16,721) |
Local government workers - Females:
| Golconda: | 18.9% (355) |
| Nevada: | 9.1% (38,179) |
State government workers - Females:
| Golconda: | 4.6% (86) |
| Nevada: | 4.0% (16,681) |
Federal government workers - Females:
| Golconda: | 2.3% (43) |
| Nevada: | 2.1% (8,932) |
Self-employed workers in own not incorporated business - Females:
| Golconda: | 7.6% (142) |
| Nevada: | 4.5% (19,019) |
Unpaid family workers - Females:
| Golconda: | 0.6% (12) |
| Nevada: | 0.3% (1,354) |