Work and Jobs in Gold Bar, Washington (WA) Detailed Stats
Occupations, Industries, Unemployment, Workers, Commute
Settings
X


Recent posts about work in Gold Bar, Washington on our local forum with over 2,400,000 registered users:
 | Tell me about Gold Bar area....is it flood prone? (14 replies) |
| Seattle is boring, and I'm a transplant - Don't move here (83 replies) |
| Visiting Seattle, is a day trip to Vancouver doable? (61 replies) |
| North Bend or Monroe (19 replies) |
| AZ to Seattle - Cost of Living (ignoring housing) (74 replies) |
| hoping of moving from Boston area with family (61 replies) |
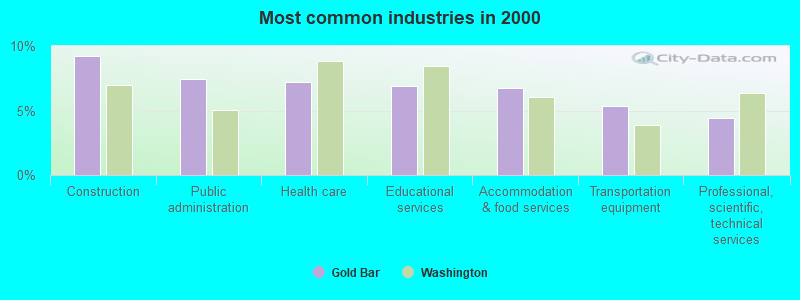
The most common industries in Gold Bar are: Construction (9.2% of civilian employees), Public administration (7.5% of civilian employees), Health care (7.2% of civilian employees). 80.3% of workers work in Snohomish County and 11.9% of all workers work at home. 74.7% of workers are employees of private companies, which is 11.6% greater than the rate of 66.0% across the entire state of Washington.
Whole page based on the data from 2000 / 2022 when the population of Gold Bar, Washington was 2,014 / 2,371
Whole page based on the data from 2000 / 2022 when the population of Gold Bar, Washington was 2,014 / 2,371
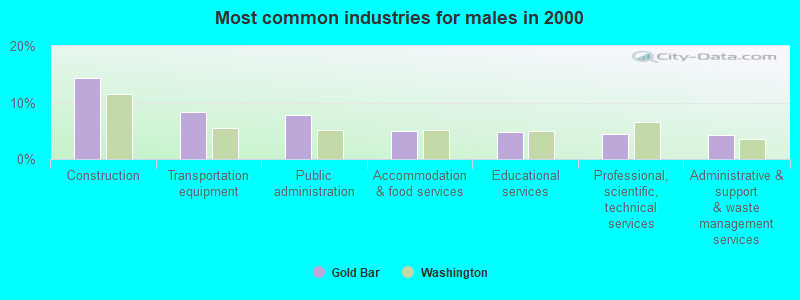
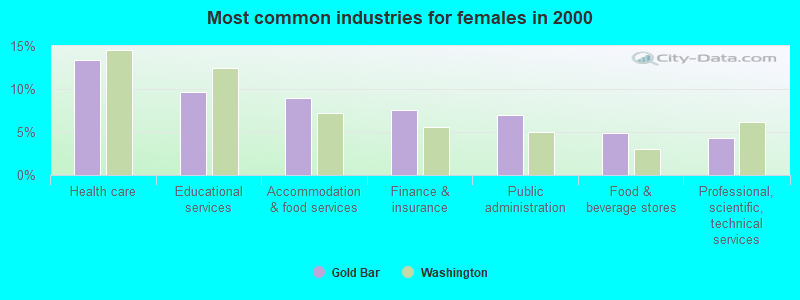
Most common industries
Most common industries | |||
|---|---|---|---|
Industry | All | Males | Females |
| Construction | 9.2% (88) | 14.3% (77) | 2.7% (11) |
| Public administration | 7.5% (71) | 7.8% (42) | 7.0% (29) |
| Health care | 7.2% (69) | 2.6% (14) | 13.3% (55) |
| Educational services | 6.9% (66) | 4.8% (26) | 9.7% (40) |
| Accommodation and food services | 6.7% (64) | 5.0% (27) | 9.0% (37) |
| Transportation equipment | 5.4% (51) | 8.3% (45) | 1.5% (6) |
| Professional, scientific, and technical services | 4.4% (42) | 4.4% (24) | 4.4% (18) |
| Administrative and support and waste management services | 4.3% (41) | 4.3% (23) | 4.4% (18) |
| Finance and insurance | 4.0% (38) | 1.3% (7) | 7.5% (31) |
| Miscellaneous manufacturing | 2.9% (28) | 3.1% (17) | 2.7% (11) |
| Food and beverage stores | 2.6% (25) | 0.9% (5) | 4.8% (20) |
| Department and other general merchandise stores | 2.2% (21) | 0.7% (4) | 4.1% (17) |
| Real estate and rental and leasing | 2.1% (20) | 2.4% (13) | 1.7% (7) |
| Furniture and related product manufacturing | 2.1% (20) | 3.0% (16) | 1.0% (4) |
| Truck transportation | 1.9% (18) | 3.0% (16) | 0.5% (2) |
| Metal and metal products | 1.9% (18) | 3.3% (18) | 0.0% (0) |
| Computer and electronic products | 1.8% (17) | 1.3% (7) | 2.4% (10) |
| Food | 1.7% (16) | 1.5% (8) | 1.9% (8) |
| Repair and maintenance | 1.7% (16) | 3.0% (16) | 0.0% (0) |
| Social assistance | 1.5% (14) | 0.0% (0) | 3.4% (14) |
| Broadcasting and telecommunications | 1.4% (13) | 1.7% (9) | 1.0% (4) |
| Arts, entertainment, and recreation | 1.4% (13) | 1.9% (10) | 0.7% (3) |
| Machinery | 1.0% (10) | 1.9% (10) | 0.0% (0) |
| Building material and garden equipment and supplies dealers | 0.9% (9) | 1.1% (6) | 0.7% (3) |
| Private households | 0.8% (8) | 0.0% (0) | 1.9% (8) |
| Other direct selling establishments | 0.8% (8) | 1.3% (7) | 0.2% (1) |
| Wood products | 0.8% (8) | 1.5% (8) | 0.0% (0) |
| Nonmetallic mineral products | 0.8% (8) | 0.4% (2) | 1.5% (6) |
| Air transportation | 0.8% (8) | 1.5% (8) | 0.0% (0) |
| Agriculture, forestry, fishing and hunting | 0.7% (7) | 0.9% (5) | 0.5% (2) |
| Personal and laundry services | 0.7% (7) | 0.4% (2) | 1.2% (5) |
| Utilities | 0.7% (7) | 0.9% (5) | 0.5% (2) |
| Professional and commercial equipment and supplies merchant wholesalers | 0.7% (7) | 0.4% (2) | 1.2% (5) |
| Radio, TV, and computer stores | 0.7% (7) | 1.3% (7) | 0.0% (0) |
| Textile mills and textile products | 0.6% (6) | 0.4% (2) | 1.0% (4) |
| Motor vehicle and parts dealers | 0.6% (6) | 1.1% (6) | 0.0% (0) |
| Other transportation, and support activities, and couriers | 0.6% (6) | 0.7% (4) | 0.5% (2) |
| U. S. Postal service | 0.6% (6) | 0.4% (2) | 1.0% (4) |
| Clothing and accessories, including shoe, stores | 0.5% (5) | 0.0% (0) | 1.2% (5) |
| Groceries and related products merchant wholesalers | 0.5% (5) | 0.4% (2) | 0.7% (3) |
| Plastics and rubber products | 0.5% (5) | 0.9% (5) | 0.0% (0) |
| Pharmacies and drug stores | 0.5% (5) | 0.0% (0) | 1.2% (5) |
| Chemicals | 0.4% (4) | 0.4% (2) | 0.5% (2) |
| Hardware, plumbing and heating equipment, and supplies merchant wholesalers | 0.4% (4) | 0.7% (4) | 0.0% (0) |
| Lumber and other construction materials merchant wholesalers | 0.4% (4) | 0.7% (4) | 0.0% (0) |
| Furniture and home furnishings, and household appliance stores | 0.4% (4) | 0.7% (4) | 0.0% (0) |
| Gasoline stations | 0.4% (4) | 0.0% (0) | 1.0% (4) |
| Sporting goods, camera, and hobby and toy stores | 0.3% (3) | 0.0% (0) | 0.7% (3) |
| Publishing, and motion picture and sound recording industries | 0.3% (3) | 0.6% (3) | 0.0% (0) |
| Printing and related support activities | 0.2% (2) | 0.4% (2) | 0.0% (0) |
| Mining, quarrying, and oil and gas extraction | 0.2% (2) | 0.4% (2) | 0.0% (0) |
| Electrical equipment, appliances, and components | 0.2% (2) | 0.4% (2) | 0.0% (0) |
| Office supplies and stationery stores | 0.2% (2) | 0.4% (2) | 0.0% (0) |
| Data processing, libraries, and other information services | 0.2% (2) | 0.4% (2) | 0.0% (0) |
| Miscellaneous nondurable goods merchant wholesalers | 0.2% (2) | 0.4% (2) | 0.0% (0) |
| Petroleum and petroleum products merchant wholesalers | 0.2% (2) | 0.4% (2) | 0.0% (0) |
| Retail florists | 0.2% (2) | 0.0% (0) | 0.5% (2) |
| Religious, grantmaking, civic, professional, and similar organizations | 0.2% (2) | 0.0% (0) | 0.5% (2) |
| Metals and minerals, except petroleum, merchant wholesalers | 0.1% (1) | 0.2% (1) | 0.0% (0) |
| Machinery, equipment, and supplies merchant wholesalers | 0.1% (1) | 0.2% (1) | 0.0% (0) |
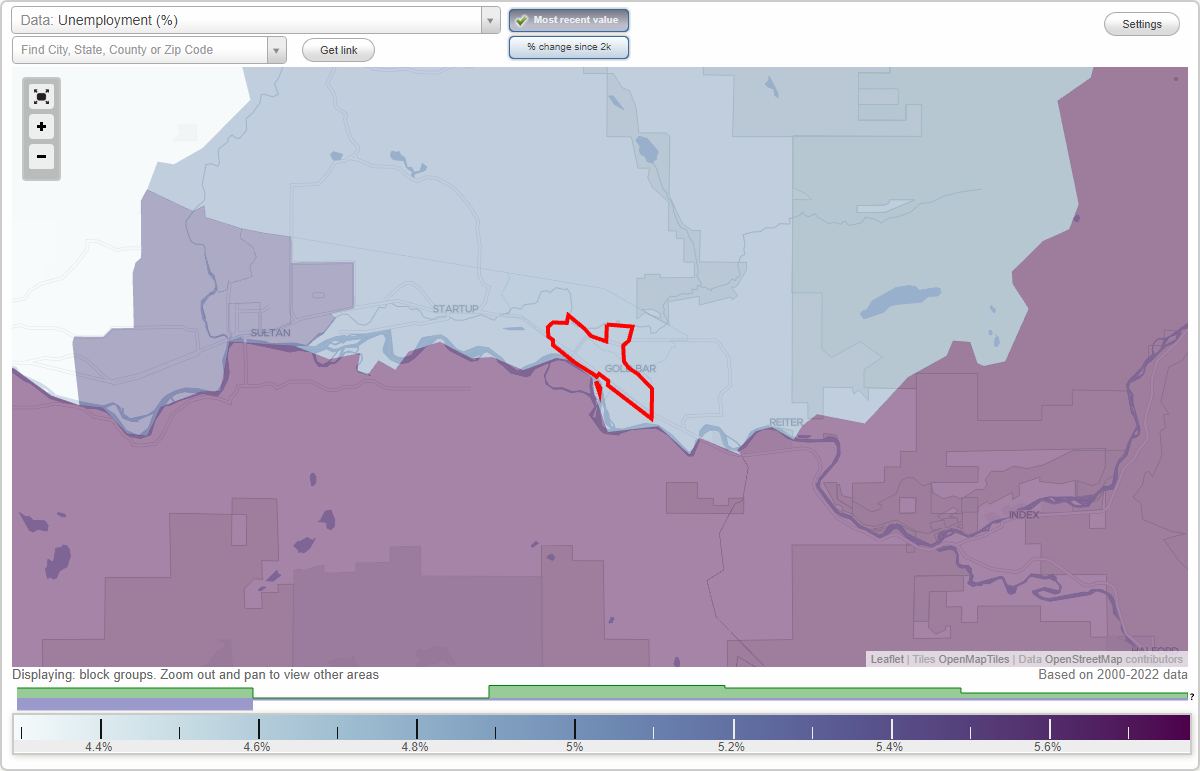
Unemployment in Gold Bar
- Unemployment by race in 2022
- Unemployment rate for White non-Hispanic residents
- 1.8%Males
- 7.7%Females
- Unemployment rate for two or more race residents
- 18.6%Females
- Unemployment by race in 2000
- Unemployment rate for White non-Hispanic residents
- 4.2%Males
- 5.2%Females
- Unemployment rate for Asian residents
- 57.1%Females
- Unemployment rate for other race residents
- 28.6%Females
- Unemployment rate for two or more race residents
- 63.6%Females
Time leaving home to go to work
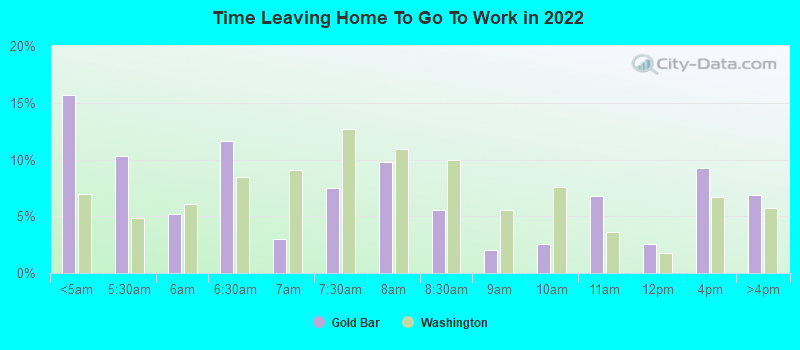
12:00 a.m. to 4:59 a.m.:
| Gold Bar: | 15.7% (139) |
| Washington: | 7.0% (213,920) |
5:00 a.m. to 5:29 a.m.:
| Gold Bar: | 10.3% (91) |
| Washington: | 4.8% (147,787) |
5:30 a.m. to 5:59 a.m.:
| Gold Bar: | 5.2% (46) |
| Washington: | 6.1% (185,330) |
6:00 a.m. to 6:29 a.m.:
| Gold Bar: | 11.6% (103) |
| Washington: | 8.4% (257,617) |
6:30 a.m. to 6:59 a.m.:
| Gold Bar: | 3.0% (27) |
| Washington: | 9.1% (277,560) |
7:00 a.m. to 7:29 a.m.:
| Gold Bar: | 7.5% (66) |
| Washington: | 12.7% (387,691) |
7:30 a.m. to 7:59 a.m.:
| Gold Bar: | 9.8% (87) |
| Washington: | 11.0% (335,322) |
8:00 a.m. to 8:29 a.m.:
| Gold Bar: | 5.5% (49) |
| Washington: | 10.0% (304,814) |
8:30 a.m. to 8:59 a.m.:
| Gold Bar: | 2.0% (18) |
| Washington: | 5.5% (169,492) |
9:00 a.m. to 9:59 a.m.:
| Gold Bar: | 2.5% (22) |
| Washington: | 7.6% (231,053) |
10:00 a.m. to 10:59 a.m.:
| Gold Bar: | 6.8% (61) |
| Washington: | 3.7% (111,784) |
11:00 a.m. to 11:59 a.m.:
| Gold Bar: | 2.6% (23) |
| Washington: | 1.8% (55,138) |
12:00 p.m. to 3:59 p.m.:
| Gold Bar: | 9.3% (82) |
| Washington: | 6.7% (205,284) |
4:00 p.m. to 11:59 p.m.:
| Gold Bar: | 6.8% (61) |
| Washington: | 5.7% (174,677) |
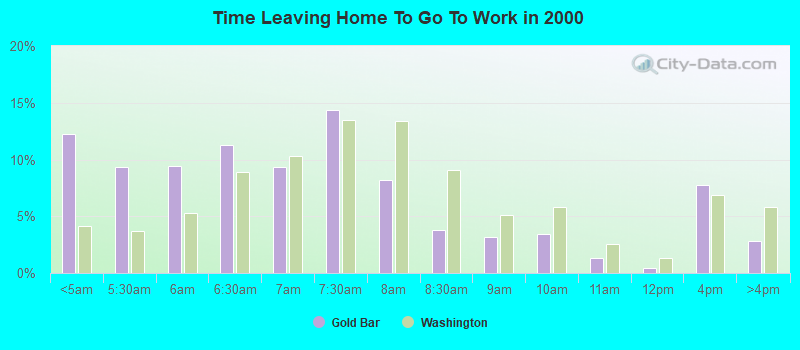
<5am:
| Gold Bar: | 12.2% (113) |
| Washington: | 4.2% (115,997) |
5:30am:
| Gold Bar: | 9.3% (86) |
| Washington: | 3.7% (102,868) |
6am:
| Gold Bar: | 9.4% (87) |
| Washington: | 5.3% (147,812) |
6:30am:
| Gold Bar: | 11.2% (104) |
| Washington: | 8.9% (248,462) |
7am:
| Gold Bar: | 9.3% (86) |
| Washington: | 10.3% (288,005) |
7:30am:
| Gold Bar: | 14.4% (133) |
| Washington: | 13.5% (375,030) |
8am:
| Gold Bar: | 8.2% (76) |
| Washington: | 13.4% (372,576) |
8:30am:
| Gold Bar: | 3.8% (35) |
| Washington: | 9.0% (252,058) |
9am:
| Gold Bar: | 3.1% (29) |
| Washington: | 5.1% (141,936) |
10am:
| Gold Bar: | 3.5% (32) |
| Washington: | 5.8% (161,204) |
11am:
| Gold Bar: | 1.3% (12) |
| Washington: | 2.5% (70,123) |
12pm:
| Gold Bar: | 0.4% (4) |
| Washington: | 1.3% (35,612) |
4pm:
| Gold Bar: | 7.8% (72) |
| Washington: | 6.8% (190,565) |
>4pm:
| Gold Bar: | 2.8% (26) |
| Washington: | 5.8% (162,401) |
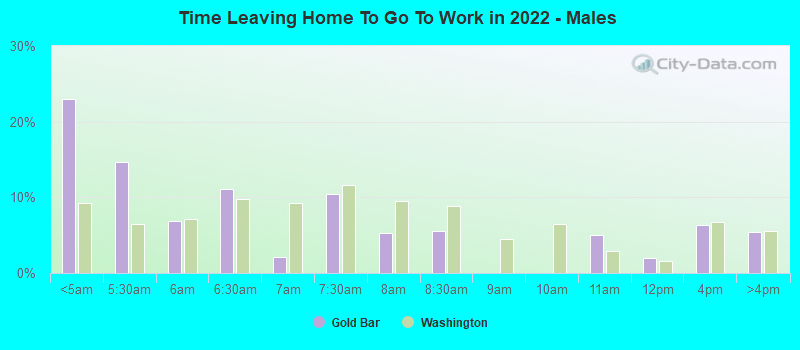
12:00 a.m. to 4:59 a.m. - Males:
| Gold Bar: | 23.0% (128) |
| Washington: | 9.3% (158,516) |
5:00 a.m. to 5:29 a.m. - Males:
| Gold Bar: | 14.7% (81) |
| Washington: | 6.5% (110,295) |
5:30 a.m. to 5:59 a.m. - Males:
| Gold Bar: | 6.9% (38) |
| Washington: | 7.1% (120,772) |
6:00 a.m. to 6:29 a.m. - Males:
| Gold Bar: | 11.1% (62) |
| Washington: | 9.8% (166,050) |
6:30 a.m. to 6:59 a.m. - Males:
| Gold Bar: | 2.1% (11) |
| Washington: | 9.3% (158,128) |
7:00 a.m. to 7:29 a.m. - Males:
| Gold Bar: | 10.4% (58) |
| Washington: | 11.7% (198,720) |
7:30 a.m. to 7:59 a.m. - Males:
| Gold Bar: | 5.3% (29) |
| Washington: | 9.6% (162,900) |
8:00 a.m. to 8:29 a.m. - Males:
| Gold Bar: | 5.5% (31) |
| Washington: | 8.8% (149,907) |
10:00 a.m. to 10:59 a.m. - Males:
| Gold Bar: | 5.1% (28) |
| Washington: | 2.9% (49,968) |
11:00 a.m. to 11:59 a.m. - Males:
| Gold Bar: | 2.0% (11) |
| Washington: | 1.6% (27,588) |
12:00 p.m. to 3:59 p.m. - Males:
| Gold Bar: | 6.4% (35) |
| Washington: | 6.8% (115,643) |
4:00 p.m. to 11:59 p.m. - Males:
| Gold Bar: | 5.4% (30) |
| Washington: | 5.6% (95,440) |
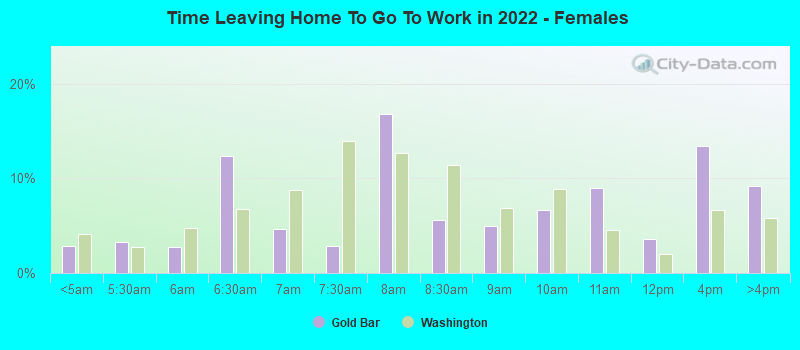
12:00 a.m. to 4:59 a.m. - Females:
| Gold Bar: | 2.9% (10) |
| Washington: | 4.1% (55,404) |
5:00 a.m. to 5:29 a.m. - Females:
| Gold Bar: | 3.3% (11) |
| Washington: | 2.8% (37,492) |
5:30 a.m. to 5:59 a.m. - Females:
| Gold Bar: | 2.7% (9) |
| Washington: | 4.8% (64,558) |
6:00 a.m. to 6:29 a.m. - Females:
| Gold Bar: | 12.4% (41) |
| Washington: | 6.8% (91,567) |
6:30 a.m. to 6:59 a.m. - Females:
| Gold Bar: | 4.7% (16) |
| Washington: | 8.8% (119,432) |
7:00 a.m. to 7:29 a.m. - Females:
| Gold Bar: | 2.9% (10) |
| Washington: | 13.9% (188,971) |
7:30 a.m. to 7:59 a.m. - Females:
| Gold Bar: | 16.9% (56) |
| Washington: | 12.7% (172,422) |
8:00 a.m. to 8:29 a.m. - Females:
| Gold Bar: | 5.6% (19) |
| Washington: | 11.4% (154,907) |
8:30 a.m. to 8:59 a.m. - Females:
| Gold Bar: | 4.9% (17) |
| Washington: | 6.8% (92,720) |
9:00 a.m. to 9:59 a.m. - Females:
| Gold Bar: | 6.7% (22) |
| Washington: | 8.8% (119,802) |
10:00 a.m. to 10:59 a.m. - Females:
| Gold Bar: | 9.0% (30) |
| Washington: | 4.6% (61,816) |
11:00 a.m. to 11:59 a.m. - Females:
| Gold Bar: | 3.6% (12) |
| Washington: | 2.0% (27,550) |
12:00 p.m. to 3:59 p.m. - Females:
| Gold Bar: | 13.4% (45) |
| Washington: | 6.6% (89,641) |
4:00 p.m. to 11:59 p.m. - Females:
| Gold Bar: | 9.2% (31) |
| Washington: | 5.8% (79,237) |
Travel time to work
Percentage of workers working in this county: 80.3%
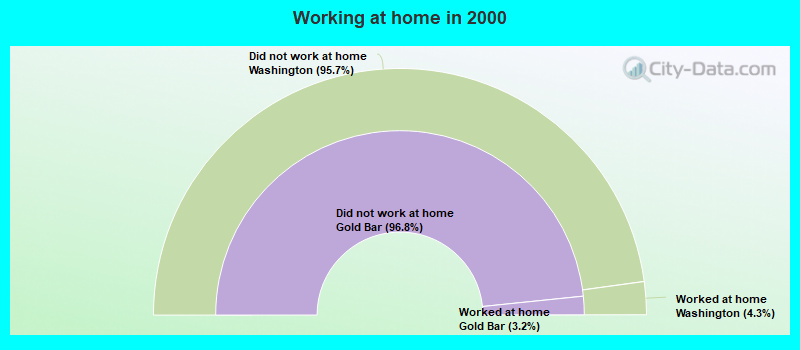
Number of people working at home: 128 (11.9% of all workers)
Number of people working at home: 128 (11.9% of all workers)
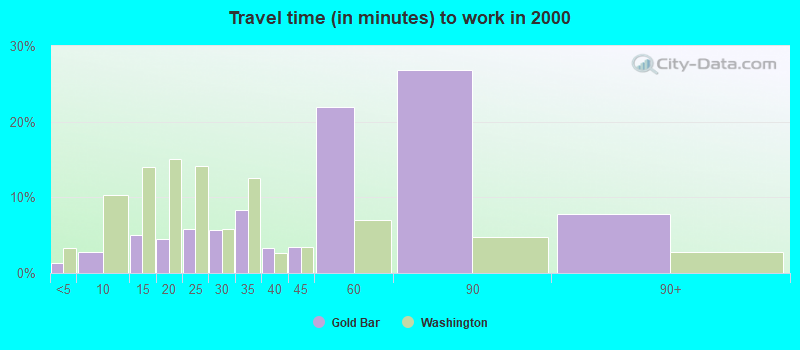
Less than 5 minutes:
| Gold Bar: | 1.3% (12) |
| Washington: | 3.3% (91,132) |
5 to 9 minutes:
| Gold Bar: | 2.8% (26) |
| Washington: | 10.3% (286,517) |
10 to 14 minutes:
| Gold Bar: | 5.0% (46) |
| Washington: | 14.1% (391,606) |
15 to 19 minutes:
| Gold Bar: | 4.5% (42) |
| Washington: | 15.0% (418,990) |
20 to 24 minutes:
| Gold Bar: | 5.8% (54) |
| Washington: | 14.2% (394,209) |
25 to 29 minutes:
| Gold Bar: | 5.7% (53) |
| Washington: | 5.8% (162,590) |
30 to 34 minutes:
| Gold Bar: | 8.3% (77) |
| Washington: | 12.5% (348,311) |
35 to 39 minutes:
| Gold Bar: | 3.2% (30) |
| Washington: | 2.6% (73,592) |
40 to 44 minutes:
| Gold Bar: | 3.5% (32) |
| Washington: | 3.4% (95,182) |
45 to 59 minutes:
| Gold Bar: | 21.9% (203) |
| Washington: | 7.0% (195,343) |
60 to 89 minutes:
| Gold Bar: | 26.8% (248) |
| Washington: | 4.7% (131,691) |
90 or more minutes:
| Gold Bar: | 7.8% (72) |
| Washington: | 2.7% (75,486) |
Means of transportation to work
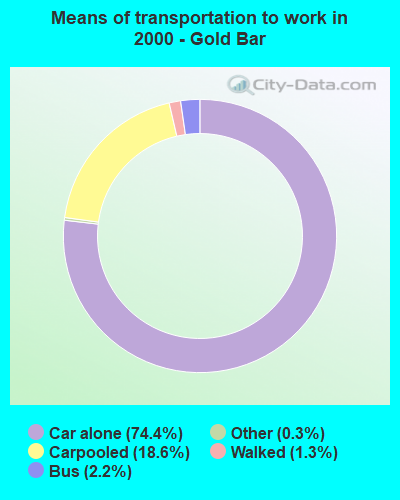

Drove car alone:
| Gold Bar: | 74.4% (688) |
| Washington: | 73.3% (2,040,833) |
Carpooled:
| Gold Bar: | 18.6% (172) |
| Washington: | 12.8% (357,742) |
Bus or trolley bus:
| Gold Bar: | 2.2% (20) |
| Washington: | 4.5% (124,450) |
Walked:
| Gold Bar: | 1.3% (12) |
| Washington: | 3.2% (89,739) |
Other means:
| Gold Bar: | 0.3% (3) |
| Washington: | 0.7% (19,499) |
Private vehicle occupancy
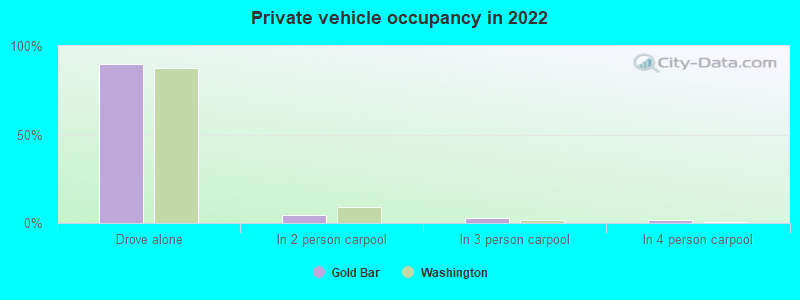
Drove alone:
| Gold Bar: | 89.9% (746) |
| Washington: | 87.8% (2,415,775) |
In 2 person carpool:
| Gold Bar: | 4.6% (38) |
| Washington: | 9.2% (252,715) |
In 3 person carpool:
| Gold Bar: | 2.9% (24) |
| Washington: | 1.6% (44,943) |
In 4 person carpool:
| Gold Bar: | 1.8% (15) |
| Washington: | 0.6% (17,361) |
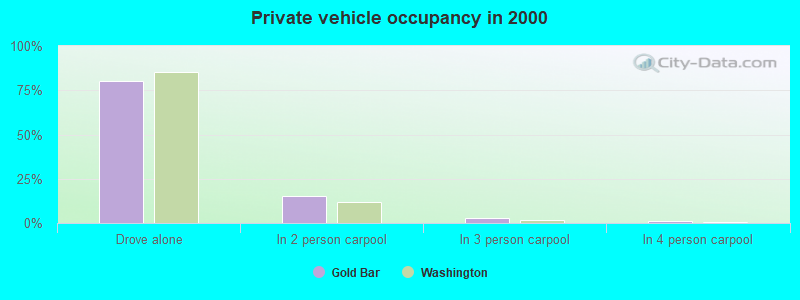
Drove alone:
| Gold Bar: | 80.0% (688) |
| Washington: | 85.1% (2,040,833) |
In 2 person carpool:
| Gold Bar: | 15.1% (130) |
| Washington: | 11.8% (282,638) |
In 3 person carpool:
| Gold Bar: | 3.0% (26) |
| Washington: | 1.9% (44,791) |
In 4 person carpool:
| Gold Bar: | 0.9% (8) |
| Washington: | 0.6% (14,195) |
In 5-6 person carpool:
| Gold Bar: | 0.6% (5) |
| Washington: | 0.3% (7,914) |
In 7+ person carpool:
| Gold Bar: | 0.3% (3) |
| Washington: | 0.3% (8,204) |
Class of workers
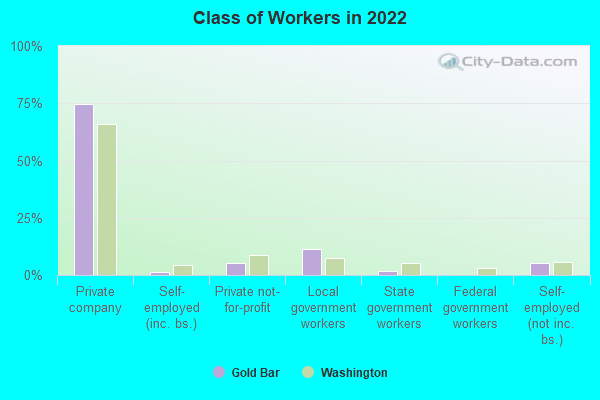
Employee of private company:
| Gold Bar: | 74.7% (888) |
| Washington: | 66.0% (2,552,907) |
Self-employed in own incorporated business:
| Gold Bar: | 1.4% (16) |
| Washington: | 4.2% (161,426) |
Private not-for-profit wage and salary workers:
| Gold Bar: | 5.4% (65) |
| Washington: | 8.6% (330,637) |
Local government workers:
| Gold Bar: | 11.5% (137) |
| Washington: | 7.3% (281,034) |
State government workers:
| Gold Bar: | 1.7% (21) |
| Washington: | 5.2% (201,670) |
Self-employed workers in own not incorporated business:
| Gold Bar: | 5.2% (62) |
| Washington: | 5.5% (212,937) |
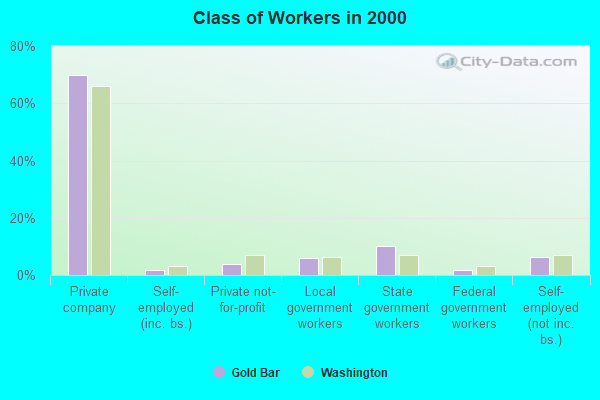
Employee of private company:
| Gold Bar: | 70.0% (667) |
| Washington: | 66.0% (1,843,000) |
Self-employed in own incorporated business:
| Gold Bar: | 1.9% (18) |
| Washington: | 3.2% (90,102) |
Private not-for-profit wage and salary workers:
| Gold Bar: | 3.8% (36) |
| Washington: | 6.9% (191,927) |
Local government workers:
| Gold Bar: | 5.8% (55) |
| Washington: | 6.4% (178,161) |
State government workers:
| Gold Bar: | 10.2% (97) |
| Washington: | 6.9% (192,408) |
Federal government workers:
| Gold Bar: | 1.7% (16) |
| Washington: | 3.2% (89,153) |
Self-employed workers in own not incorporated business:
| Gold Bar: | 6.4% (61) |
| Washington: | 7.2% (199,827) |
Unpaid family workers:
| Gold Bar: | 0.3% (3) |
| Washington: | 0.3% (9,144) |
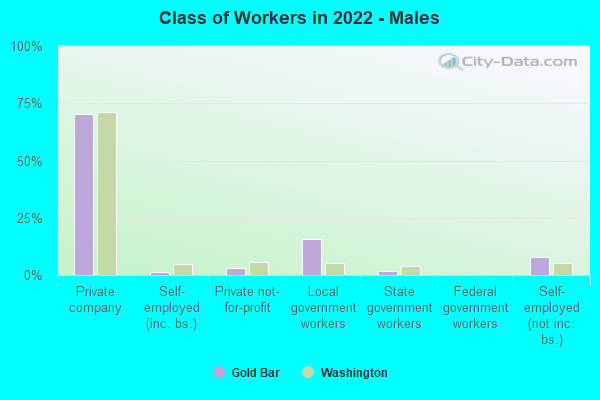
Employee of private company - Males:
| Gold Bar: | 70.3% (481) |
| Washington: | 71.1% (1,491,511) |
Self-employed in own incorporated business - Males:
| Gold Bar: | 1.5% (10) |
| Washington: | 4.9% (103,049) |
Private not-for-profit wage and salary workers - Males:
| Gold Bar: | 2.9% (20) |
| Washington: | 5.5% (116,374) |
Local government workers - Males:
| Gold Bar: | 15.8% (108) |
| Washington: | 5.4% (114,033) |
State government workers - Males:
| Gold Bar: | 1.7% (11) |
| Washington: | 4.1% (84,969) |
Self-employed workers in own not incorporated business - Males:
| Gold Bar: | 8.0% (54) |
| Washington: | 5.4% (113,810) |
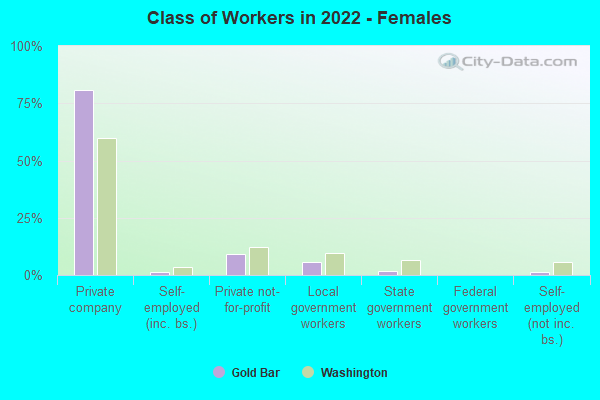
Employee of private company - Females:
| Gold Bar: | 80.8% (407) |
| Washington: | 60.0% (1,061,396) |
Self-employed in own incorporated business - Females:
| Gold Bar: | 1.2% (6) |
| Washington: | 3.3% (58,377) |
Private not-for-profit wage and salary workers - Females:
| Gold Bar: | 9.0% (45) |
| Washington: | 12.1% (214,263) |
Local government workers - Females:
| Gold Bar: | 5.7% (29) |
| Washington: | 9.4% (167,001) |
State government workers - Females:
| Gold Bar: | 1.8% (9) |
| Washington: | 6.6% (116,701) |
Self-employed workers in own not incorporated business - Females:
| Gold Bar: | 1.4% (7) |
| Washington: | 5.6% (99,127) |