Work and Jobs in Imperial, California (CA) Detailed Stats
Occupations, Industries, Unemployment, Workers, Commute
Settings
X


Recent posts about work in Imperial, California on our local forum with over 2,400,000 registered users:

Latest news about work in Imperial, CA collected exclusively by city-data.com from local newspapers, TV, and radio stations
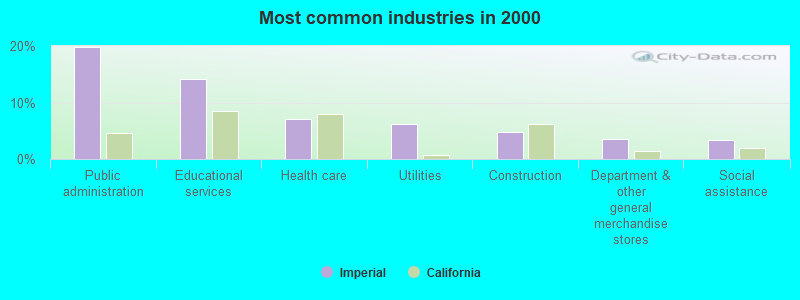
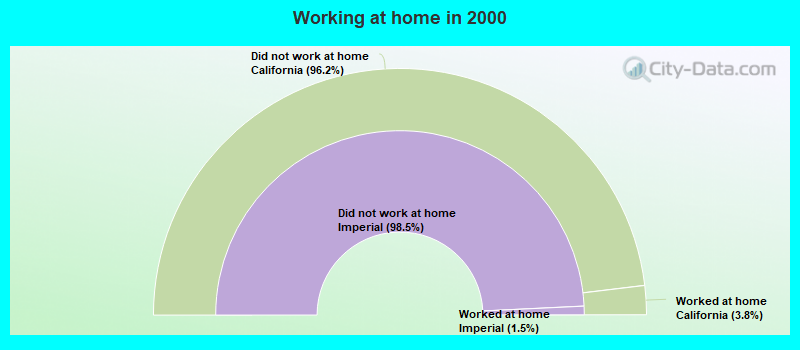
The most common industries in Imperial are: Public administration (19.8% of civilian employees), Educational services (14.2% of civilian employees), Health care (7.0% of civilian employees). 92.4% of workers work in Imperial County and 6.0% of all workers work at home. 59.3% of workers are employees of private companies, which is 12.1% less than the rate of 66.5% across the entire state of California.
Whole page based on the data from 2000 / 2022 when the population of Imperial, California was 7,560 / 20,332
Whole page based on the data from 2000 / 2022 when the population of Imperial, California was 7,560 / 20,332
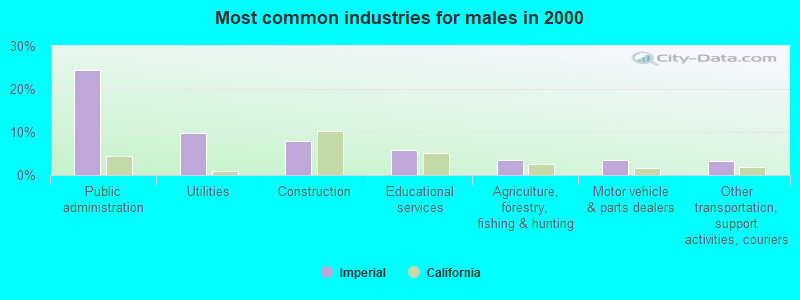
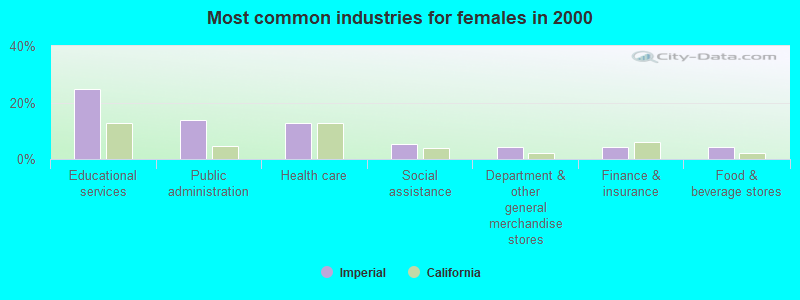
Most common industries
Most common industries | |||
|---|---|---|---|
Industry | All | Males | Females |
| Public administration | 19.8% (596) | 24.5% (407) | 13.9% (189) |
| Educational services | 14.2% (429) | 5.7% (95) | 24.6% (334) |
| Health care | 7.0% (211) | 2.4% (39) | 12.7% (172) |
| Utilities | 6.1% (185) | 9.8% (162) | 1.7% (23) |
| Construction | 4.8% (145) | 8.0% (133) | 0.9% (12) |
| Department and other general merchandise stores | 3.6% (109) | 3.0% (49) | 4.4% (60) |
| Social assistance | 3.4% (103) | 1.8% (30) | 5.4% (73) |
| Finance and insurance | 2.7% (80) | 1.2% (20) | 4.4% (60) |
| Accommodation and food services | 2.5% (76) | 1.5% (25) | 3.8% (51) |
| Food and beverage stores | 2.4% (73) | 1.0% (17) | 4.1% (56) |
| Other transportation, and support activities, and couriers | 2.4% (72) | 3.2% (53) | 1.4% (19) |
| Real estate and rental and leasing | 2.4% (71) | 2.0% (33) | 2.8% (38) |
| Agriculture, forestry, fishing and hunting | 2.3% (70) | 3.6% (59) | 0.8% (11) |
| Professional, scientific, and technical services | 2.0% (61) | 1.7% (29) | 2.4% (32) |
| Motor vehicle and parts dealers | 1.9% (56) | 3.4% (56) | 0.0% (0) |
| Administrative and support and waste management services | 1.7% (51) | 1.9% (31) | 1.5% (20) |
| Groceries and related products merchant wholesalers | 1.6% (48) | 1.6% (26) | 1.6% (22) |
| Transportation equipment | 1.4% (42) | 2.0% (33) | 0.7% (9) |
| Religious, grantmaking, civic, professional, and similar organizations | 1.3% (40) | 1.3% (21) | 1.4% (19) |
| Personal and laundry services | 1.3% (39) | 1.1% (19) | 1.5% (20) |
| Food | 1.1% (34) | 1.7% (28) | 0.4% (6) |
| Truck transportation | 1.1% (34) | 1.7% (29) | 0.4% (5) |
| Data processing, libraries, and other information services | 1.1% (33) | 0.8% (14) | 1.4% (19) |
| Building material and garden equipment and supplies dealers | 1.1% (32) | 0.7% (12) | 1.5% (20) |
| Mining, quarrying, and oil and gas extraction | 1.0% (31) | 1.9% (31) | 0.0% (0) |
| Other direct selling establishments | 1.0% (31) | 1.2% (20) | 0.8% (11) |
| Printing and related support activities | 1.0% (29) | 0.7% (11) | 1.3% (18) |
| Repair and maintenance | 0.8% (24) | 1.4% (24) | 0.0% (0) |
| Nonmetallic mineral products | 0.6% (18) | 1.1% (18) | 0.0% (0) |
| Farm supplies merchant wholesalers | 0.6% (18) | 1.1% (18) | 0.0% (0) |
| Furniture and related product manufacturing | 0.5% (15) | 0.9% (15) | 0.0% (0) |
| Arts, entertainment, and recreation | 0.5% (15) | 0.9% (15) | 0.0% (0) |
| Beverage and tobacco products | 0.5% (14) | 0.8% (14) | 0.0% (0) |
| Private households | 0.5% (14) | 0.0% (0) | 1.0% (14) |
| Professional and commercial equipment and supplies merchant wholesalers | 0.4% (12) | 0.0% (0) | 0.9% (12) |
| Gasoline stations | 0.3% (10) | 0.6% (10) | 0.0% (0) |
| Computer and electronic products | 0.3% (10) | 0.3% (5) | 0.4% (5) |
| Radio, TV, and computer stores | 0.3% (9) | 0.5% (9) | 0.0% (0) |
| Pharmacies and drug stores | 0.3% (9) | 0.5% (9) | 0.0% (0) |
| Broadcasting and telecommunications | 0.3% (8) | 0.5% (8) | 0.0% (0) |
| Paper and paper products merchant wholesalers | 0.3% (8) | 0.5% (8) | 0.0% (0) |
| Health and personal care, except drug, stores | 0.2% (7) | 0.0% (0) | 0.5% (7) |
| Clothing and accessories, including shoe, stores | 0.2% (7) | 0.4% (7) | 0.0% (0) |
| Sporting goods, camera, and hobby and toy stores | 0.2% (7) | 0.0% (0) | 0.5% (7) |
| Miscellaneous manufacturing | 0.2% (7) | 0.0% (0) | 0.5% (7) |
| Furniture and home furnishings, and household appliance stores | 0.2% (6) | 0.4% (6) | 0.0% (0) |
| Machinery, equipment, and supplies merchant wholesalers | 0.2% (6) | 0.0% (0) | 0.4% (6) |
| Metal and metal products | 0.1% (4) | 0.2% (4) | 0.0% (0) |
| Electrical equipment, appliances, and components | 0.1% (4) | 0.2% (4) | 0.0% (0) |
| Publishing, and motion picture and sound recording industries | 0.1% (3) | 0.2% (3) | 0.0% (0) |
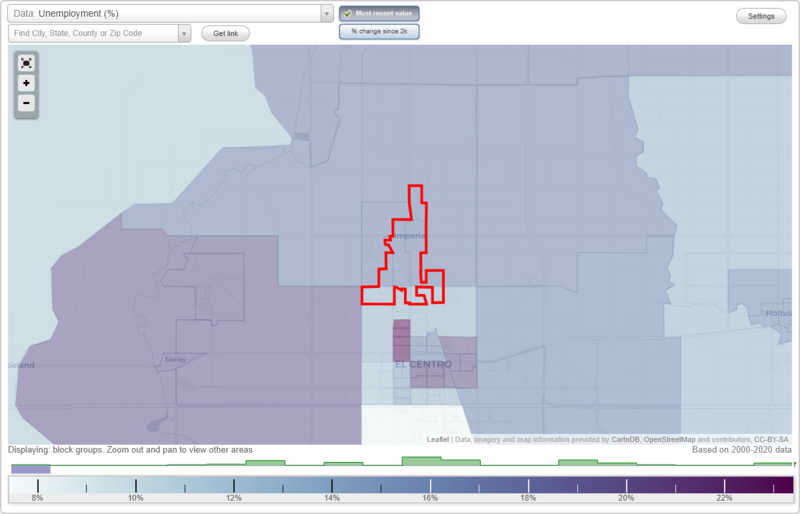
Unemployment in Imperial
- Unemployment by race in 2022
- Unemployment rate for White non-Hispanic residents
- 6.3%Males
- 7.1%Females
- Unemployment rate for Black residents
- 24.2%Males
- Unemployment rate for Asian residents
- 9.7%Males
- Unemployment rate for other race residents
- 2.2%Males
- 2.5%Females
- Unemployment rate for two or more race residents
- 1.3%Males
- 29.8%Females
- Unemployment rate for Hispanic or Latino residents
- 6.4%Males
- 12.4%Females
- Unemployment by race in 2000
- Unemployment rate for White non-Hispanic residents
- 5.5%Males
- 6.1%Females
- Unemployment rate for Black residents
- 32.6%Males
- Unemployment rate for Asian residents
- 14.3%Males
- Unemployment rate for other race residents
- 11.5%Males
- 13.0%Females
- Unemployment rate for two or more race residents
- 25.6%Females
- Unemployment rate for Hispanic or Latino residents
- 10.2%Males
- 10.1%Females
Time leaving home to go to work
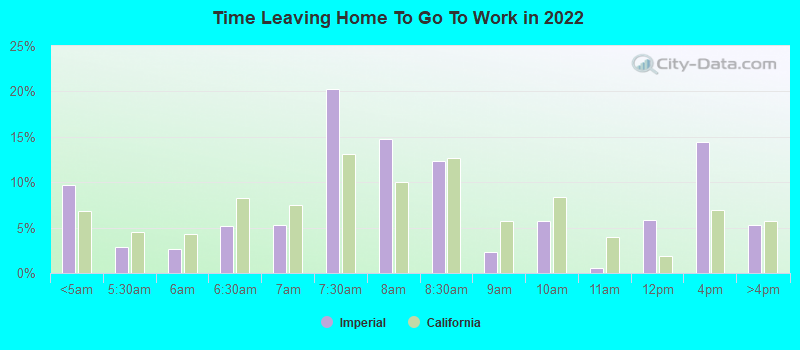
12:00 a.m. to 4:59 a.m.:
| Imperial: | 9.7% (712) |
| California: | 6.8% (1,050,902) |
5:00 a.m. to 5:29 a.m.:
| Imperial: | 2.9% (209) |
| California: | 4.5% (692,772) |
5:30 a.m. to 5:59 a.m.:
| Imperial: | 2.7% (194) |
| California: | 4.3% (665,475) |
6:00 a.m. to 6:29 a.m.:
| Imperial: | 5.1% (376) |
| California: | 8.3% (1,273,588) |
6:30 a.m. to 6:59 a.m.:
| Imperial: | 5.3% (387) |
| California: | 7.5% (1,156,338) |
7:00 a.m. to 7:29 a.m.:
| Imperial: | 20.2% (1,480) |
| California: | 13.2% (2,027,702) |
7:30 a.m. to 7:59 a.m.:
| Imperial: | 14.7% (1,077) |
| California: | 10.1% (1,550,402) |
8:00 a.m. to 8:29 a.m.:
| Imperial: | 12.4% (904) |
| California: | 12.7% (1,953,986) |
8:30 a.m. to 8:59 a.m.:
| Imperial: | 2.3% (167) |
| California: | 5.8% (890,950) |
9:00 a.m. to 9:59 a.m.:
| Imperial: | 5.7% (415) |
| California: | 8.4% (1,288,499) |
10:00 a.m. to 10:59 a.m.:
| Imperial: | 0.5% (37) |
| California: | 4.0% (613,193) |
11:00 a.m. to 11:59 a.m.:
| Imperial: | 5.8% (425) |
| California: | 1.8% (280,975) |
12:00 p.m. to 3:59 p.m.:
| Imperial: | 14.5% (1,057) |
| California: | 7.0% (1,075,505) |
4:00 p.m. to 11:59 p.m.:
| Imperial: | 5.3% (387) |
| California: | 5.8% (891,240) |
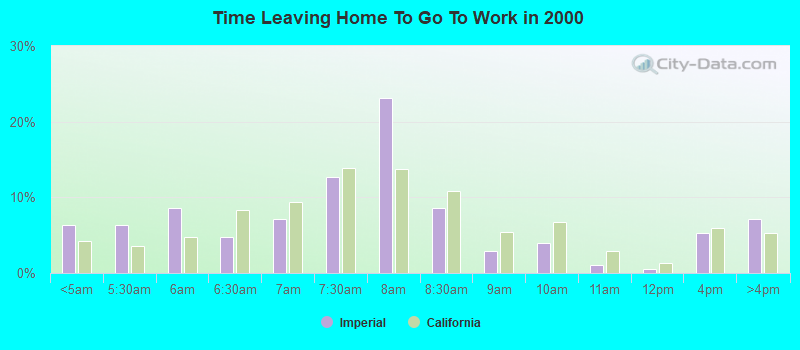
<5am:
| Imperial: | 6.4% (191) |
| California: | 4.2% (606,086) |
5:30am:
| Imperial: | 6.4% (190) |
| California: | 3.6% (523,209) |
6am:
| Imperial: | 8.6% (256) |
| California: | 4.8% (692,256) |
6:30am:
| Imperial: | 4.7% (141) |
| California: | 8.4% (1,216,867) |
7am:
| Imperial: | 7.2% (215) |
| California: | 9.4% (1,362,830) |
7:30am:
| Imperial: | 12.6% (378) |
| California: | 13.8% (2,006,950) |
8am:
| Imperial: | 23.1% (691) |
| California: | 13.7% (1,986,831) |
8:30am:
| Imperial: | 8.6% (257) |
| California: | 10.9% (1,577,815) |
9am:
| Imperial: | 2.9% (87) |
| California: | 5.4% (778,152) |
10am:
| Imperial: | 3.9% (118) |
| California: | 6.7% (972,355) |
11am:
| Imperial: | 1.1% (32) |
| California: | 2.9% (414,479) |
12pm:
| Imperial: | 0.5% (16) |
| California: | 1.3% (189,005) |
4pm:
| Imperial: | 5.3% (158) |
| California: | 6.0% (865,284) |
>4pm:
| Imperial: | 7.1% (213) |
| California: | 5.3% (776,167) |
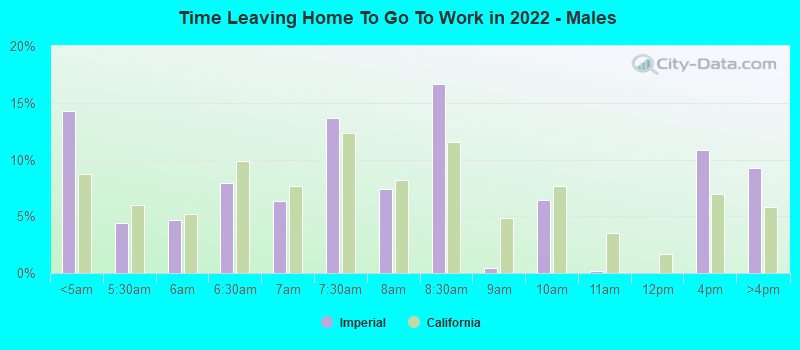
12:00 a.m. to 4:59 a.m. - Males:
| Imperial: | 14.3% (587) |
| California: | 8.7% (747,612) |
5:00 a.m. to 5:29 a.m. - Males:
| Imperial: | 4.4% (179) |
| California: | 6.0% (509,420) |
5:30 a.m. to 5:59 a.m. - Males:
| Imperial: | 4.7% (193) |
| California: | 5.2% (448,269) |
6:00 a.m. to 6:29 a.m. - Males:
| Imperial: | 7.9% (325) |
| California: | 9.8% (842,941) |
6:30 a.m. to 6:59 a.m. - Males:
| Imperial: | 6.4% (262) |
| California: | 7.7% (657,557) |
7:00 a.m. to 7:29 a.m. - Males:
| Imperial: | 13.7% (562) |
| California: | 12.4% (1,058,532) |
7:30 a.m. to 7:59 a.m. - Males:
| Imperial: | 7.4% (306) |
| California: | 8.2% (702,727) |
8:00 a.m. to 8:29 a.m. - Males:
| Imperial: | 16.7% (685) |
| California: | 11.5% (984,538) |
8:30 a.m. to 8:59 a.m. - Males:
| Imperial: | 0.4% (17) |
| California: | 4.8% (414,815) |
9:00 a.m. to 9:59 a.m. - Males:
| Imperial: | 6.4% (264) |
| California: | 7.7% (655,038) |
10:00 a.m. to 10:59 a.m. - Males:
| Imperial: | 0.1% (6) |
| California: | 3.5% (301,425) |
12:00 p.m. to 3:59 p.m. - Males:
| Imperial: | 10.9% (446) |
| California: | 7.0% (594,847) |
4:00 p.m. to 11:59 p.m. - Males:
| Imperial: | 9.3% (382) |
| California: | 5.8% (499,471) |
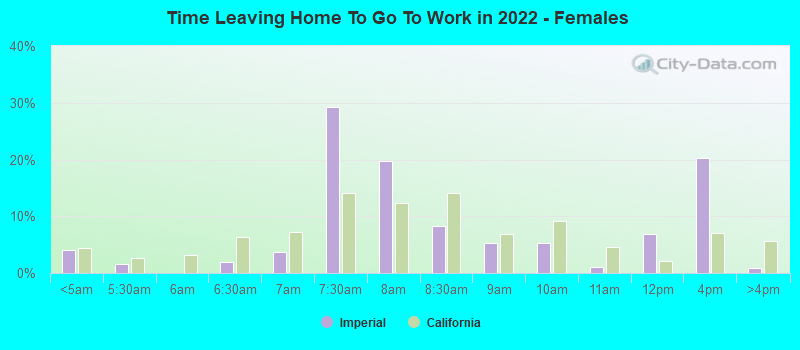
12:00 a.m. to 4:59 a.m. - Females:
| Imperial: | 4.0% (125) |
| California: | 4.4% (303,290) |
5:00 a.m. to 5:29 a.m. - Females:
| Imperial: | 1.6% (52) |
| California: | 2.7% (183,352) |
6:00 a.m. to 6:29 a.m. - Females:
| Imperial: | 2.0% (63) |
| California: | 6.3% (430,647) |
6:30 a.m. to 6:59 a.m. - Females:
| Imperial: | 3.6% (114) |
| California: | 7.3% (498,781) |
7:00 a.m. to 7:29 a.m. - Females:
| Imperial: | 29.2% (918) |
| California: | 14.1% (969,170) |
7:30 a.m. to 7:59 a.m. - Females:
| Imperial: | 19.7% (618) |
| California: | 12.4% (847,675) |
8:00 a.m. to 8:29 a.m. - Females:
| Imperial: | 8.4% (263) |
| California: | 14.1% (969,448) |
8:30 a.m. to 8:59 a.m. - Females:
| Imperial: | 5.3% (166) |
| California: | 6.9% (476,135) |
9:00 a.m. to 9:59 a.m. - Females:
| Imperial: | 5.3% (166) |
| California: | 9.2% (633,461) |
10:00 a.m. to 10:59 a.m. - Females:
| Imperial: | 1.1% (35) |
| California: | 4.5% (311,768) |
11:00 a.m. to 11:59 a.m. - Females:
| Imperial: | 6.9% (216) |
| California: | 2.0% (139,355) |
12:00 p.m. to 3:59 p.m. - Females:
| Imperial: | 20.3% (638) |
| California: | 7.0% (480,658) |
4:00 p.m. to 11:59 p.m. - Females:
| Imperial: | 0.8% (26) |
| California: | 5.7% (391,769) |
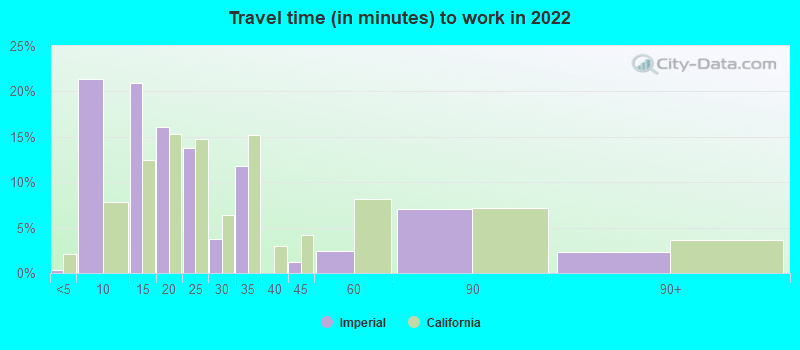
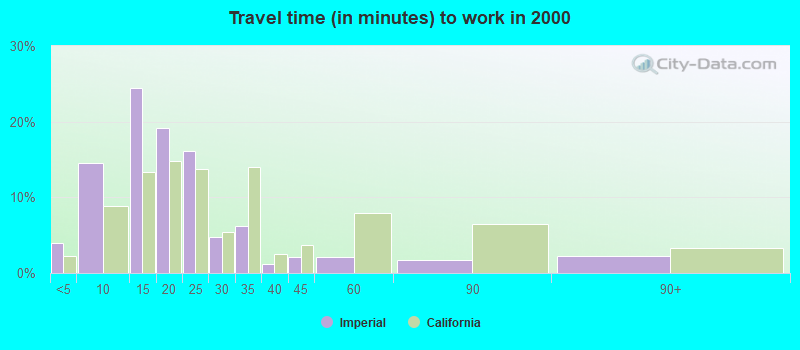
Travel time to work
Percentage of workers working in this county: 92.4%
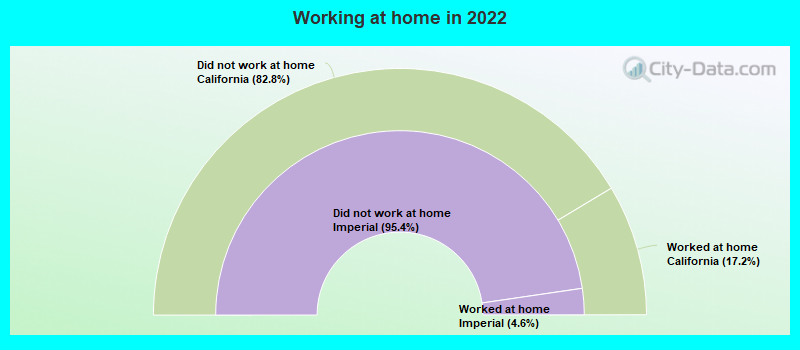
Number of people working at home: 463 (6.0% of all workers)
Daytime population change due to commuting: -861 (-11.4%)
Workers who live and work in this city: 631 (21.1%)
Number of people working at home: 463 (6.0% of all workers)
Daytime population change due to commuting: -861 (-11.4%)
Workers who live and work in this city: 631 (21.1%)
Less than 5 minutes:
| Imperial: | 0.3% (14) |
| California: | 2.1% (323,064) |
5 to 9 minutes:
| Imperial: | 21.4% (905) |
| California: | 7.8% (1,208,682) |
10 to 14 minutes:
| Imperial: | 20.9% (884) |
| California: | 12.4% (1,917,610) |
15 to 19 minutes:
| Imperial: | 16.1% (679) |
| California: | 15.3% (2,367,483) |
20 to 24 minutes:
| Imperial: | 13.8% (582) |
| California: | 14.8% (2,279,693) |
25 to 29 minutes:
| Imperial: | 3.7% (157) |
| California: | 6.4% (981,997) |
30 to 34 minutes:
| Imperial: | 11.8% (498) |
| California: | 15.2% (2,339,223) |
40 to 44 minutes:
| Imperial: | 1.2% (49) |
| California: | 4.1% (637,781) |
45 to 59 minutes:
| Imperial: | 2.4% (102) |
| California: | 8.2% (1,259,482) |
60 to 89 minutes:
| Imperial: | 7.1% (299) |
| California: | 7.2% (1,111,698) |
90 or more minutes:
| Imperial: | 2.3% (98) |
| California: | 3.6% (552,805) |
Less than 5 minutes:
| Imperial: | 3.9% (117) |
| California: | 2.2% (324,703) |
5 to 9 minutes:
| Imperial: | 14.6% (435) |
| California: | 8.8% (1,280,443) |
10 to 14 minutes:
| Imperial: | 24.5% (731) |
| California: | 13.3% (1,930,263) |
15 to 19 minutes:
| Imperial: | 19.1% (572) |
| California: | 14.9% (2,157,970) |
20 to 24 minutes:
| Imperial: | 16.1% (482) |
| California: | 13.8% (2,004,060) |
25 to 29 minutes:
| Imperial: | 4.7% (141) |
| California: | 5.4% (782,241) |
30 to 34 minutes:
| Imperial: | 6.2% (186) |
| California: | 13.9% (2,025,657) |
35 to 39 minutes:
| Imperial: | 1.1% (34) |
| California: | 2.5% (366,487) |
40 to 44 minutes:
| Imperial: | 2.1% (62) |
| California: | 3.6% (528,043) |
45 to 59 minutes:
| Imperial: | 2.1% (63) |
| California: | 7.9% (1,151,598) |
60 to 89 minutes:
| Imperial: | 1.7% (52) |
| California: | 6.4% (933,123) |
90 or more minutes:
| Imperial: | 2.3% (68) |
| California: | 3.3% (483,698) |
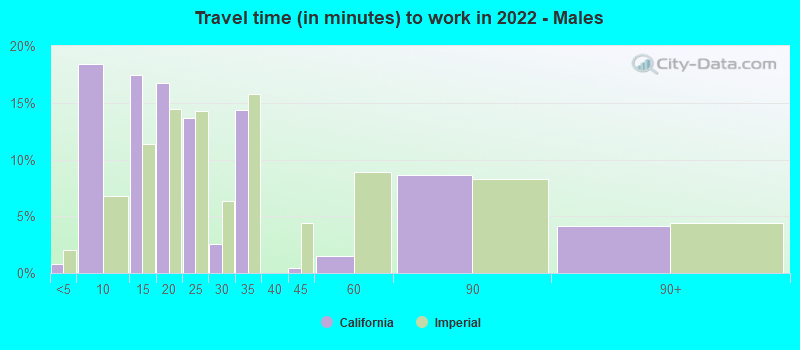
Less than 5 minutes - Males:
| Imperial: | 0.8% (22) |
| California: | 2.0% (173,603) |
5 to 9 minutes - Males:
| Imperial: | 18.4% (498) |
| California: | 6.8% (580,822) |
10 to 14 minutes - Males:
| Imperial: | 17.4% (472) |
| California: | 11.4% (974,497) |
15 to 19 minutes - Males:
| Imperial: | 16.8% (454) |
| California: | 14.5% (1,239,386) |
20 to 24 minutes - Males:
| Imperial: | 13.7% (370) |
| California: | 14.3% (1,223,429) |
25 to 29 minutes - Males:
| Imperial: | 2.5% (69) |
| California: | 6.4% (545,844) |
30 to 34 minutes - Males:
| Imperial: | 14.4% (390) |
| California: | 15.8% (1,352,210) |
40 to 44 minutes - Males:
| Imperial: | 0.4% (12) |
| California: | 4.4% (376,144) |
45 to 59 minutes - Males:
| Imperial: | 1.5% (39) |
| California: | 8.9% (762,659) |
60 to 89 minutes - Males:
| Imperial: | 8.6% (234) |
| California: | 8.3% (711,394) |
90 or more minutes - Males:
| Imperial: | 4.1% (112) |
| California: | 4.4% (378,954) |
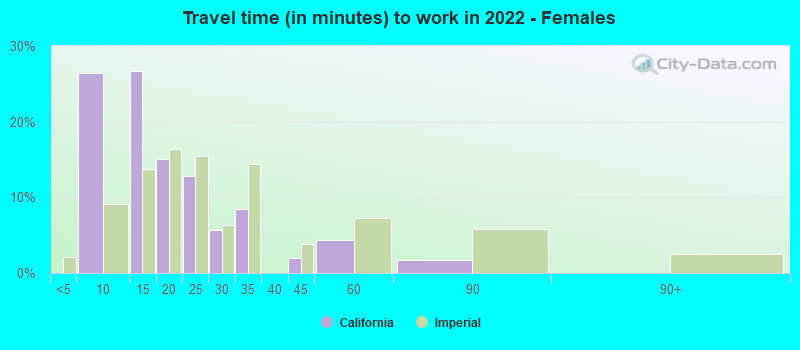
5 to 9 minutes - Females:
| Imperial: | 26.4% (407) |
| California: | 9.2% (627,860) |
10 to 14 minutes - Females:
| Imperial: | 26.8% (412) |
| California: | 13.7% (943,113) |
15 to 19 minutes - Females:
| Imperial: | 15.0% (232) |
| California: | 16.4% (1,128,097) |
20 to 24 minutes - Females:
| Imperial: | 12.8% (197) |
| California: | 15.4% (1,056,264) |
25 to 29 minutes - Females:
| Imperial: | 5.7% (88) |
| California: | 6.4% (436,153) |
30 to 34 minutes - Females:
| Imperial: | 8.4% (130) |
| California: | 14.4% (987,013) |
40 to 44 minutes - Females:
| Imperial: | 2.0% (31) |
| California: | 3.8% (261,637) |
45 to 59 minutes - Females:
| Imperial: | 4.4% (67) |
| California: | 7.2% (496,823) |
60 to 89 minutes - Females:
| Imperial: | 1.7% (27) |
| California: | 5.8% (400,304) |
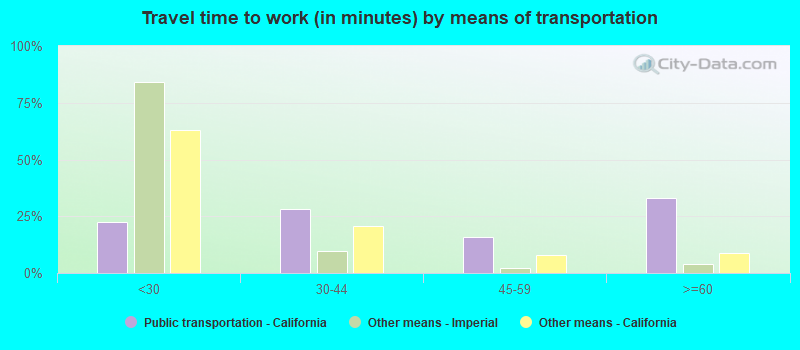
Means of transportation to work
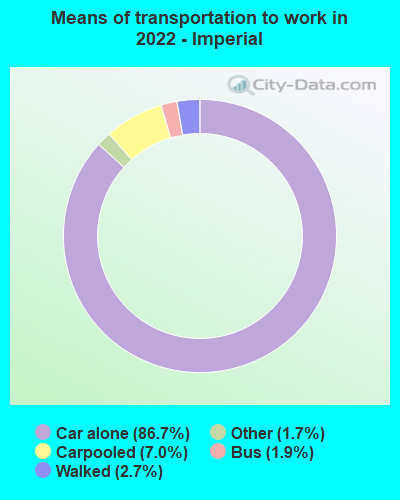

Drove car alone:
| Imperial: | 86.7% (3,324) |
| California: | 79.1% (5,345,368) |
Carpooled:
| Imperial: | 7.0% (268) |
| California: | 11.9% (878,699) |
Bus:
| Imperial: | 1.9% (73) |
| California: | 2.2% (170,574) |
Walked:
| Imperial: | 2.7% (103) |
| California: | 2.9% (218,374) |
Other means:
| Imperial: | 1.7% (64) |
| California: | 2.1% (137,489) |
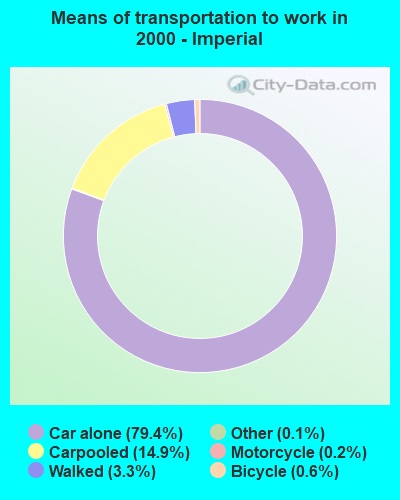

Drove car alone:
| Imperial: | 79.4% (2,374) |
| California: | 71.8% (10,432,462) |
Carpooled:
| Imperial: | 14.9% (444) |
| California: | 14.5% (2,113,313) |
Motorcycle:
| Imperial: | 0.2% (6) |
| California: | 0.2% (36,262) |
Bicycle:
| Imperial: | 0.6% (17) |
| California: | 0.8% (120,567) |
Walked:
| Imperial: | 3.3% (98) |
| California: | 2.9% (414,581) |
Other means:
| Imperial: | 0.1% (4) |
| California: | 0.8% (115,064) |
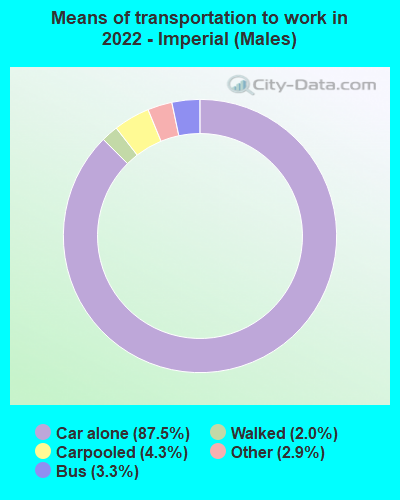

Drove car alone - Males:
| Imperial: | 87.5% (1,944) |
| California: | 80.0% (5,345,368) |
Carpooled - Males:
| Imperial: | 4.3% (96) |
| California: | 11.1% (878,699) |
Bus - Males:
| Imperial: | 3.3% (73) |
| California: | 2.0% (170,574) |
Walked - Males:
| Imperial: | 2.0% (44) |
| California: | 2.7% (218,374) |
Other means - Males:
| Imperial: | 2.9% (64) |
| California: | 2.1% (137,489) |
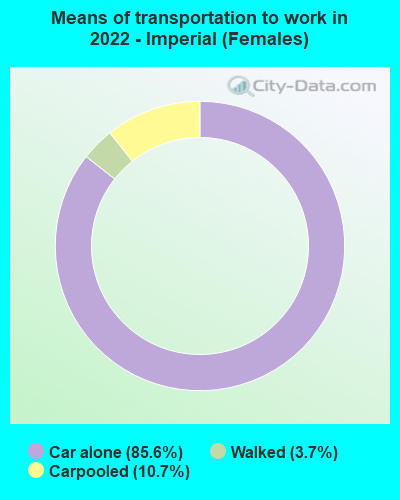

Drove car alone - Females:
| Imperial: | 85.6% (1,378) |
| California: | 77.9% (5,345,368) |
Carpooled - Females:
| Imperial: | 10.7% (173) |
| California: | 12.8% (878,699) |
Walked - Females:
| Imperial: | 3.7% (59) |
| California: | 3.2% (218,374) |
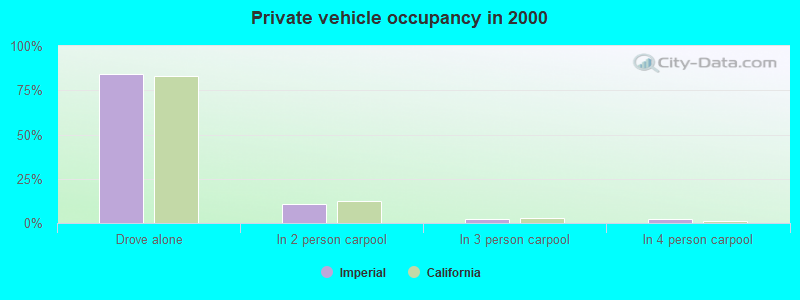
Private vehicle occupancy
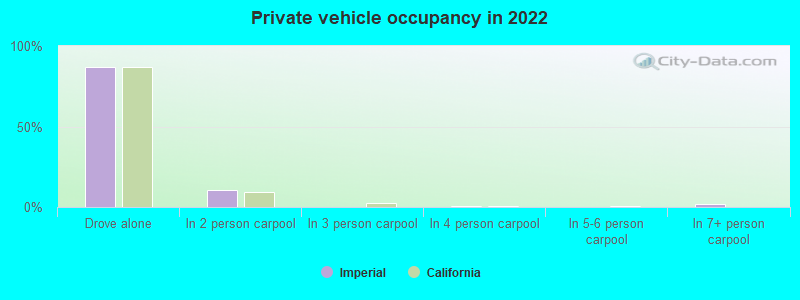
Drove alone:
| Imperial: | 87.0% (6,057) |
| California: | 86.9% (12,187,486) |
In 2 person carpool:
| Imperial: | 10.3% (716) |
| California: | 9.2% (1,295,561) |
In 4 person carpool:
| Imperial: | 0.8% (57) |
| California: | 0.9% (126,987) |
In 7+ person carpool:
| Imperial: | 1.9% (130) |
| California: | 0.2% (28,258) |
Drove alone:
| Imperial: | 84.2% (2,374) |
| California: | 83.2% (10,432,462) |
In 2 person carpool:
| Imperial: | 11.0% (309) |
| California: | 12.5% (1,564,905) |
In 3 person carpool:
| Imperial: | 2.5% (71) |
| California: | 2.6% (330,732) |
In 4 person carpool:
| Imperial: | 2.3% (64) |
| California: | 1.0% (119,364) |
Class of workers
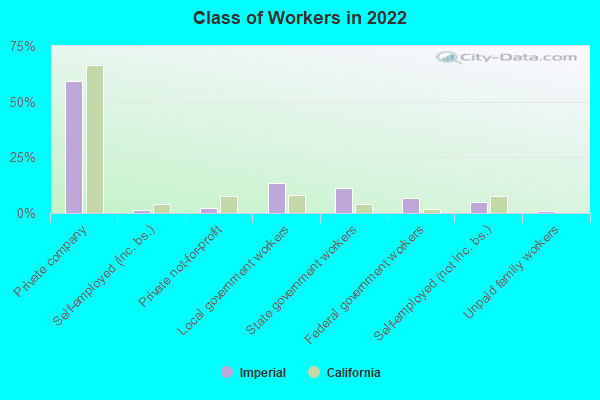
Employee of private company:
| Imperial: | 59.3% (4,620) |
| California: | 66.5% (12,596,030) |
Self-employed in own incorporated business:
| Imperial: | 1.4% (112) |
| California: | 4.1% (784,709) |
Private not-for-profit wage and salary workers:
| Imperial: | 2.1% (161) |
| California: | 7.5% (1,417,407) |
Local government workers:
| Imperial: | 13.5% (1,054) |
| California: | 8.2% (1,547,056) |
State government workers:
| Imperial: | 11.2% (872) |
| California: | 4.1% (780,915) |
Federal government workers:
| Imperial: | 6.9% (538) |
| California: | 2.0% (369,858) |
Self-employed workers in own not incorporated business:
| Imperial: | 4.7% (369) |
| California: | 7.4% (1,410,735) |
Unpaid family workers:
| Imperial: | 0.8% (65) |
| California: | 0.2% (36,267) |
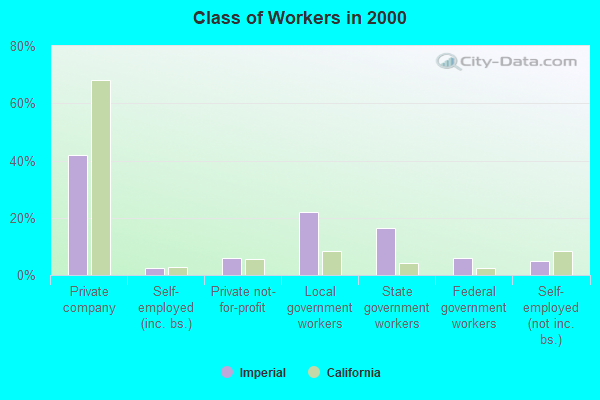
Employee of private company:
| Imperial: | 42.1% (1,269) |
| California: | 68.0% (10,009,465) |
Self-employed in own incorporated business:
| Imperial: | 2.6% (77) |
| California: | 2.7% (402,392) |
Private not-for-profit wage and salary workers:
| Imperial: | 5.8% (176) |
| California: | 5.7% (845,536) |
Local government workers:
| Imperial: | 21.9% (660) |
| California: | 8.3% (1,218,764) |
State government workers:
| Imperial: | 16.2% (490) |
| California: | 4.0% (594,953) |
Federal government workers:
| Imperial: | 6.1% (183) |
| California: | 2.3% (344,354) |
Self-employed workers in own not incorporated business:
| Imperial: | 4.9% (147) |
| California: | 8.5% (1,249,530) |
Unpaid family workers:
| Imperial: | 0.5% (14) |
| California: | 0.4% (53,934) |
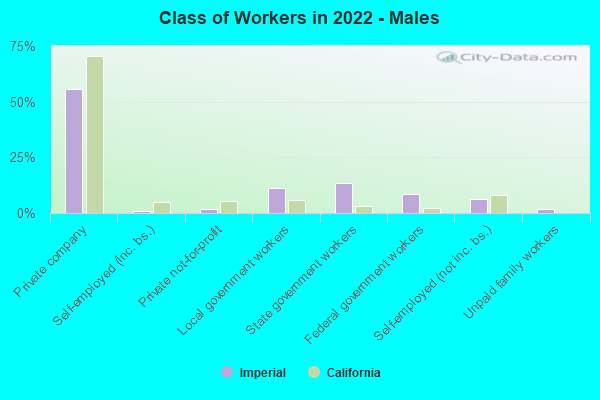
Employee of private company - Males:
| Imperial: | 55.9% (2,276) |
| California: | 70.3% (7,191,252) |
Self-employed in own incorporated business - Males:
| Imperial: | 0.8% (33) |
| California: | 4.9% (504,764) |
Private not-for-profit wage and salary workers - Males:
| Imperial: | 1.8% (75) |
| California: | 5.2% (529,122) |
Local government workers - Males:
| Imperial: | 11.3% (460) |
| California: | 6.0% (610,331) |
State government workers - Males:
| Imperial: | 13.7% (556) |
| California: | 3.4% (343,636) |
Federal government workers - Males:
| Imperial: | 8.5% (348) |
| California: | 2.1% (209,874) |
Self-employed workers in own not incorporated business - Males:
| Imperial: | 6.3% (258) |
| California: | 8.1% (824,359) |
Unpaid family workers - Males:
| Imperial: | 1.6% (65) |
| California: | 0.2% (17,922) |
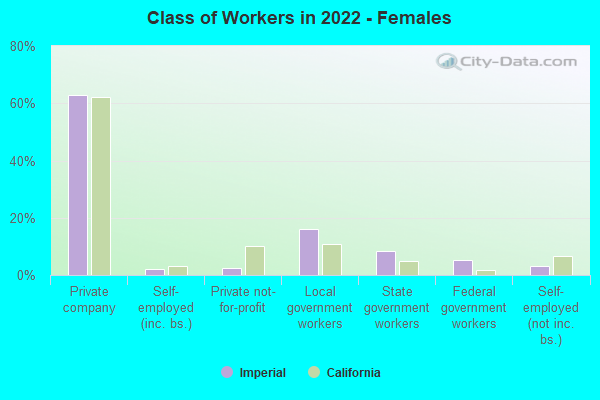
Employee of private company - Females:
| Imperial: | 63.0% (2,344) |
| California: | 62.0% (5,404,778) |
Self-employed in own incorporated business - Females:
| Imperial: | 2.1% (79) |
| California: | 3.2% (279,945) |
Private not-for-profit wage and salary workers - Females:
| Imperial: | 2.3% (86) |
| California: | 10.2% (888,285) |
Local government workers - Females:
| Imperial: | 16.0% (593) |
| California: | 10.8% (936,725) |
State government workers - Females:
| Imperial: | 8.5% (315) |
| California: | 5.0% (437,279) |
Federal government workers - Females:
| Imperial: | 5.1% (190) |
| California: | 1.8% (159,984) |
Self-employed workers in own not incorporated business - Females:
| Imperial: | 3.0% (111) |
| California: | 6.7% (586,376) |