Work and Jobs in Interlaken, California (CA) Detailed Stats
Occupations, Industries, Unemployment, Workers, Commute
Settings
X


Recent posts about work in Interlaken, California on our local forum with over 2,400,000 registered users:
 | Santa Rosa vs Santa Cruz (29 replies) |
| Where's my dream California city? (27 replies) |
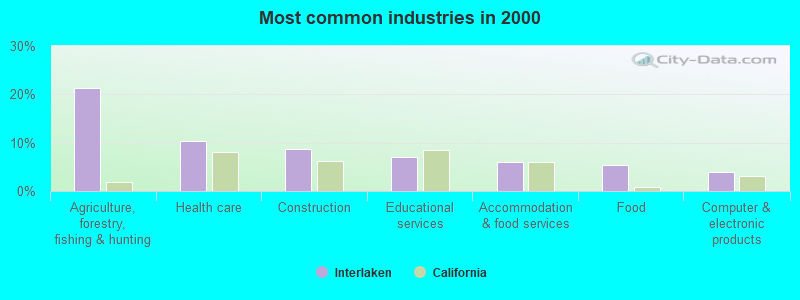
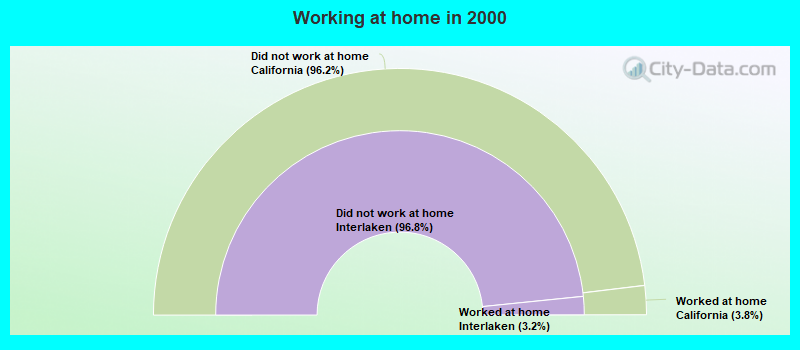
The most common industries in Interlaken are: Agriculture, forestry, fishing & hunting (21.3% of civilian employees), Health care (10.3% of civilian employees), Construction (8.7% of civilian employees). 84.9% of workers work in Santa Cruz County and 11.9% of all workers work at home. 63.1% of workers are employees of private companies, which is 5.3% less than the rate of 66.5% across the entire state of California.
Whole page based on the data from 2000 / 2022 when the population of Interlaken, California was 7,328 / 7,913
Whole page based on the data from 2000 / 2022 when the population of Interlaken, California was 7,328 / 7,913
Most common industries
Most common industries | |||
|---|---|---|---|
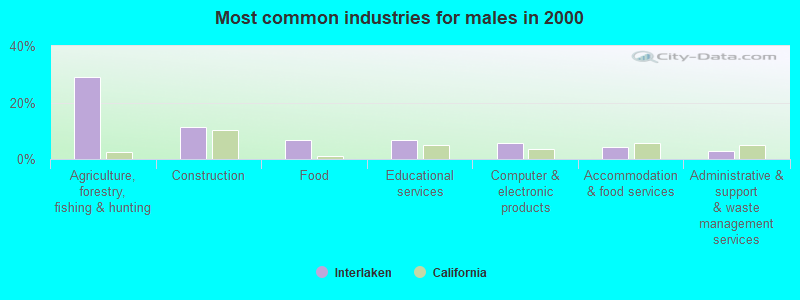
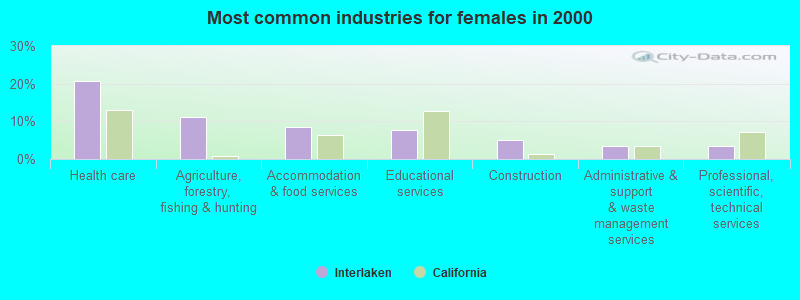
Industry | All | Males | Females |
| Agriculture, forestry, fishing and hunting | 21.3% (652) | 28.9% (509) | 11.0% (143) |
| Health care | 10.3% (316) | 2.6% (46) | 20.8% (270) |
| Construction | 8.7% (265) | 11.3% (200) | 5.0% (65) |
| Educational services | 7.1% (217) | 6.7% (118) | 7.6% (99) |
| Accommodation and food services | 6.0% (184) | 4.2% (74) | 8.5% (110) |
| Food | 5.3% (162) | 6.7% (119) | 3.3% (43) |
| Computer and electronic products | 4.0% (123) | 5.8% (102) | 1.6% (21) |
| Administrative and support and waste management services | 3.0% (92) | 2.7% (48) | 3.4% (44) |
| Professional, scientific, and technical services | 2.8% (86) | 2.4% (42) | 3.4% (44) |
| Food and beverage stores | 2.4% (72) | 2.0% (36) | 2.8% (36) |
| Public administration | 1.8% (54) | 1.8% (31) | 1.8% (23) |
| Groceries and related products merchant wholesalers | 1.8% (54) | 1.4% (24) | 2.3% (30) |
| Motor vehicle and parts dealers | 1.6% (50) | 2.4% (42) | 0.6% (8) |
| Repair and maintenance | 1.5% (46) | 2.6% (46) | 0.0% (0) |
| Miscellaneous manufacturing | 1.3% (41) | 0.0% (0) | 3.2% (41) |
| Truck transportation | 1.3% (40) | 1.2% (22) | 1.4% (18) |
| Building material and garden equipment and supplies dealers | 1.3% (39) | 1.6% (29) | 0.8% (10) |
| Department and other general merchandise stores | 1.3% (39) | 0.0% (0) | 3.0% (39) |
| Social assistance | 1.3% (39) | 0.0% (0) | 3.0% (39) |
| Arts, entertainment, and recreation | 1.2% (37) | 1.5% (26) | 0.8% (11) |
| Finance and insurance | 1.1% (35) | 0.9% (15) | 1.5% (20) |
| Miscellaneous nondurable goods merchant wholesalers | 1.1% (33) | 1.6% (28) | 0.4% (5) |
| Personal and laundry services | 0.8% (25) | 0.4% (7) | 1.4% (18) |
| Sporting goods, camera, and hobby and toy stores | 0.8% (24) | 1.4% (24) | 0.0% (0) |
| Utilities | 0.7% (22) | 1.2% (22) | 0.0% (0) |
| Publishing, and motion picture and sound recording industries | 0.7% (21) | 0.6% (10) | 0.8% (11) |
| Religious, grantmaking, civic, professional, and similar organizations | 0.7% (21) | 0.3% (5) | 1.2% (16) |
| Data processing, libraries, and other information services | 0.7% (20) | 0.6% (11) | 0.7% (9) |
| Radio, TV, and computer stores | 0.6% (19) | 0.5% (8) | 0.8% (11) |
| Paper and paper products merchant wholesalers | 0.6% (18) | 0.4% (7) | 0.8% (11) |
| Chemicals | 0.5% (16) | 0.3% (5) | 0.8% (11) |
| Electrical and electronic goods merchant wholesalers | 0.5% (16) | 0.3% (5) | 0.8% (11) |
| Private households | 0.5% (16) | 0.0% (0) | 1.2% (16) |
| Other transportation, and support activities, and couriers | 0.5% (16) | 0.4% (7) | 0.7% (9) |
| Real estate and rental and leasing | 0.5% (14) | 0.3% (6) | 0.6% (8) |
| Air transportation | 0.4% (13) | 0.2% (4) | 0.7% (9) |
| Gasoline stations | 0.4% (12) | 0.3% (5) | 0.5% (7) |
| Office supplies and stationery stores | 0.4% (11) | 0.0% (0) | 0.8% (11) |
| Clothing and accessories, including shoe, stores | 0.3% (9) | 0.0% (0) | 0.7% (9) |
| U. S. Postal service | 0.3% (9) | 0.5% (9) | 0.0% (0) |
| Nonmetallic mineral products | 0.3% (9) | 0.5% (9) | 0.0% (0) |
| Rail transportation | 0.3% (8) | 0.5% (8) | 0.0% (0) |
| Professional and commercial equipment and supplies merchant wholesalers | 0.3% (8) | 0.5% (8) | 0.0% (0) |
| Printing and related support activities | 0.3% (8) | 0.5% (8) | 0.0% (0) |
| Miscellaneous durable goods merchant wholesalers | 0.3% (8) | 0.0% (0) | 0.6% (8) |
| Beverage and tobacco products | 0.2% (7) | 0.4% (7) | 0.0% (0) |
| Metal and metal products | 0.2% (7) | 0.4% (7) | 0.0% (0) |
| Other direct selling establishments | 0.2% (7) | 0.4% (7) | 0.0% (0) |
| Fuel dealers | 0.2% (7) | 0.4% (7) | 0.0% (0) |
| Lumber and other construction materials merchant wholesalers | 0.2% (6) | 0.3% (6) | 0.0% (0) |
| Petroleum and petroleum products merchant wholesalers | 0.2% (5) | 0.3% (5) | 0.0% (0) |
| Retail florists | 0.1% (4) | 0.0% (0) | 0.3% (4) |
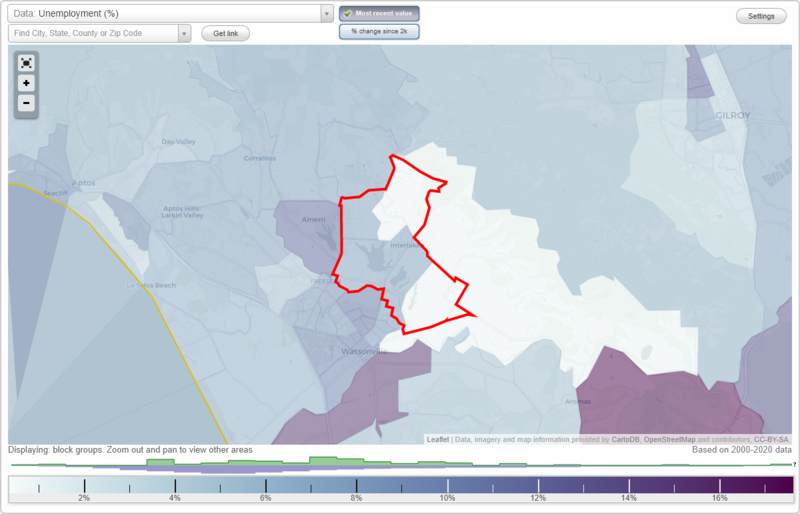
Unemployment in Interlaken
- Unemployment by race in 2022
- Unemployment rate for White non-Hispanic residents
- 8.1%Males
- 0.7%Females
- Unemployment rate for other race residents
- 6.6%Males
- Unemployment rate for two or more race residents
- 10.0%Males
- Unemployment rate for Hispanic or Latino residents
- 7.9%Males
- Unemployment by race in 2000
- Unemployment rate for White non-Hispanic residents
- 9.7%Males
- 1.4%Females
- Unemployment rate for American Indian and Alaska Native residents
- 21.6%Males
- Unemployment rate for other race residents
- 9.9%Males
- 27.7%Females
- Unemployment rate for two or more race residents
- 40.5%Males
- 13.6%Females
- Unemployment rate for Hispanic or Latino residents
- 12.5%Males
- 21.4%Females
Time leaving home to go to work
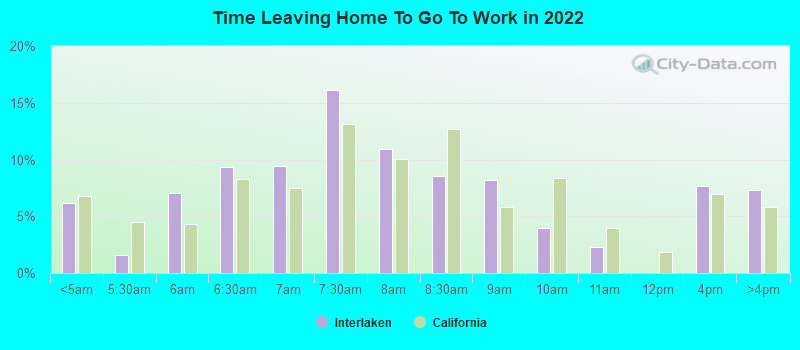
12:00 a.m. to 4:59 a.m.:
| Interlaken: | 6.1% (169) |
| California: | 6.8% (1,050,902) |
5:00 a.m. to 5:29 a.m.:
| Interlaken: | 1.6% (43) |
| California: | 4.5% (692,772) |
5:30 a.m. to 5:59 a.m.:
| Interlaken: | 7.0% (194) |
| California: | 4.3% (665,475) |
6:00 a.m. to 6:29 a.m.:
| Interlaken: | 9.3% (258) |
| California: | 8.3% (1,273,588) |
6:30 a.m. to 6:59 a.m.:
| Interlaken: | 9.4% (260) |
| California: | 7.5% (1,156,338) |
7:00 a.m. to 7:29 a.m.:
| Interlaken: | 16.1% (444) |
| California: | 13.2% (2,027,702) |
7:30 a.m. to 7:59 a.m.:
| Interlaken: | 10.9% (301) |
| California: | 10.1% (1,550,402) |
8:00 a.m. to 8:29 a.m.:
| Interlaken: | 8.5% (236) |
| California: | 12.7% (1,953,986) |
8:30 a.m. to 8:59 a.m.:
| Interlaken: | 8.2% (226) |
| California: | 5.8% (890,950) |
9:00 a.m. to 9:59 a.m.:
| Interlaken: | 4.0% (109) |
| California: | 8.4% (1,288,499) |
10:00 a.m. to 10:59 a.m.:
| Interlaken: | 2.3% (62) |
| California: | 4.0% (613,193) |
12:00 p.m. to 3:59 p.m.:
| Interlaken: | 7.7% (211) |
| California: | 7.0% (1,075,505) |
4:00 p.m. to 11:59 p.m.:
| Interlaken: | 7.3% (202) |
| California: | 5.8% (891,240) |
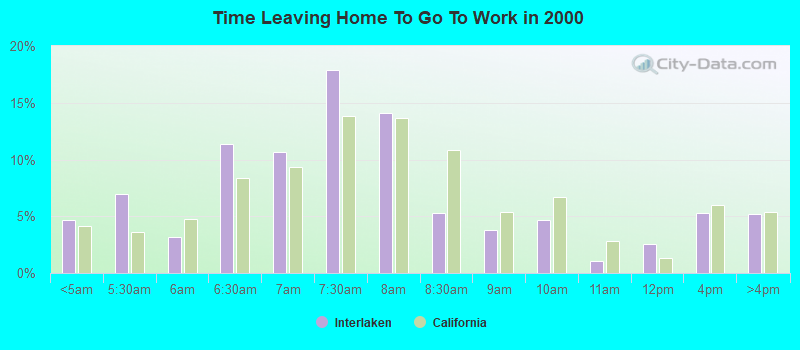
<5am:
| Interlaken: | 4.7% (138) |
| California: | 4.2% (606,086) |
5:30am:
| Interlaken: | 7.0% (205) |
| California: | 3.6% (523,209) |
6am:
| Interlaken: | 3.2% (94) |
| California: | 4.8% (692,256) |
6:30am:
| Interlaken: | 11.4% (336) |
| California: | 8.4% (1,216,867) |
7am:
| Interlaken: | 10.6% (313) |
| California: | 9.4% (1,362,830) |
7:30am:
| Interlaken: | 17.9% (527) |
| California: | 13.8% (2,006,950) |
8am:
| Interlaken: | 14.1% (416) |
| California: | 13.7% (1,986,831) |
8:30am:
| Interlaken: | 5.3% (157) |
| California: | 10.9% (1,577,815) |
9am:
| Interlaken: | 3.8% (111) |
| California: | 5.4% (778,152) |
10am:
| Interlaken: | 4.7% (138) |
| California: | 6.7% (972,355) |
11am:
| Interlaken: | 1.1% (32) |
| California: | 2.9% (414,479) |
12pm:
| Interlaken: | 2.5% (75) |
| California: | 1.3% (189,005) |
4pm:
| Interlaken: | 5.3% (156) |
| California: | 6.0% (865,284) |
>4pm:
| Interlaken: | 5.2% (153) |
| California: | 5.3% (776,167) |
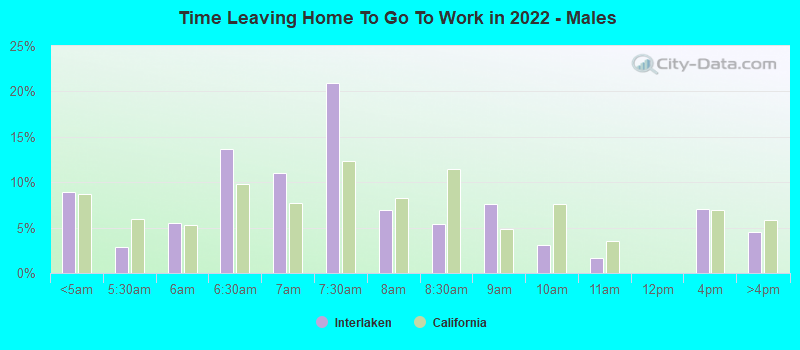
12:00 a.m. to 4:59 a.m. - Males:
| Interlaken: | 8.9% (132) |
| California: | 8.7% (747,612) |
5:00 a.m. to 5:29 a.m. - Males:
| Interlaken: | 2.9% (43) |
| California: | 6.0% (509,420) |
5:30 a.m. to 5:59 a.m. - Males:
| Interlaken: | 5.5% (82) |
| California: | 5.2% (448,269) |
6:00 a.m. to 6:29 a.m. - Males:
| Interlaken: | 13.6% (203) |
| California: | 9.8% (842,941) |
6:30 a.m. to 6:59 a.m. - Males:
| Interlaken: | 11.0% (164) |
| California: | 7.7% (657,557) |
7:00 a.m. to 7:29 a.m. - Males:
| Interlaken: | 21.0% (312) |
| California: | 12.4% (1,058,532) |
7:30 a.m. to 7:59 a.m. - Males:
| Interlaken: | 6.9% (103) |
| California: | 8.2% (702,727) |
8:00 a.m. to 8:29 a.m. - Males:
| Interlaken: | 5.4% (80) |
| California: | 11.5% (984,538) |
8:30 a.m. to 8:59 a.m. - Males:
| Interlaken: | 7.7% (114) |
| California: | 4.8% (414,815) |
9:00 a.m. to 9:59 a.m. - Males:
| Interlaken: | 3.1% (46) |
| California: | 7.7% (655,038) |
10:00 a.m. to 10:59 a.m. - Males:
| Interlaken: | 1.6% (24) |
| California: | 3.5% (301,425) |
12:00 p.m. to 3:59 p.m. - Males:
| Interlaken: | 7.0% (104) |
| California: | 7.0% (594,847) |
4:00 p.m. to 11:59 p.m. - Males:
| Interlaken: | 4.5% (68) |
| California: | 5.8% (499,471) |
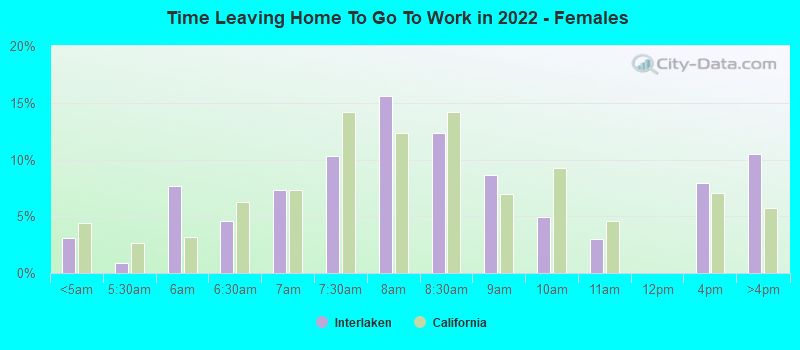
12:00 a.m. to 4:59 a.m. - Females:
| Interlaken: | 3.1% (39) |
| California: | 4.4% (303,290) |
5:00 a.m. to 5:29 a.m. - Females:
| Interlaken: | 0.9% (11) |
| California: | 2.7% (183,352) |
5:30 a.m. to 5:59 a.m. - Females:
| Interlaken: | 7.7% (97) |
| California: | 3.2% (217,206) |
6:00 a.m. to 6:29 a.m. - Females:
| Interlaken: | 4.6% (59) |
| California: | 6.3% (430,647) |
6:30 a.m. to 6:59 a.m. - Females:
| Interlaken: | 7.3% (93) |
| California: | 7.3% (498,781) |
7:00 a.m. to 7:29 a.m. - Females:
| Interlaken: | 10.3% (131) |
| California: | 14.1% (969,170) |
7:30 a.m. to 7:59 a.m. - Females:
| Interlaken: | 15.6% (198) |
| California: | 12.4% (847,675) |
8:00 a.m. to 8:29 a.m. - Females:
| Interlaken: | 12.3% (157) |
| California: | 14.1% (969,448) |
8:30 a.m. to 8:59 a.m. - Females:
| Interlaken: | 8.6% (110) |
| California: | 6.9% (476,135) |
9:00 a.m. to 9:59 a.m. - Females:
| Interlaken: | 4.9% (63) |
| California: | 9.2% (633,461) |
10:00 a.m. to 10:59 a.m. - Females:
| Interlaken: | 3.0% (38) |
| California: | 4.5% (311,768) |
12:00 p.m. to 3:59 p.m. - Females:
| Interlaken: | 8.0% (101) |
| California: | 7.0% (480,658) |
4:00 p.m. to 11:59 p.m. - Females:
| Interlaken: | 10.4% (133) |
| California: | 5.7% (391,769) |
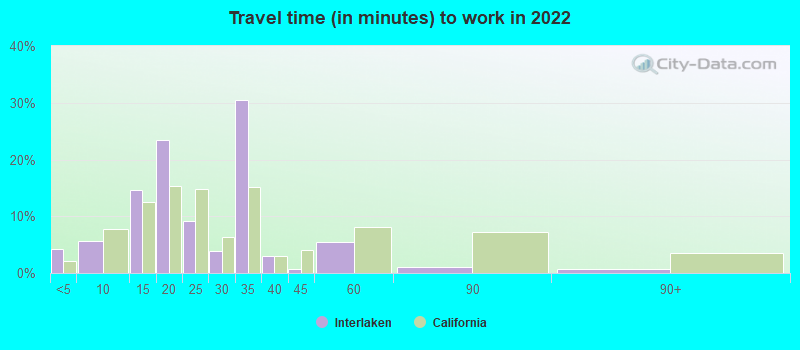
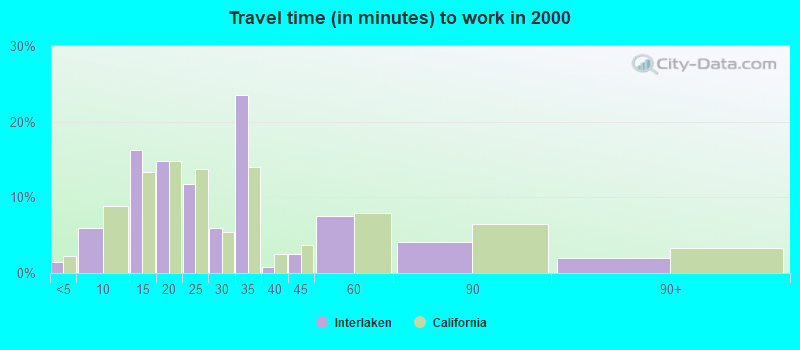
Travel time to work
Percentage of workers working in this county: 84.9%
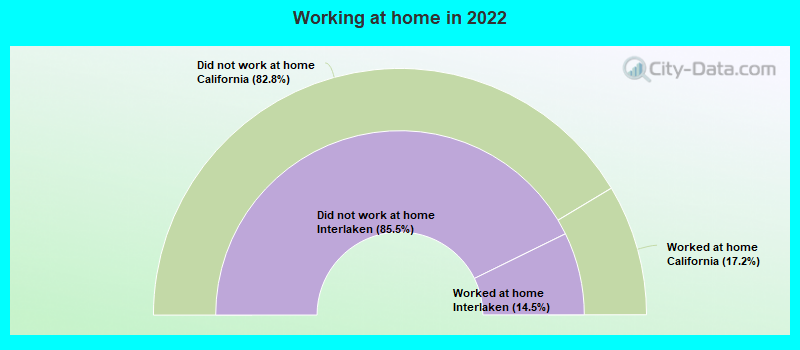
Number of people working at home: 388 (11.9% of all workers)
Daytime population change due to commuting: -1,797 (-24.5%)
Workers who live and work in this place: 321 (10.9%)
Number of people working at home: 388 (11.9% of all workers)
Daytime population change due to commuting: -1,797 (-24.5%)
Workers who live and work in this place: 321 (10.9%)
Less than 5 minutes:
| Interlaken: | 4.1% (65) |
| California: | 2.1% (323,064) |
5 to 9 minutes:
| Interlaken: | 5.6% (88) |
| California: | 7.8% (1,208,682) |
10 to 14 minutes:
| Interlaken: | 14.5% (229) |
| California: | 12.4% (1,917,610) |
15 to 19 minutes:
| Interlaken: | 23.5% (370) |
| California: | 15.3% (2,367,483) |
20 to 24 minutes:
| Interlaken: | 9.1% (143) |
| California: | 14.8% (2,279,693) |
25 to 29 minutes:
| Interlaken: | 3.8% (60) |
| California: | 6.4% (981,997) |
30 to 34 minutes:
| Interlaken: | 30.5% (479) |
| California: | 15.2% (2,339,223) |
35 to 39 minutes:
| Interlaken: | 2.9% (46) |
| California: | 2.9% (453,226) |
40 to 44 minutes:
| Interlaken: | 0.8% (12) |
| California: | 4.1% (637,781) |
45 to 59 minutes:
| Interlaken: | 5.5% (87) |
| California: | 8.2% (1,259,482) |
60 to 89 minutes:
| Interlaken: | 1.0% (16) |
| California: | 7.2% (1,111,698) |
90 or more minutes:
| Interlaken: | 0.7% (10) |
| California: | 3.6% (552,805) |
Less than 5 minutes:
| Interlaken: | 1.4% (41) |
| California: | 2.2% (324,703) |
5 to 9 minutes:
| Interlaken: | 5.9% (175) |
| California: | 8.8% (1,280,443) |
10 to 14 minutes:
| Interlaken: | 16.3% (479) |
| California: | 13.3% (1,930,263) |
15 to 19 minutes:
| Interlaken: | 14.8% (436) |
| California: | 14.9% (2,157,970) |
20 to 24 minutes:
| Interlaken: | 11.8% (348) |
| California: | 13.8% (2,004,060) |
25 to 29 minutes:
| Interlaken: | 6.0% (177) |
| California: | 5.4% (782,241) |
30 to 34 minutes:
| Interlaken: | 23.6% (695) |
| California: | 13.9% (2,025,657) |
35 to 39 minutes:
| Interlaken: | 0.8% (24) |
| California: | 2.5% (366,487) |
40 to 44 minutes:
| Interlaken: | 2.5% (75) |
| California: | 3.6% (528,043) |
45 to 59 minutes:
| Interlaken: | 7.6% (223) |
| California: | 7.9% (1,151,598) |
60 to 89 minutes:
| Interlaken: | 4.1% (120) |
| California: | 6.4% (933,123) |
90 or more minutes:
| Interlaken: | 2.0% (58) |
| California: | 3.3% (483,698) |
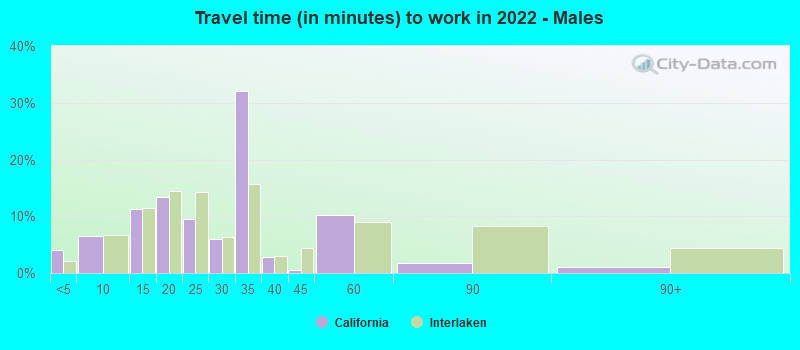
Less than 5 minutes - Males:
| Interlaken: | 4.1% (38) |
| California: | 2.0% (173,603) |
5 to 9 minutes - Males:
| Interlaken: | 6.4% (59) |
| California: | 6.8% (580,822) |
10 to 14 minutes - Males:
| Interlaken: | 11.3% (103) |
| California: | 11.4% (974,497) |
15 to 19 minutes - Males:
| Interlaken: | 13.5% (123) |
| California: | 14.5% (1,239,386) |
20 to 24 minutes - Males:
| Interlaken: | 9.5% (87) |
| California: | 14.3% (1,223,429) |
25 to 29 minutes - Males:
| Interlaken: | 6.0% (55) |
| California: | 6.4% (545,844) |
30 to 34 minutes - Males:
| Interlaken: | 32.1% (293) |
| California: | 15.8% (1,352,210) |
35 to 39 minutes - Males:
| Interlaken: | 2.8% (26) |
| California: | 3.0% (253,732) |
40 to 44 minutes - Males:
| Interlaken: | 0.5% (4) |
| California: | 4.4% (376,144) |
45 to 59 minutes - Males:
| Interlaken: | 10.2% (93) |
| California: | 8.9% (762,659) |
60 to 89 minutes - Males:
| Interlaken: | 1.7% (16) |
| California: | 8.3% (711,394) |
90 or more minutes - Males:
| Interlaken: | 1.0% (9) |
| California: | 4.4% (378,954) |
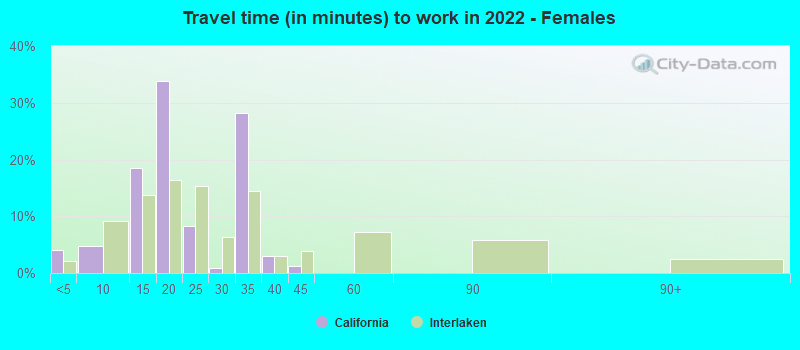
Less than 5 minutes - Females:
| Interlaken: | 4.1% (27) |
| California: | 2.2% (149,461) |
5 to 9 minutes - Females:
| Interlaken: | 4.8% (32) |
| California: | 9.2% (627,860) |
10 to 14 minutes - Females:
| Interlaken: | 18.5% (122) |
| California: | 13.7% (943,113) |
15 to 19 minutes - Females:
| Interlaken: | 33.8% (223) |
| California: | 16.4% (1,128,097) |
20 to 24 minutes - Females:
| Interlaken: | 8.3% (55) |
| California: | 15.4% (1,056,264) |
25 to 29 minutes - Females:
| Interlaken: | 0.9% (6) |
| California: | 6.4% (436,153) |
30 to 34 minutes - Females:
| Interlaken: | 28.3% (186) |
| California: | 14.4% (987,013) |
35 to 39 minutes - Females:
| Interlaken: | 3.1% (20) |
| California: | 2.9% (199,494) |
40 to 44 minutes - Females:
| Interlaken: | 1.2% (8) |
| California: | 3.8% (261,637) |
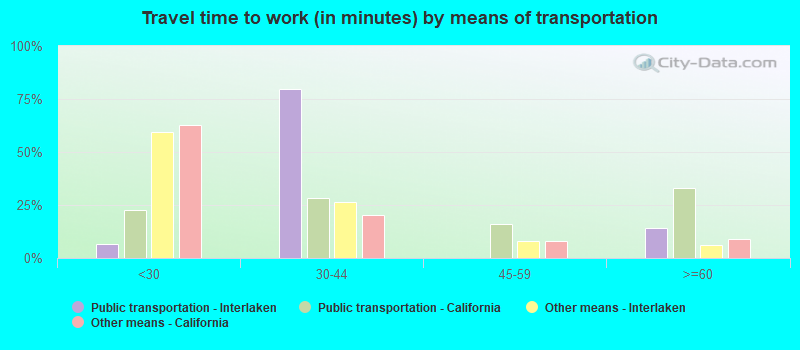
Means of transportation to work
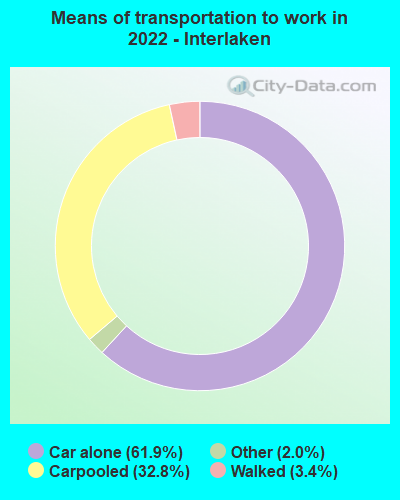

Drove car alone:
| Interlaken: | 61.9% (1,018) |
| California: | 79.1% (5,345,368) |
Carpooled:
| Interlaken: | 32.8% (539) |
| California: | 11.9% (878,699) |
Walked:
| Interlaken: | 3.4% (55) |
| California: | 2.9% (218,374) |
Other means:
| Interlaken: | 2.0% (33) |
| California: | 2.1% (137,489) |
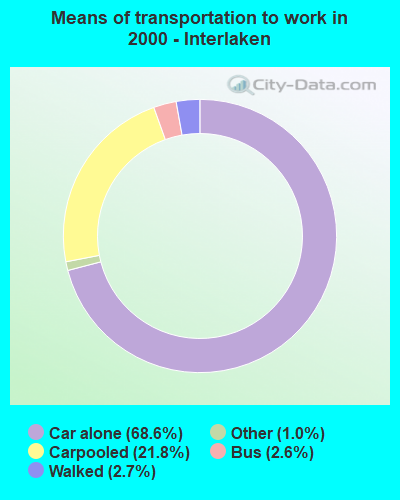

Drove car alone:
| Interlaken: | 68.6% (2,021) |
| California: | 71.8% (10,432,462) |
Carpooled:
| Interlaken: | 21.8% (642) |
| California: | 14.5% (2,113,313) |
Bus or trolley bus:
| Interlaken: | 2.6% (78) |
| California: | 3.8% (549,425) |
Walked:
| Interlaken: | 2.7% (81) |
| California: | 2.9% (414,581) |
Other means:
| Interlaken: | 1.0% (29) |
| California: | 0.8% (115,064) |
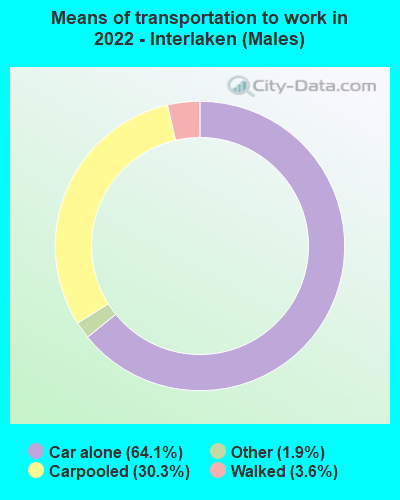

Drove car alone - Males:
| Interlaken: | 64.1% (611) |
| California: | 80.0% (5,345,368) |
Carpooled - Males:
| Interlaken: | 30.3% (289) |
| California: | 11.1% (878,699) |
Walked - Males:
| Interlaken: | 3.6% (35) |
| California: | 2.7% (218,374) |
Other means - Males:
| Interlaken: | 1.9% (18) |
| California: | 2.1% (137,489) |
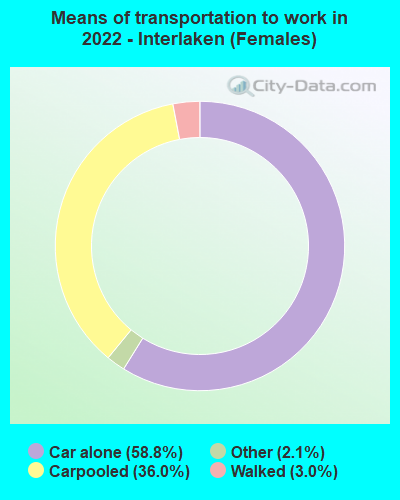

Drove car alone - Females:
| Interlaken: | 58.8% (408) |
| California: | 77.9% (5,345,368) |
Carpooled - Females:
| Interlaken: | 36.0% (250) |
| California: | 12.8% (878,699) |
Walked - Females:
| Interlaken: | 3.0% (21) |
| California: | 3.2% (218,374) |
Other means - Females:
| Interlaken: | 2.1% (15) |
| California: | 2.0% (137,489) |
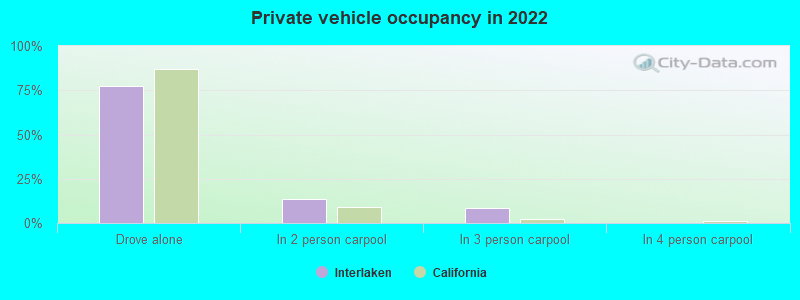
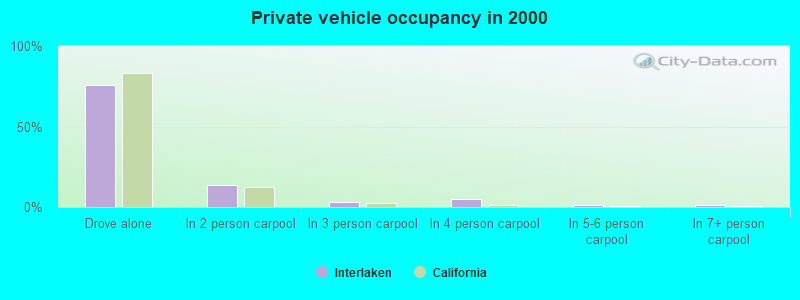
Private vehicle occupancy
Drove alone:
| Interlaken: | 77.3% (1,883) |
| California: | 86.9% (12,187,486) |
In 2 person carpool:
| Interlaken: | 13.3% (325) |
| California: | 9.2% (1,295,561) |
In 3 person carpool:
| Interlaken: | 8.2% (200) |
| California: | 2.2% (309,969) |
Drove alone:
| Interlaken: | 75.9% (2,021) |
| California: | 83.2% (10,432,462) |
In 2 person carpool:
| Interlaken: | 13.4% (357) |
| California: | 12.5% (1,564,905) |
In 3 person carpool:
| Interlaken: | 3.0% (81) |
| California: | 2.6% (330,732) |
In 4 person carpool:
| Interlaken: | 5.2% (138) |
| California: | 1.0% (119,364) |
In 5-6 person carpool:
| Interlaken: | 1.1% (30) |
| California: | 0.5% (57,036) |
In 7+ person carpool:
| Interlaken: | 1.4% (36) |
| California: | 0.3% (41,276) |
Class of workers
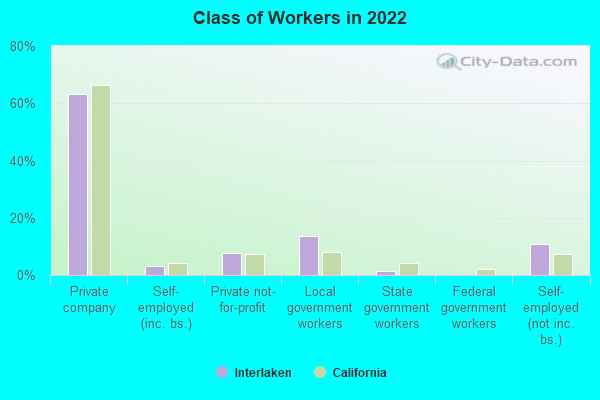
Employee of private company:
| Interlaken: | 63.1% (2,183) |
| California: | 66.5% (12,596,030) |
Self-employed in own incorporated business:
| Interlaken: | 3.2% (112) |
| California: | 4.1% (784,709) |
Private not-for-profit wage and salary workers:
| Interlaken: | 7.7% (266) |
| California: | 7.5% (1,417,407) |
Local government workers:
| Interlaken: | 13.6% (471) |
| California: | 8.2% (1,547,056) |
State government workers:
| Interlaken: | 1.5% (53) |
| California: | 4.1% (780,915) |
Self-employed workers in own not incorporated business:
| Interlaken: | 10.8% (373) |
| California: | 7.4% (1,410,735) |
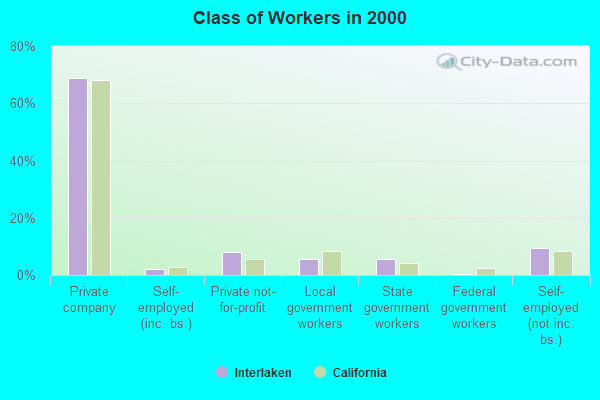
Employee of private company:
| Interlaken: | 69.0% (2,112) |
| California: | 68.0% (10,009,465) |
Self-employed in own incorporated business:
| Interlaken: | 2.2% (67) |
| California: | 2.7% (402,392) |
Private not-for-profit wage and salary workers:
| Interlaken: | 7.9% (241) |
| California: | 5.7% (845,536) |
Local government workers:
| Interlaken: | 5.6% (172) |
| California: | 8.3% (1,218,764) |
State government workers:
| Interlaken: | 5.5% (168) |
| California: | 4.0% (594,953) |
Federal government workers:
| Interlaken: | 0.3% (9) |
| California: | 2.3% (344,354) |
Self-employed workers in own not incorporated business:
| Interlaken: | 9.3% (286) |
| California: | 8.5% (1,249,530) |
Unpaid family workers:
| Interlaken: | 0.2% (7) |
| California: | 0.4% (53,934) |
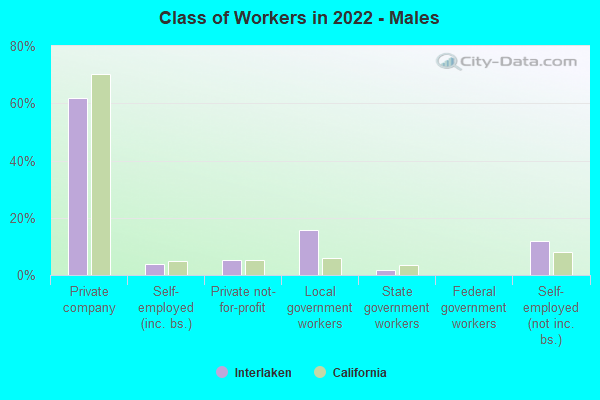
Employee of private company - Males:
| Interlaken: | 61.7% (1,147) |
| California: | 70.3% (7,191,252) |
Self-employed in own incorporated business - Males:
| Interlaken: | 4.0% (74) |
| California: | 4.9% (504,764) |
Private not-for-profit wage and salary workers - Males:
| Interlaken: | 5.1% (94) |
| California: | 5.2% (529,122) |
Local government workers - Males:
| Interlaken: | 15.7% (292) |
| California: | 6.0% (610,331) |
State government workers - Males:
| Interlaken: | 1.8% (33) |
| California: | 3.4% (343,636) |
Self-employed workers in own not incorporated business - Males:
| Interlaken: | 11.7% (218) |
| California: | 8.1% (824,359) |
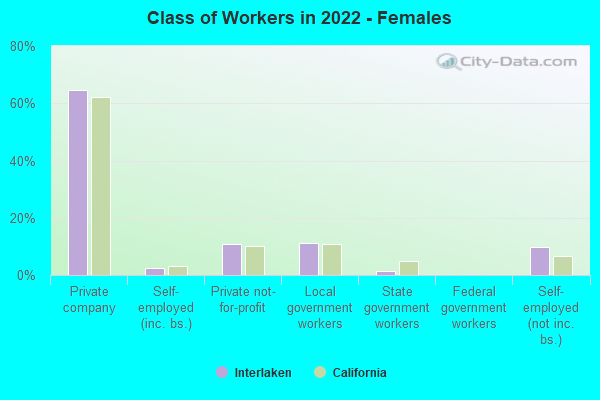
Employee of private company - Females:
| Interlaken: | 64.8% (1,035) |
| California: | 62.0% (5,404,778) |
Self-employed in own incorporated business - Females:
| Interlaken: | 2.4% (38) |
| California: | 3.2% (279,945) |
Private not-for-profit wage and salary workers - Females:
| Interlaken: | 10.8% (172) |
| California: | 10.2% (888,285) |
Local government workers - Females:
| Interlaken: | 11.2% (179) |
| California: | 10.8% (936,725) |
State government workers - Females:
| Interlaken: | 1.2% (20) |
| California: | 5.0% (437,279) |
Self-employed workers in own not incorporated business - Females:
| Interlaken: | 9.7% (154) |
| California: | 6.7% (586,376) |