Work and Jobs in Iola, Texas (TX) Detailed Stats
Data:
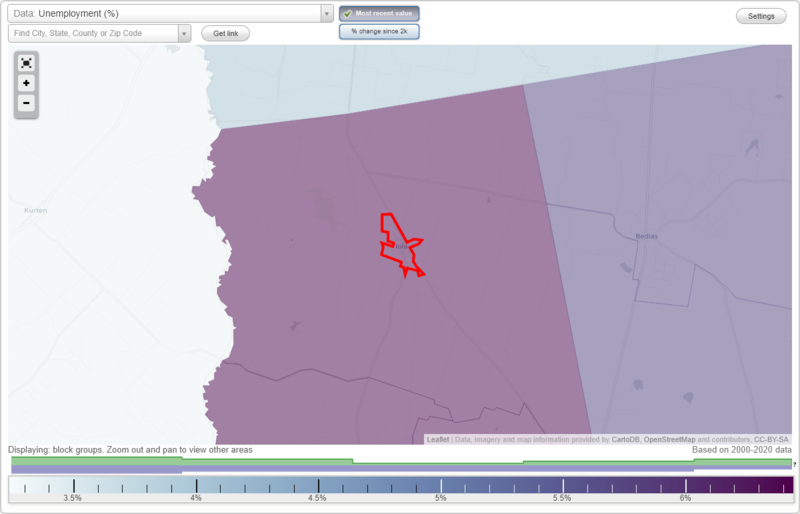
Unemployment (%)
Unemployment (% change since 2000)
Unemployment (%) - White
Unemployment (% change since 2000) - White
Unemployment (%) - Black or African American
Unemployment (% change since 2000) - Black or African American
Unemployment (%) - Asian
Unemployment (% change since 2000) - Asian
Unemployment (%) - Hispanic or Latino
Unemployment (% change since 2000) - Hispanic or Latino
Unemployment (%) - American Indian and Alaska Native
Unemployment (% change since 2000) - American Indian and Alaska Native
Unemployment (%) - Multirace
Unemployment (% change since 2000) - Multirace
Unemployment (%) - Other Race
Unemployment (% change since 2000) - Other Race
Industry diversity
Most Common Industries - Agriculture, forestry, fishing and hunting, and mining (%)
Most Common Industries - Agriculture, forestry, fishing and hunting (%)
Most Common Industries - Mining, quarrying, and oil and gas extraction (%)
Most Common Industries - Construction (%)
Most Common Industries - Manufacturing (%)
Most Common Industries - Wholesale trade (%)
Most Common Industries - Retail trade (%)
Most Common Industries - Transportation and warehousing, and utilities (%)
Most Common Industries - Transportation and warehousing (%)
Most Common Industries - Utilities (%)
Most Common Industries - Information (%)
Most Common Industries - Finance and insurance, and real estate and rental and leasing (%)
Most Common Industries - Finance and insurance (%)
Most Common Industries - Real estate and rental and leasing (%)
Most Common Industries - Professional, scientific, and management, and administrative and waste management services (%)
Most Common Industries - Professional, scientific, and technical services (%)
Most Common Industries - Management of companies and enterprises (%)
Most Common Industries - Administrative and support and waste management services (%)
Most Common Industries - Educational services, and health care and social assistance (%)
Most Common Industries - Educational services (%)
Most Common Industries - Health care and social assistance (%)
Most Common Industries - Arts, entertainment, and recreation, and accommodation and food services (%)
Most Common Industries - Arts, entertainment, and recreation (%)
Most Common Industries - Accommodation and food services (%)
Most Common Industries - Other services, except public administration (%)
Most Common Industries - Public administration (%)
Occupation diversity
Most Common Occupations - Management, business, science, and arts occupations (%)
Most Common Occupations - Management, business, and financial occupations (%)
Most Common Occupations - Management occupations (%)
Most Common Occupations - Business and financial operations occupations (%)
Most Common Occupations - Computer, engineering, and science occupations (%)
Most Common Occupations - Computer and mathematical occupations (%)
Most Common Occupations - Architecture and engineering occupations (%)
Most Common Occupations - Life, physical, and social science occupations (%)
Most Common Occupations - Education, legal, community service, arts, and media occupations (%)
Most Common Occupations - Community and social service occupations (%)
Most Common Occupations - Legal occupations (%)
Most Common Occupations - Education, training, and library occupations (%)
Most Common Occupations - Arts, design, entertainment, sports, and media occupations (%)
Most Common Occupations - Healthcare practitioners and technical occupations (%)
Most Common Occupations - Health diagnosing and treating practitioners and other technical occupations (%)
Most Common Occupations - Health technologists and technicians (%)
Most Common Occupations - Service occupations (%)
Most Common Occupations - Healthcare support occupations (%)
Most Common Occupations - Protective service occupations (%)
Most Common Occupations - Fire fighting and prevention, and other protective service workers including supervisors (%)
Most Common Occupations - Law enforcement workers including supervisors (%)
Most Common Occupations - Food preparation and serving related occupations (%)
Most Common Occupations - Building and grounds cleaning and maintenance occupations (%)
Most Common Occupations - Personal care and service occupations (%)
Most Common Occupations - Sales and office occupations (%)
Most Common Occupations - Sales and related occupations (%)
Most Common Occupations - Office and administrative support occupations (%)
Most Common Occupations - Natural resources, construction, and maintenance occupations (%)
Most Common Occupations - Farming, fishing, and forestry occupations (%)
Most Common Occupations - Construction and extraction occupations (%)
Most Common Occupations - Installation, maintenance, and repair occupations (%)
Most Common Occupations - Production, transportation, and material moving occupations (%)
Most Common Occupations - Production occupations (%)
Most Common Occupations - Transportation occupations (%)
Most Common Occupations - Material moving occupations (%)
Private vehicle occupancy - Drove alone (% change since 2000)
Private vehicle occupancy - Carpooled (%)
Private vehicle occupancy - Carpooled (% change since 2000)
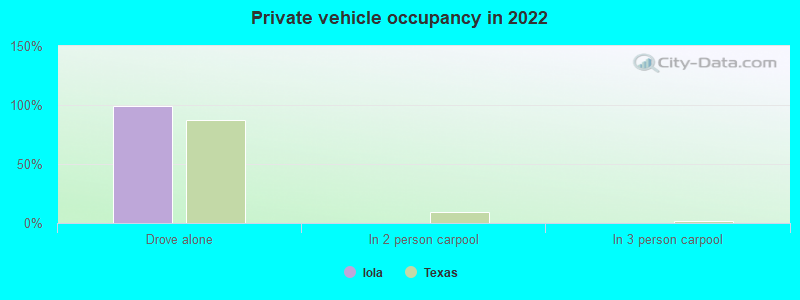
Private vehicle occupancy - In 2-person carpool (%)
Private vehicle occupancy - In 2-person carpool (% change since 2000)
Private vehicle occupancy - In 3-person carpool (%)
Private vehicle occupancy - In 3-person carpool (% change since 2000)
Private vehicle occupancy - In 4-person carpool (%)
Private vehicle occupancy - In 4-person carpool (% change since 2000)
Private vehicle occupancy - In 5- or 6-person carpool (%)
Private vehicle occupancy - In 5- or 6-person carpool (% change since 2000)
Private vehicle occupancy - In 7-or-more-person carpool (%)
Private vehicle occupancy - In 7-or-more-person carpool (% change since 2000)
Time Leaving Home To Go To Work - 12:00 a.m. to 4:59 a.m. (%)
Time Leaving Home To Go To Work - 12:00 a.m. to 4:59 a.m. (% change since 2000)
Time Leaving Home To Go To Work - 5:00 a.m. to 5:59 a.m. (%)
Time Leaving Home To Go To Work - 5:00 a.m. to 5:59 a.m. (% change since 2000)
Time Leaving Home To Go To Work - 6:00 a.m. to 6:59 a.m. (%)
Time Leaving Home To Go To Work - 6:00 a.m. to 6:59 a.m. (% change since 2000)
Time Leaving Home To Go To Work - 7:00 a.m. to 7:59 a.m. (%)
Time Leaving Home To Go To Work - 7:00 a.m. to 7:59 a.m. (% change since 2000)
Time Leaving Home To Go To Work - 8:00 a.m. to 8:59 a.m. (%)
Time Leaving Home To Go To Work - 8:00 a.m. to 8:59 a.m. (% change since 2000)
Time Leaving Home To Go To Work - 9:00 a.m. to 9:59 a.m. (%)
Time Leaving Home To Go To Work - 9:00 a.m. to 9:59 a.m. (% change since 2000)
Time Leaving Home To Go To Work - 10:00 a.m. to 10:59 a.m. (%)
Time Leaving Home To Go To Work - 10:00 a.m. to 10:59 a.m. (% change since 2000)
Time Leaving Home To Go To Work - 11:00 a.m. to 11:59 a.m. (%)
Time Leaving Home To Go To Work - 11:00 a.m. to 11:59 a.m. (% change since 2000)
Time Leaving Home To Go To Work - 12:00 p.m. to 3:59 p.m. (%)
Time Leaving Home To Go To Work - 12:00 p.m. to 3:59 p.m. (% change since 2000)
Time Leaving Home To Go To Work - 4:00 p.m. to 11:59 p.m. (%)
Time Leaving Home To Go To Work - 4:00 p.m. to 11:59 p.m. (% change since 2000)
Class of Workers - Employee of private company (%)
Class of Workers - Employee of private company (% change since 2000)
Class of Workers - Self-employed in own incorporated business (%)
Class of Workers - Self-employed in own incorporated business (% change since 2000)
Class of Workers - Private not-for-profit wage and salary workers (%)
Class of Workers - Private not-for-profit wage and salary workers (% change since 2000)
Class of Workers - Local government workers (%)
Class of Workers - Local government workers (% change since 2000)
Class of Workers - State government workers (%)
Class of Workers - State government workers (% change since 2000)
Class of Workers - Federal government workers (%)
Class of Workers - Federal government workers (% change since 2000)
Class of Workers - Self-employed workers in own not incorporated business and Unpaid family workers (%)
Class of Workers - Self-employed workers in own not incorporated business and Unpaid family workers (% change since 2000)
Means of transportation to work - Drove car alone (%)
Means of transportation to work - Drove car alone (% change since 2000)
Means of transportation to work - Carpooled (%)
Means of transportation to work - Carpooled (% change since 2000)
Means of transportation to work - Public transportation (%)
Means of transportation to work - Public transportation (% change since 2000)
Means of transportation to work - Bus or trolley bus (%)
Means of transportation to work - Bus or trolley bus (% change since 2000)
Means of transportation to work - Streetcar or trolley car (%)
Means of transportation to work - Streetcar or trolley car (% change since 2000)
Means of transportation to work - Subway or elevated (%)
Means of transportation to work - Subway or elevated (% change since 2000)
Means of transportation to work - Railroad (%)
Means of transportation to work - Railroad (% change since 2000)
Means of transportation to work - Ferryboat (%)
Means of transportation to work - Ferryboat (% change since 2000)
Means of transportation to work - Taxicab (%)
Means of transportation to work - Taxicab (% change since 2000)
Means of transportation to work - Motorcycle (%)
Means of transportation to work - Motorcycle (% change since 2000)
Means of transportation to work - Bicycle (%)
Means of transportation to work - Bicycle (% change since 2000)
Means of transportation to work - Walked (%)
Means of transportation to work - Walked (% change since 2000)
Means of transportation to work - Other means (%)
Means of transportation to work - Other means (% change since 2000)
Working at home (%)
Working at home (% change since 2000)
Travel time to work - Less than 5 minutes (%)
Travel time to work - Less than 5 minutes (% change since 2000)
Travel time to work - 5 to 9 minutes (%)
Travel time to work - 5 to 9 minutes (% change since 2000)
Travel time to work - 10 to 19 minutes (%)
Travel time to work - 10 to 19 minutes (% change since 2000)
Travel time to work - 20 to 29 minutes (%)
Travel time to work - 20 to 29 minutes (% change since 2000)
Travel time to work - 30 to 39 minutes (%)
Travel time to work - 30 to 39 minutes (% change since 2000)
Travel time to work - 40 to 59 minutes (%)
Travel time to work - 40 to 59 minutes (% change since 2000)
Travel time to work - 60 to 89 minutes (%)
Travel time to work - 60 to 89 minutes (% change since 2000)
Travel time to work - 90 or more minutes (%)
Travel time to work - 90 or more minutes (% change since 2000)
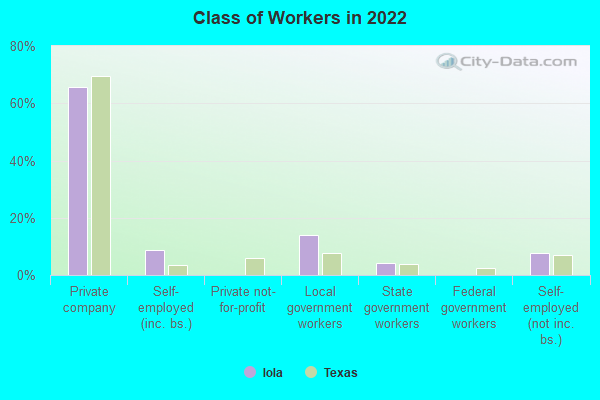
36.0% of workers work in Grimes County and 1.1% of all workers work at home. 65.6% of workers are employees of private companies, which is 6.0% less than the rate of 69.6% across the entire state of Texas.
Whole page based on the data from 2000 / 2022 when the population of Iola, Texas was 401 / 266
Unemployment in Iola Unemployment by race in 2022
Unemployment rate for White non-Hispanic residents 19.5% Males7.0% FemalesUnemployment rate for American Indian and Alaska Native residents 100.0% FemalesUnemployment rate for Hispanic or Latino residents 33.6% Females
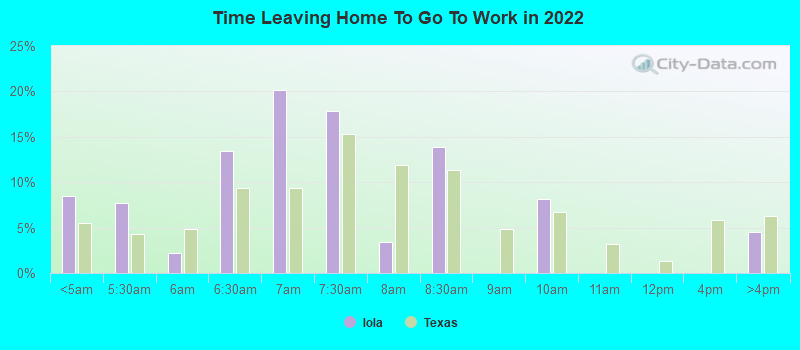
Time leaving home to go to work 12:00 a.m. to 4:59 a.m.: Iola:
8.4% (7)Texas:
5.5% (678,264)
5:00 a.m. to 5:29 a.m.: Iola:
7.7% (7)Texas:
4.3% (525,841)
5:30 a.m. to 5:59 a.m.: Iola:
2.2% (2)Texas:
4.9% (603,953)
6:00 a.m. to 6:29 a.m.: Iola:
13.4% (12)Texas:
9.4% (1,155,020)
6:30 a.m. to 6:59 a.m.: Iola:
20.2% (18)Texas:
9.3% (1,152,822)
7:00 a.m. to 7:29 a.m.: Iola:
17.9% (16)Texas:
15.3% (1,885,477)
7:30 a.m. to 7:59 a.m.: Iola:
3.4% (3)Texas:
11.9% (1,469,628)
8:00 a.m. to 8:29 a.m.: Iola:
13.9% (12)Texas:
11.3% (1,400,175)
9:00 a.m. to 9:59 a.m.: Iola:
8.2% (7)Texas:
6.7% (829,367)
4:00 p.m. to 11:59 p.m.: Iola:
4.6% (4)Texas:
6.3% (777,072)
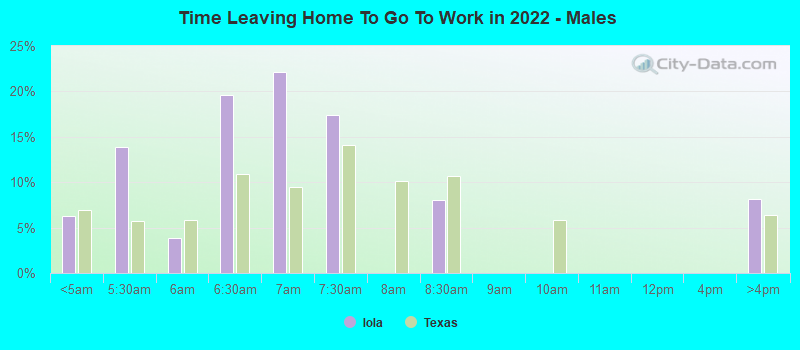
12:00 a.m. to 4:59 a.m. - Males: Iola:
6.3% (3)Texas:
7.0% (477,284)
5:00 a.m. to 5:29 a.m. - Males: Iola:
13.9% (7)Texas:
5.8% (394,876)
5:30 a.m. to 5:59 a.m. - Males: Iola:
3.9% (2)Texas:
5.9% (402,788)
6:00 a.m. to 6:29 a.m. - Males: Iola:
19.6% (10)Texas:
10.9% (751,118)
6:30 a.m. to 6:59 a.m. - Males: Iola:
22.2% (11)Texas:
9.5% (652,306)
7:00 a.m. to 7:29 a.m. - Males: Iola:
17.4% (9)Texas:
14.1% (970,598)
8:00 a.m. to 8:29 a.m. - Males: Iola:
8.1% (4)Texas:
10.6% (729,041)
4:00 p.m. to 11:59 p.m. - Males: Iola:
8.2% (4)Texas:
6.4% (435,950)
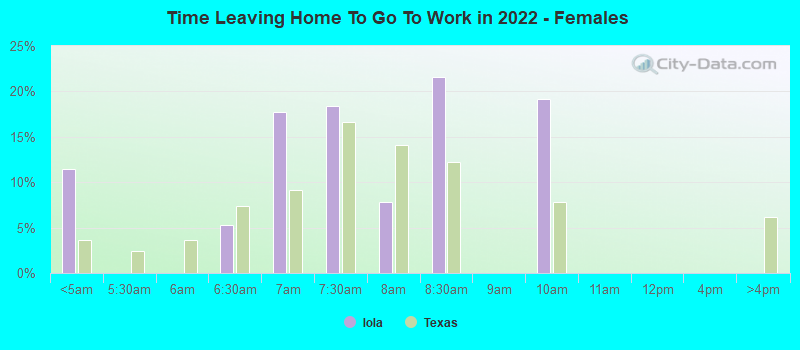
12:00 a.m. to 4:59 a.m. - Females: Iola:
11.4% (4)Texas:
3.7% (200,980)
6:00 a.m. to 6:29 a.m. - Females: Iola:
5.2% (2)Texas:
7.4% (403,902)
6:30 a.m. to 6:59 a.m. - Females: Iola:
17.7% (7)Texas:
9.1% (500,516)
7:00 a.m. to 7:29 a.m. - Females: Iola:
18.4% (7)Texas:
16.7% (914,879)
7:30 a.m. to 7:59 a.m. - Females: Iola:
7.9% (3)Texas:
14.1% (773,199)
8:00 a.m. to 8:29 a.m. - Females: Iola:
21.6% (8)Texas:
12.2% (671,134)
9:00 a.m. to 9:59 a.m. - Females: Iola:
19.2% (7)Texas:
7.8% (428,296)
Private vehicle occupancy Drove alone: Iola:
99.0% (83)Texas:
87.6% (10,283,021)
Class of workers
Employee of private company: Iola:
65.6% (64)Texas:
69.6% (10,139,666)
Self-employed in own incorporated business: Iola:
8.6% (8)Texas:
3.5% (516,446)
Local government workers: Iola:
14.0% (14)Texas:
7.6% (1,109,799)
State government workers: Iola:
4.3% (4)Texas:
3.8% (558,618)
Self-employed workers in own not incorporated business: Iola:
7.5% (7)Texas:
6.8% (998,270)
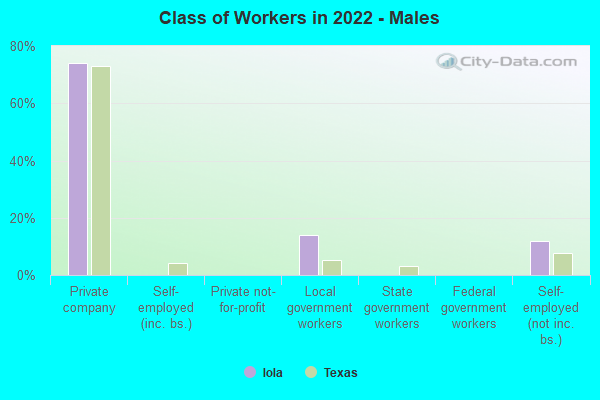
Employee of private company - Males: Iola:
74.0% (39)Texas:
73.1% (5,788,450)
Local government workers - Males: Iola:
14.0% (7)Texas:
5.1% (405,467)
Self-employed workers in own not incorporated business - Males: Iola:
12.0% (6)Texas:
7.7% (609,246)
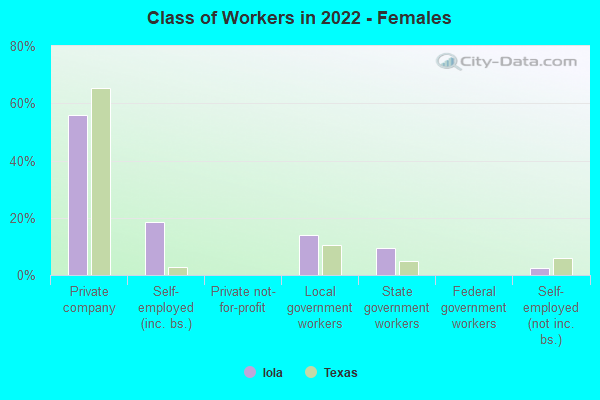
Employee of private company - Females: Iola:
55.8% (25)Texas:
65.4% (4,351,216)
Self-employed in own incorporated business - Females: Iola:
18.6% (8)Texas:
2.8% (183,791)
Local government workers - Females: Iola:
14.0% (6)Texas:
10.6% (704,332)
State government workers - Females: Iola:
9.3% (4)Texas:
4.8% (321,912)
Self-employed workers in own not incorporated business - Females: Iola:
2.3% (1)Texas:
5.8% (389,024)