Work and Jobs in Johnston, Rhode Island (RI) Detailed Stats
Occupations, Industries, Unemployment, Workers, Commute
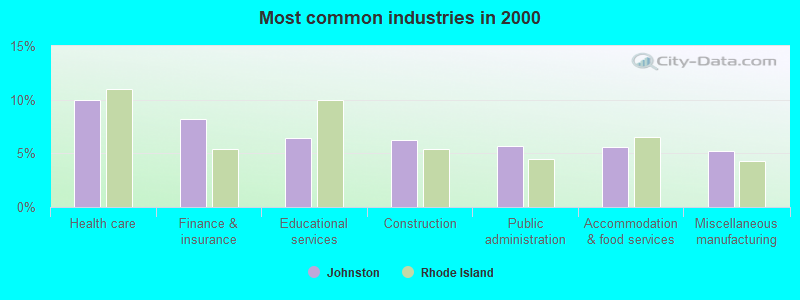
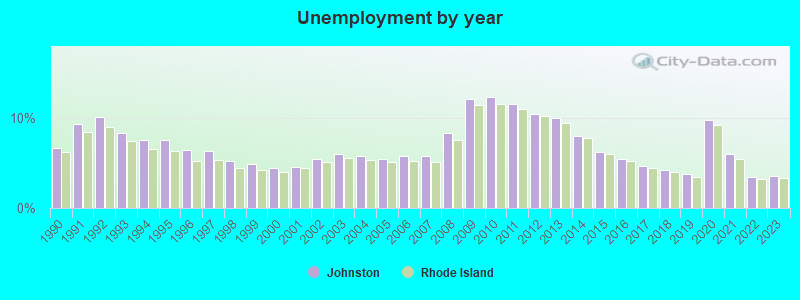
The unemployment rate in 2023 in Johnston, RI was 3.6%, which was 8.3% greater than the unemployment rate of 3.3% across the entire state of Rhode Island. Compared to the unemployment rate of 10.0% in 2013, this represents a decrease of 177.8%. The most common industries in Johnston are: Health care (9.9% of civilian employees), Finance & insurance (8.2% of civilian employees), Educational services (6.4% of civilian employees). 66.7% of workers are employees of private companies, which is about the same as the rate of 66.9% across the entire state of Rhode Island.
Most common industries
Most common industries | |||
|---|---|---|---|
Industry | All | Males | Females |
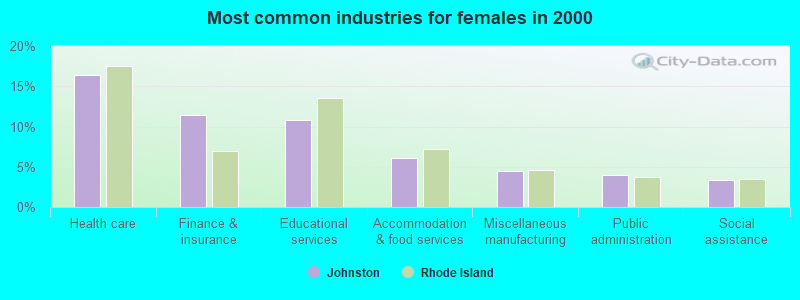
| Health care | 9.9% (1,364) | 4.1% (299) | 16.3% (1,065) |
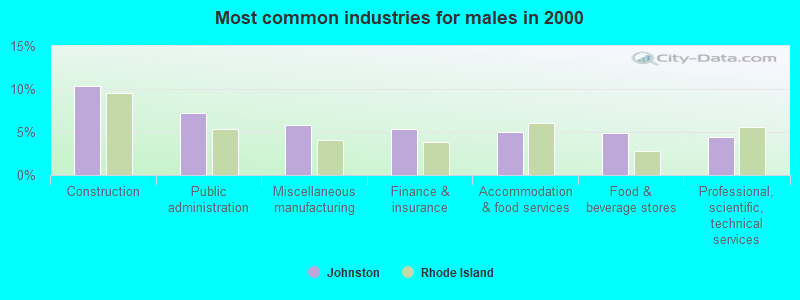
| Finance and insurance | 8.2% (1,131) | 5.3% (384) | 11.5% (747) |
| Educational services | 6.4% (883) | 2.5% (180) | 10.8% (703) |
| Construction | 6.2% (857) | 10.4% (748) | 1.7% (109) |
| Public administration | 5.7% (776) | 7.2% (521) | 3.9% (255) |
| Accommodation and food services | 5.5% (761) | 5.1% (364) | 6.1% (397) |
| Miscellaneous manufacturing | 5.2% (717) | 5.9% (422) | 4.5% (295) |
| Food and beverage stores | 4.1% (559) | 4.9% (352) | 3.2% (207) |
| Professional, scientific, and technical services | 3.9% (531) | 4.4% (319) | 3.3% (212) |
| Administrative and support and waste management services | 3.2% (442) | 3.9% (283) | 2.4% (159) |
| Arts, entertainment, and recreation | 2.2% (298) | 2.4% (175) | 1.9% (123) |
| Repair and maintenance | 2.0% (268) | 3.3% (236) | 0.5% (32) |
| Motor vehicle and parts dealers | 1.9% (267) | 3.5% (250) | 0.3% (17) |
| Personal and laundry services | 1.9% (267) | 0.8% (61) | 3.2% (206) |
| Real estate and rental and leasing | 1.9% (256) | 1.5% (107) | 2.3% (149) |
| Department and other general merchandise stores | 1.7% (235) | 0.7% (49) | 2.9% (186) |
| Social assistance | 1.7% (232) | 0.2% (16) | 3.3% (216) |
| Metal and metal products | 1.6% (217) | 2.1% (149) | 1.0% (68) |
| Broadcasting and telecommunications | 1.6% (214) | 2.0% (142) | 1.1% (72) |
| Groceries and related products merchant wholesalers | 1.4% (192) | 2.0% (145) | 0.7% (47) |
| Religious, grantmaking, civic, professional, and similar organizations | 1.3% (185) | 1.1% (79) | 1.6% (106) |
| Computer and electronic products | 1.3% (180) | 1.9% (139) | 0.6% (41) |
| Pharmacies and drug stores | 1.3% (173) | 0.7% (51) | 1.9% (122) |
| U. S. Postal service | 1.2% (166) | 1.8% (130) | 0.6% (36) |
| Other direct selling establishments | 1.0% (138) | 0.9% (66) | 1.1% (72) |
| Used merchandise, gift, novelty, and souvenir, and other miscellaneous stores | 0.8% (113) | 0.7% (53) | 0.9% (60) |
| Radio, TV, and computer stores | 0.8% (110) | 0.8% (55) | 0.8% (55) |
| Printing and related support activities | 0.8% (106) | 0.8% (57) | 0.8% (49) |
| Clothing and accessories, including shoe, stores | 0.8% (105) | 0.4% (32) | 1.1% (73) |
| Other transportation, and support activities, and couriers | 0.8% (105) | 1.1% (81) | 0.4% (24) |
| Plastics and rubber products | 0.7% (97) | 1.1% (77) | 0.3% (20) |
| Truck transportation | 0.7% (97) | 1.3% (97) | 0.0% (0) |
| Chemicals | 0.7% (93) | 0.7% (54) | 0.6% (39) |
| Food | 0.6% (88) | 0.6% (40) | 0.7% (48) |
| Building material and garden equipment and supplies dealers | 0.6% (79) | 0.7% (53) | 0.4% (26) |
| Transportation equipment | 0.6% (78) | 1.0% (69) | 0.1% (9) |
| Miscellaneous durable goods merchant wholesalers | 0.5% (68) | 0.3% (25) | 0.7% (43) |
| Publishing, and motion picture and sound recording industries | 0.5% (66) | 0.5% (36) | 0.5% (30) |
| Miscellaneous nondurable goods merchant wholesalers | 0.5% (65) | 0.7% (47) | 0.3% (18) |
| Machinery, equipment, and supplies merchant wholesalers | 0.5% (64) | 0.5% (35) | 0.4% (29) |
| Machinery | 0.5% (64) | 0.8% (55) | 0.1% (9) |
| Utilities | 0.4% (61) | 0.5% (39) | 0.3% (22) |
| Professional and commercial equipment and supplies merchant wholesalers | 0.4% (57) | 0.3% (25) | 0.5% (32) |
| Recyclable material merchant wholesalers | 0.4% (54) | 0.7% (54) | 0.0% (0) |
| Nonmetallic mineral products | 0.4% (53) | 0.7% (53) | 0.0% (0) |
| Furniture and home furnishings, and household appliance stores | 0.4% (53) | 0.2% (12) | 0.6% (41) |
| Motor vehicles, parts and supplies merchant wholesalers | 0.4% (51) | 0.7% (51) | 0.0% (0) |
| Private households | 0.3% (48) | 0.2% (12) | 0.6% (36) |
| Textile mills and textile products | 0.3% (47) | 0.4% (30) | 0.3% (17) |
| Data processing, libraries, and other information services | 0.3% (43) | 0.5% (35) | 0.1% (8) |
| Electrical equipment, appliances, and components | 0.3% (43) | 0.3% (24) | 0.3% (19) |
| Fuel dealers | 0.3% (41) | 0.3% (25) | 0.2% (16) |
| Petroleum and petroleum products merchant wholesalers | 0.3% (35) | 0.5% (35) | 0.0% (0) |
| Jewelry, luggage, and leather goods stores | 0.2% (33) | 0.2% (18) | 0.2% (15) |
| Paper | 0.2% (32) | 0.3% (25) | 0.1% (7) |
| Paper and paper products merchant wholesalers | 0.2% (28) | 0.2% (18) | 0.2% (10) |
| Office supplies and stationery stores | 0.2% (28) | 0.4% (28) | 0.0% (0) |
| Electrical and electronic goods merchant wholesalers | 0.2% (27) | 0.4% (27) | 0.0% (0) |
| Gasoline stations | 0.2% (26) | 0.4% (26) | 0.0% (0) |
| Vending machine operators | 0.2% (24) | 0.3% (24) | 0.0% (0) |
| Beverage and tobacco products | 0.2% (21) | 0.2% (12) | 0.1% (9) |
| Sporting goods, camera, and hobby and toy stores | 0.2% (21) | 0.1% (10) | 0.2% (11) |
| Management of companies and enterprises | 0.1% (19) | 0.2% (11) | 0.1% (8) |
| Electronic shopping and mail-order houses | 0.1% (17) | 0.1% (9) | 0.1% (8) |
| Retail florists | 0.1% (15) | 0.0% (0) | 0.2% (15) |
| Furniture and related product manufacturing | 0.1% (15) | 0.2% (15) | 0.0% (0) |
| Book stores and news dealers | 0.1% (14) | 0.1% (6) | 0.1% (8) |
| Agriculture, forestry, fishing and hunting | 0.1% (14) | 0.1% (8) | 0.1% (6) |
| Furniture and home furnishing merchant wholesalers | 0.1% (11) | 0.2% (11) | 0.0% (0) |
| Apparel | 0.1% (10) | 0.1% (10) | 0.0% (0) |
| Petroleum and coal products | 0.1% (9) | 0.1% (9) | 0.0% (0) |
Unemployment in Johnston
- Unemployment by race in 2000
- Unemployment rate for White non-Hispanic residents
- 4.9%Males
- 4.4%Females
- Unemployment rate for other race residents
- 22.7%Males
- 21.6%Females
- Unemployment rate for Hispanic or Latino residents
- 13.2%Males
- 11.5%Females
Unemployment in 2023:
| Johnston: | 3.6% |
| Rhode Island: | 3.3% |
Unemployment in 2022:
| Johnston: | 3.5% |
| Rhode Island: | 3.2% |
Unemployment in 2021:
| Johnston: | 6.0% |
| Rhode Island: | 5.5% |
Unemployment in 2020:
| Johnston: | 9.8% |
| Rhode Island: | 9.2% |
Unemployment in 2019:
| Johnston: | 3.8% |
| Rhode Island: | 3.5% |
Unemployment in 2018:
| Johnston: | 4.2% |
| Rhode Island: | 4.0% |
Unemployment in 2017:
| Johnston: | 4.7% |
| Rhode Island: | 4.5% |
Unemployment in 2016:
| Johnston: | 5.4% |
| Rhode Island: | 5.2% |
Unemployment in 2015:
| Johnston: | 6.2% |
| Rhode Island: | 6.0% |
Unemployment in 2014:
| Johnston: | 8.0% |
| Rhode Island: | 7.8% |
Unemployment in 2013:
| Johnston: | 10.0% |
| Rhode Island: | 9.5% |
Unemployment in 2012:
| Johnston: | 10.5% |
| Rhode Island: | 10.2% |
Unemployment in 2011:
| Johnston: | 11.6% |
| Rhode Island: | 11.0% |
Unemployment in 2010:
| Johnston: | 12.3% |
| Rhode Island: | 11.6% |
Unemployment in 2009:
| Johnston: | 12.1% |
| Rhode Island: | 11.4% |
Unemployment in 2008:
| Johnston: | 8.3% |
| Rhode Island: | 7.6% |
Unemployment in 2007:
| Johnston: | 5.8% |
| Rhode Island: | 5.1% |
Unemployment in 2006:
| Johnston: | 5.8% |
| Rhode Island: | 5.2% |
Unemployment in 2005:
| Johnston: | 5.4% |
| Rhode Island: | 5.1% |
Unemployment in 2004:
| Johnston: | 5.8% |
| Rhode Island: | 5.3% |
Unemployment in 2003:
| Johnston: | 6.0% |
| Rhode Island: | 5.6% |
Unemployment in 2002:
| Johnston: | 5.4% |
| Rhode Island: | 5.1% |
Unemployment in 2001:
| Johnston: | 4.6% |
| Rhode Island: | 4.5% |
Unemployment in 2000:
| Johnston: | 4.4% |
| Rhode Island: | 4.0% |
Unemployment in 1999:
| Johnston: | 4.9% |
| Rhode Island: | 4.2% |
Unemployment in 1998:
| Johnston: | 5.2% |
| Rhode Island: | 4.5% |
Unemployment in 1997:
| Johnston: | 6.3% |
| Rhode Island: | 5.3% |
Unemployment in 1996:
| Johnston: | 6.4% |
| Rhode Island: | 5.2% |
Unemployment in 1995:
| Johnston: | 7.6% |
| Rhode Island: | 6.3% |
Unemployment in 1994:
| Johnston: | 7.6% |
| Rhode Island: | 6.6% |
Unemployment in 1993:
| Johnston: | 8.3% |
| Rhode Island: | 7.5% |
Unemployment in 1992:
| Johnston: | 10.1% |
| Rhode Island: | 9.0% |
Unemployment in 1991:
| Johnston: | 9.3% |
| Rhode Island: | 8.4% |
Unemployment in 1990:
| Johnston: | 6.7% |
| Rhode Island: | 6.2% |
Time leaving home to go to work
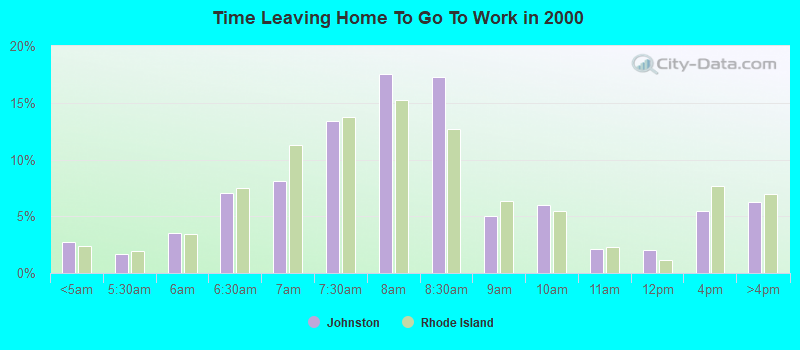
<5am:
| Johnston: | 2.7% (364) |
| Rhode Island: | 2.4% (11,721) |
5:30am:
| Johnston: | 1.7% (225) |
| Rhode Island: | 1.9% (9,427) |
6am:
| Johnston: | 3.5% (473) |
| Rhode Island: | 3.4% (16,776) |
6:30am:
| Johnston: | 7.0% (940) |
| Rhode Island: | 7.4% (36,550) |
7am:
| Johnston: | 8.1% (1,084) |
| Rhode Island: | 11.2% (55,159) |
7:30am:
| Johnston: | 13.4% (1,784) |
| Rhode Island: | 13.7% (67,410) |
8am:
| Johnston: | 17.5% (2,342) |
| Rhode Island: | 15.2% (74,686) |
8:30am:
| Johnston: | 17.2% (2,303) |
| Rhode Island: | 12.7% (62,164) |
9am:
| Johnston: | 5.0% (666) |
| Rhode Island: | 6.3% (31,014) |
10am:
| Johnston: | 6.0% (798) |
| Rhode Island: | 5.5% (26,918) |
11am:
| Johnston: | 2.1% (287) |
| Rhode Island: | 2.3% (11,126) |
12pm:
| Johnston: | 2.0% (272) |
| Rhode Island: | 1.1% (5,446) |
4pm:
| Johnston: | 5.5% (732) |
| Rhode Island: | 7.6% (37,510) |
>4pm:
| Johnston: | 6.3% (838) |
| Rhode Island: | 6.9% (34,003) |
Travel time to work
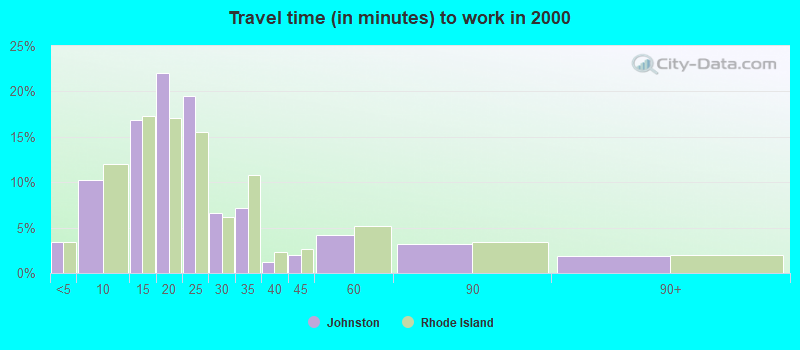
Less than 5 minutes:
| Johnston: | 3.4% (456) |
| Rhode Island: | 3.4% (16,500) |
5 to 9 minutes:
| Johnston: | 10.3% (1,371) |
| Rhode Island: | 12.0% (59,005) |
10 to 14 minutes:
| Johnston: | 16.9% (2,252) |
| Rhode Island: | 17.3% (85,107) |
15 to 19 minutes:
| Johnston: | 22.0% (2,936) |
| Rhode Island: | 17.1% (83,738) |
20 to 24 minutes:
| Johnston: | 19.5% (2,599) |
| Rhode Island: | 15.5% (76,224) |
25 to 29 minutes:
| Johnston: | 6.6% (883) |
| Rhode Island: | 6.2% (30,333) |
30 to 34 minutes:
| Johnston: | 7.2% (958) |
| Rhode Island: | 10.7% (52,752) |
35 to 39 minutes:
| Johnston: | 1.2% (164) |
| Rhode Island: | 2.3% (11,163) |
40 to 44 minutes:
| Johnston: | 1.9% (259) |
| Rhode Island: | 2.7% (13,119) |
45 to 59 minutes:
| Johnston: | 4.2% (558) |
| Rhode Island: | 5.2% (25,297) |
60 to 89 minutes:
| Johnston: | 3.2% (423) |
| Rhode Island: | 3.5% (16,992) |
90 or more minutes:
| Johnston: | 1.9% (249) |
| Rhode Island: | 2.0% (9,680) |
Means of transportation to work
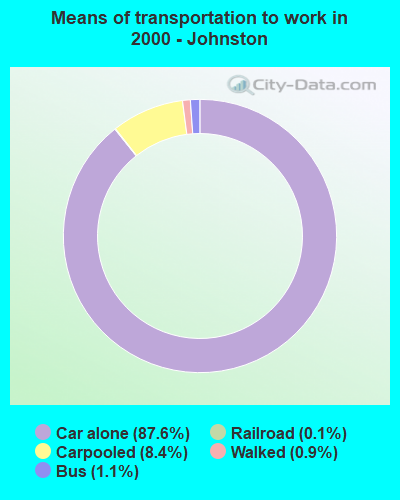
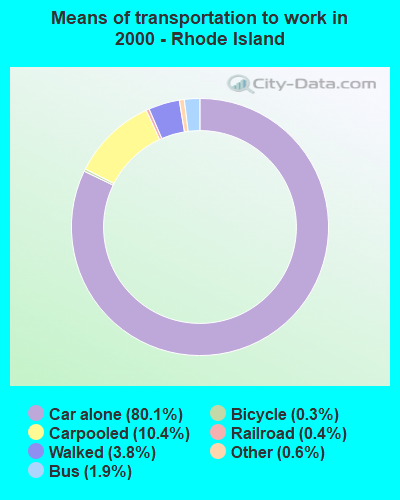
Drove car alone:
| Johnston: | 87.6% (11,702) |
| Rhode Island: | 80.1% (393,322) |
Carpooled:
| Johnston: | 8.4% (1,117) |
| Rhode Island: | 10.4% (51,004) |
Bus or trolley bus:
| Johnston: | 1.1% (145) |
| Rhode Island: | 1.9% (9,171) |
Railroad:
| Johnston: | 0.1% (18) |
| Rhode Island: | 0.4% (2,015) |
Taxicab:
| Johnston: | 0.0% (6) |
| Rhode Island: | 0.1% (381) |
Bicycle:
| Johnston: | 0.0% (6) |
| Rhode Island: | 0.3% (1,338) |
Walked:
| Johnston: | 0.9% (114) |
| Rhode Island: | 3.8% (18,717) |
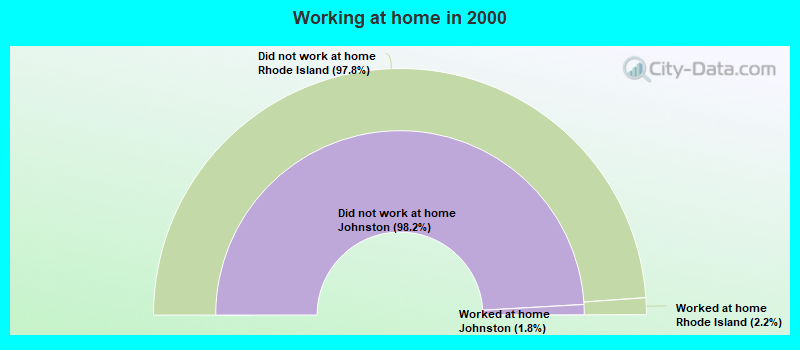
Private vehicle occupancy
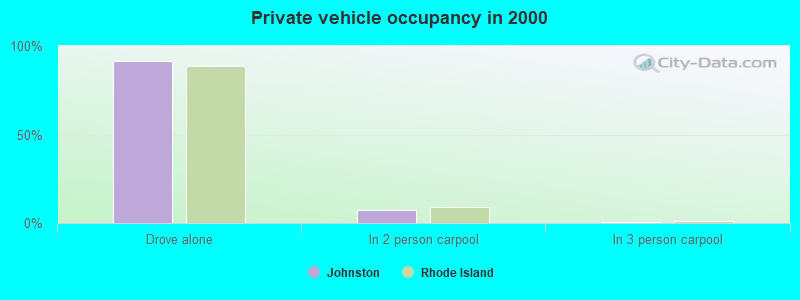
Drove alone:
| Johnston: | 91.3% (11,702) |
| Rhode Island: | 88.5% (393,322) |
In 2 person carpool:
| Johnston: | 7.5% (956) |
| Rhode Island: | 9.3% (41,362) |
In 3 person carpool:
| Johnston: | 0.4% (47) |
| Rhode Island: | 1.3% (5,736) |
In 4 person carpool:
| Johnston: | 0.8% (99) |
| Rhode Island: | 0.4% (1,768) |
In 7+ person carpool:
| Johnston: | 0.1% (15) |
| Rhode Island: | 0.2% (1,009) |
Class of workers
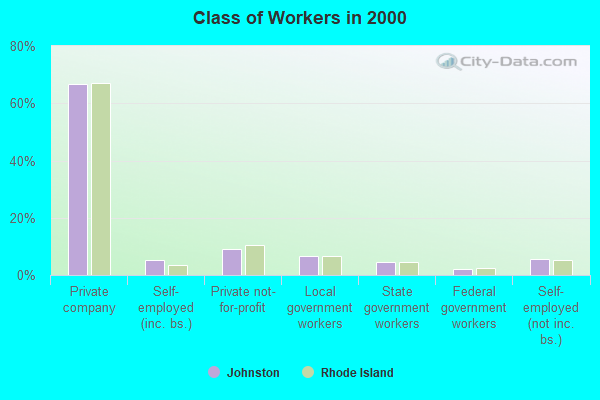
Employee of private company:
| Johnston: | 66.7% (9,153) |
| Rhode Island: | 66.9% (335,216) |
Self-employed in own incorporated business:
| Johnston: | 5.4% (737) |
| Rhode Island: | 3.3% (16,647) |
Private not-for-profit wage and salary workers:
| Johnston: | 9.0% (1,236) |
| Rhode Island: | 10.3% (51,704) |
Local government workers:
| Johnston: | 6.7% (913) |
| Rhode Island: | 6.7% (33,698) |
State government workers:
| Johnston: | 4.4% (606) |
| Rhode Island: | 4.6% (23,172) |
Federal government workers:
| Johnston: | 2.1% (282) |
| Rhode Island: | 2.4% (12,228) |
Self-employed workers in own not incorporated business:
| Johnston: | 5.5% (754) |
| Rhode Island: | 5.4% (26,974) |
Unpaid family workers:
| Johnston: | 0.3% (40) |
| Rhode Island: | 0.2% (1,092) |
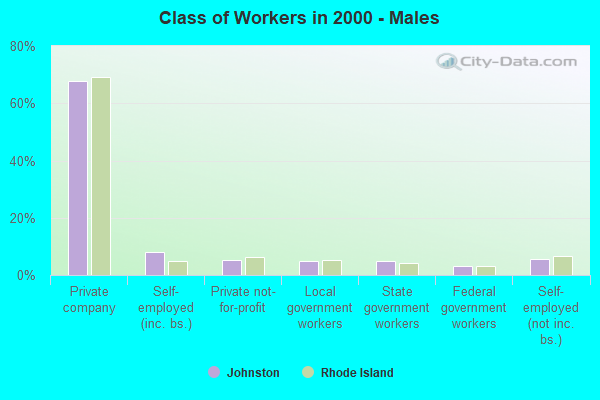
Employee of private company - Males:
| Johnston: | 67.7% (4,877) |
| Rhode Island: | 69.2% (178,819) |
Self-employed in own incorporated business - Males:
| Johnston: | 8.1% (586) |
| Rhode Island: | 4.8% (12,406) |
Private not-for-profit wage and salary workers - Males:
| Johnston: | 5.3% (383) |
| Rhode Island: | 6.5% (16,690) |
Local government workers - Males:
| Johnston: | 5.0% (357) |
| Rhode Island: | 5.3% (13,791) |
State government workers - Males:
| Johnston: | 4.9% (352) |
| Rhode Island: | 4.2% (10,825) |
Federal government workers - Males:
| Johnston: | 3.0% (215) |
| Rhode Island: | 3.1% (8,047) |
Self-employed workers in own not incorporated business - Males:
| Johnston: | 5.6% (406) |
| Rhode Island: | 6.6% (17,109) |
Unpaid family workers - Males:
| Johnston: | 0.4% (30) |
| Rhode Island: | 0.2% (553) |
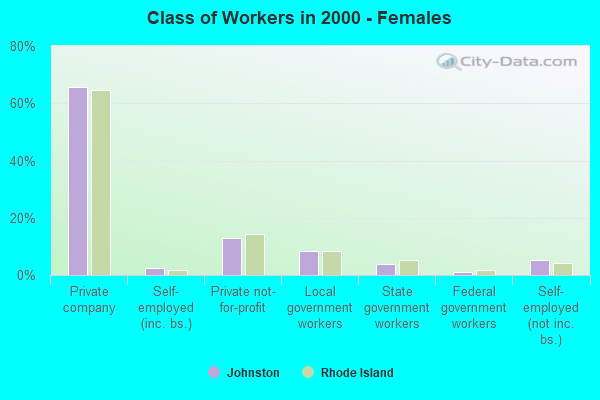
Employee of private company - Females:
| Johnston: | 65.6% (4,276) |
| Rhode Island: | 64.5% (156,397) |
Self-employed in own incorporated business - Females:
| Johnston: | 2.3% (151) |
| Rhode Island: | 1.7% (4,241) |
Private not-for-profit wage and salary workers - Females:
| Johnston: | 13.1% (853) |
| Rhode Island: | 14.4% (35,014) |
Local government workers - Females:
| Johnston: | 8.5% (556) |
| Rhode Island: | 8.2% (19,907) |
State government workers - Females:
| Johnston: | 3.9% (254) |
| Rhode Island: | 5.1% (12,347) |
Federal government workers - Females:
| Johnston: | 1.0% (67) |
| Rhode Island: | 1.7% (4,181) |
Self-employed workers in own not incorporated business - Females:
| Johnston: | 5.3% (348) |
| Rhode Island: | 4.1% (9,865) |
Unpaid family workers - Females:
| Johnston: | 0.2% (10) |
| Rhode Island: | 0.2% (539) |