Work and Jobs in Jurupa, California (CA) Detailed Stats
Occupations, Industries, Unemployment, Workers, Commute
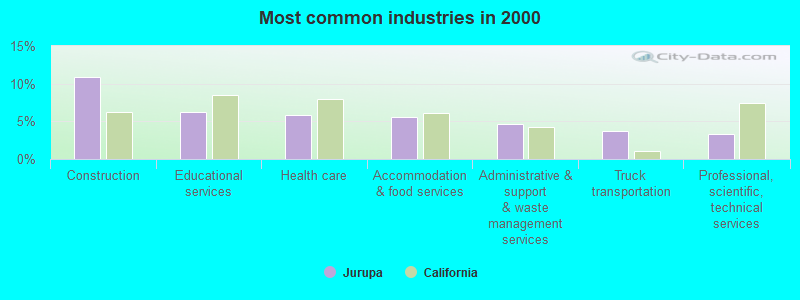
The most common industries in Jurupa are: Construction (10.9% of civilian employees), Educational services (6.3% of civilian employees), Health care (5.9% of civilian employees). 73.8% of workers are employees of private companies, which is 7.9% greater than the rate of 68.0% across the entire state of California.
Most common industries
Most common industries | |||
|---|---|---|---|
Industry | All | Males | Females |
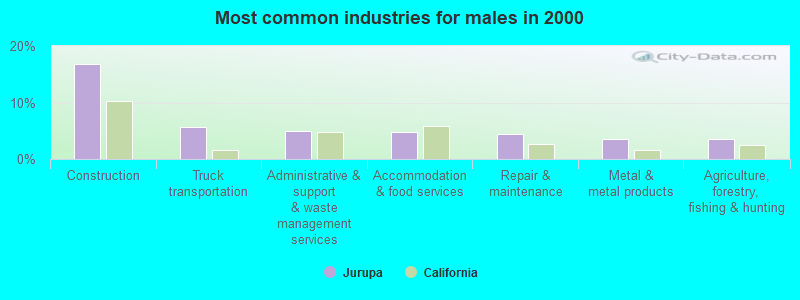
| Construction | 10.9% (3,585) | 16.8% (3,220) | 2.7% (365) |
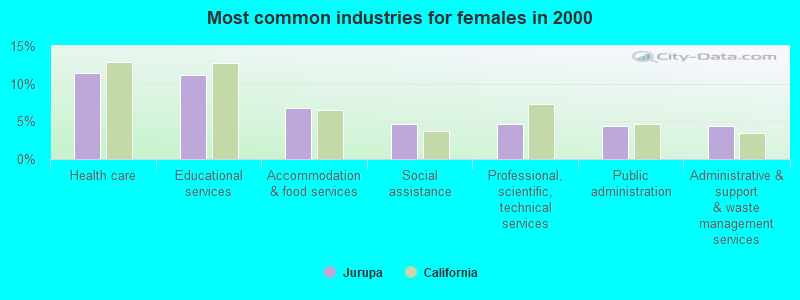
| Educational services | 6.3% (2,063) | 2.9% (549) | 11.1% (1,514) |
| Health care | 5.9% (1,920) | 1.9% (370) | 11.4% (1,550) |
| Accommodation and food services | 5.6% (1,849) | 4.8% (919) | 6.8% (930) |
| Administrative and support and waste management services | 4.7% (1,540) | 5.0% (952) | 4.3% (588) |
| Truck transportation | 3.7% (1,208) | 5.6% (1,077) | 1.0% (131) |
| Professional, scientific, and technical services | 3.3% (1,090) | 2.4% (461) | 4.6% (629) |
| Public administration | 3.1% (1,020) | 2.2% (419) | 4.4% (601) |
| Repair and maintenance | 2.8% (922) | 4.4% (842) | 0.6% (80) |
| Food and beverage stores | 2.7% (888) | 2.5% (473) | 3.0% (415) |
| Finance and insurance | 2.6% (836) | 1.7% (329) | 3.7% (507) |
| Real estate and rental and leasing | 2.5% (831) | 2.0% (378) | 3.3% (453) |
| Metal and metal products | 2.5% (808) | 3.5% (669) | 1.0% (139) |
| Transportation equipment | 2.4% (799) | 3.4% (656) | 1.0% (143) |
| Other transportation, and support activities, and couriers | 2.3% (758) | 2.7% (521) | 1.7% (237) |
| Agriculture, forestry, fishing and hunting | 2.3% (746) | 3.5% (666) | 0.6% (80) |
| Social assistance | 2.3% (742) | 0.6% (106) | 4.7% (636) |
| Miscellaneous manufacturing | 2.2% (712) | 2.1% (406) | 2.2% (306) |
| Department and other general merchandise stores | 2.0% (642) | 1.2% (237) | 3.0% (405) |
| Motor vehicle and parts dealers | 1.6% (529) | 2.1% (396) | 1.0% (133) |
| Arts, entertainment, and recreation | 1.6% (516) | 1.7% (319) | 1.4% (197) |
| Food | 1.3% (418) | 1.4% (268) | 1.1% (150) |
| Computer and electronic products | 1.2% (394) | 1.4% (260) | 1.0% (134) |
| Utilities | 1.1% (359) | 1.6% (300) | 0.4% (59) |
| Furniture and related product manufacturing | 1.1% (356) | 1.2% (230) | 0.9% (126) |
| Personal and laundry services | 1.1% (351) | 0.4% (83) | 2.0% (268) |
| Plastics and rubber products | 1.1% (349) | 1.2% (221) | 0.9% (128) |
| Publishing, and motion picture and sound recording industries | 1.0% (342) | 1.1% (204) | 1.0% (138) |
| Warehousing and storage | 0.9% (311) | 1.1% (213) | 0.7% (98) |
| Machinery | 0.9% (295) | 0.9% (177) | 0.9% (118) |
| Broadcasting and telecommunications | 0.9% (286) | 1.0% (189) | 0.7% (97) |
| Groceries and related products merchant wholesalers | 0.8% (277) | 1.2% (226) | 0.4% (51) |
| Used merchandise, gift, novelty, and souvenir, and other miscellaneous stores | 0.8% (246) | 0.4% (78) | 1.2% (168) |
| Building material and garden equipment and supplies dealers | 0.7% (231) | 0.9% (180) | 0.4% (51) |
| Machinery, equipment, and supplies merchant wholesalers | 0.7% (224) | 0.9% (173) | 0.4% (51) |
| U. S. Postal service | 0.6% (204) | 0.5% (105) | 0.7% (99) |
| Motor vehicles, parts and supplies merchant wholesalers | 0.6% (199) | 0.7% (136) | 0.5% (63) |
| Clothing and accessories, including shoe, stores | 0.6% (193) | 0.3% (66) | 0.9% (127) |
| Paper | 0.6% (186) | 0.8% (148) | 0.3% (38) |
| Nonmetallic mineral products | 0.6% (185) | 0.8% (161) | 0.2% (24) |
| Miscellaneous nondurable goods merchant wholesalers | 0.5% (170) | 0.5% (93) | 0.6% (77) |
| Wood products | 0.5% (168) | 0.6% (124) | 0.3% (44) |
| Printing and related support activities | 0.5% (168) | 0.6% (106) | 0.5% (62) |
| Furniture and home furnishings, and household appliance stores | 0.5% (168) | 0.6% (106) | 0.5% (62) |
| Electrical equipment, appliances, and components | 0.5% (158) | 0.4% (78) | 0.6% (80) |
| Other direct selling establishments | 0.5% (156) | 0.5% (102) | 0.4% (54) |
| Radio, TV, and computer stores | 0.5% (153) | 0.6% (109) | 0.3% (44) |
| Gasoline stations | 0.4% (146) | 0.4% (70) | 0.6% (76) |
| Textile mills and textile products | 0.4% (142) | 0.2% (36) | 0.8% (106) |
| Chemicals | 0.4% (133) | 0.4% (72) | 0.4% (61) |
| Private households | 0.4% (127) | 0.0% (2) | 0.9% (125) |
| Religious, grantmaking, civic, professional, and similar organizations | 0.4% (123) | 0.3% (54) | 0.5% (69) |
| Sporting goods, camera, and hobby and toy stores | 0.4% (118) | 0.2% (37) | 0.6% (81) |
| Electrical and electronic goods merchant wholesalers | 0.3% (104) | 0.2% (43) | 0.4% (61) |
| Apparel | 0.3% (101) | 0.1% (24) | 0.6% (77) |
| Pharmacies and drug stores | 0.3% (99) | 0.2% (45) | 0.4% (54) |
| Data processing, libraries, and other information services | 0.3% (99) | 0.2% (35) | 0.5% (64) |
| Hardware, plumbing and heating equipment, and supplies merchant wholesalers | 0.3% (97) | 0.3% (60) | 0.3% (37) |
| Professional and commercial equipment and supplies merchant wholesalers | 0.3% (92) | 0.3% (63) | 0.2% (29) |
| Health and personal care, except drug, stores | 0.2% (76) | 0.0% (7) | 0.5% (69) |
| Lumber and other construction materials merchant wholesalers | 0.2% (66) | 0.3% (48) | 0.1% (18) |
| Recyclable material merchant wholesalers | 0.2% (64) | 0.3% (64) | 0.0% (0) |
| Furniture and home furnishing merchant wholesalers | 0.2% (64) | 0.2% (29) | 0.3% (35) |
| Petroleum and coal products | 0.2% (61) | 0.3% (61) | 0.0% (0) |
| Rail transportation | 0.2% (56) | 0.1% (20) | 0.3% (36) |
| Air transportation | 0.2% (54) | 0.2% (37) | 0.1% (17) |
| Beverage and tobacco products | 0.1% (46) | 0.2% (36) | 0.1% (10) |
| Electronic shopping and mail-order houses | 0.1% (39) | 0.1% (22) | 0.1% (17) |
| Music stores | 0.1% (36) | 0.1% (26) | 0.1% (10) |
| Mining, quarrying, and oil and gas extraction | 0.1% (33) | 0.2% (33) | 0.0% (0) |
| Paper and paper products merchant wholesalers | 0.1% (29) | 0.2% (29) | 0.0% (0) |
Unemployment in Jurupa
- Unemployment by race in 2000
- Unemployment rate for White non-Hispanic residents
- 6.7%Males
- 6.8%Females
- Unemployment rate for Black residents
- 18.6%Males
- 11.0%Females
- Unemployment rate for American Indian and Alaska Native residents
- 10.6%Males
- 18.7%Females
- Unemployment rate for Asian residents
- 7.6%Males
- 1.8%Females
- Unemployment rate for other race residents
- 6.9%Males
- 12.9%Females
- Unemployment rate for two or more race residents
- 3.1%Males
- 16.2%Females
- Unemployment rate for Hispanic or Latino residents
- 8.1%Males
- 11.0%Females
Time leaving home to go to work
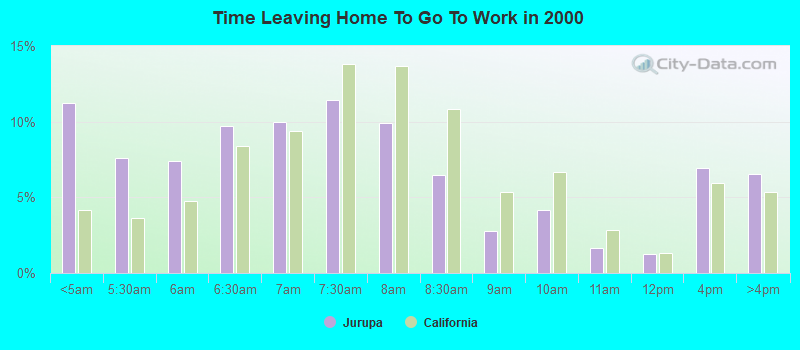
<5am:
| Jurupa: | 11.2% (3,568) |
| California: | 4.2% (606,086) |
5:30am:
| Jurupa: | 7.6% (2,425) |
| California: | 3.6% (523,209) |
6am:
| Jurupa: | 7.4% (2,352) |
| California: | 4.8% (692,256) |
6:30am:
| Jurupa: | 9.7% (3,098) |
| California: | 8.4% (1,216,867) |
7am:
| Jurupa: | 10.0% (3,168) |
| California: | 9.4% (1,362,830) |
7:30am:
| Jurupa: | 11.4% (3,630) |
| California: | 13.8% (2,006,950) |
8am:
| Jurupa: | 9.9% (3,145) |
| California: | 13.7% (1,986,831) |
8:30am:
| Jurupa: | 6.4% (2,050) |
| California: | 10.9% (1,577,815) |
9am:
| Jurupa: | 2.8% (887) |
| California: | 5.4% (778,152) |
10am:
| Jurupa: | 4.2% (1,323) |
| California: | 6.7% (972,355) |
11am:
| Jurupa: | 1.7% (526) |
| California: | 2.9% (414,479) |
12pm:
| Jurupa: | 1.2% (389) |
| California: | 1.3% (189,005) |
4pm:
| Jurupa: | 7.0% (2,210) |
| California: | 6.0% (865,284) |
>4pm:
| Jurupa: | 6.6% (2,088) |
| California: | 5.3% (776,167) |
Travel time to work
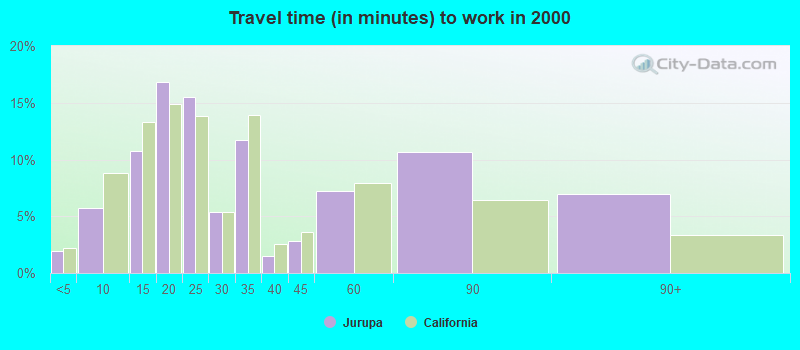
Less than 5 minutes:
| Jurupa: | 1.9% (613) |
| California: | 2.2% (324,703) |
5 to 9 minutes:
| Jurupa: | 5.7% (1,823) |
| California: | 8.8% (1,280,443) |
10 to 14 minutes:
| Jurupa: | 10.8% (3,422) |
| California: | 13.3% (1,930,263) |
15 to 19 minutes:
| Jurupa: | 16.8% (5,341) |
| California: | 14.9% (2,157,970) |
20 to 24 minutes:
| Jurupa: | 15.5% (4,941) |
| California: | 13.8% (2,004,060) |
25 to 29 minutes:
| Jurupa: | 5.4% (1,722) |
| California: | 5.4% (782,241) |
30 to 34 minutes:
| Jurupa: | 11.8% (3,738) |
| California: | 13.9% (2,025,657) |
35 to 39 minutes:
| Jurupa: | 1.5% (472) |
| California: | 2.5% (366,487) |
40 to 44 minutes:
| Jurupa: | 2.8% (890) |
| California: | 3.6% (528,043) |
45 to 59 minutes:
| Jurupa: | 7.2% (2,288) |
| California: | 7.9% (1,151,598) |
60 to 89 minutes:
| Jurupa: | 10.6% (3,385) |
| California: | 6.4% (933,123) |
90 or more minutes:
| Jurupa: | 7.0% (2,224) |
| California: | 3.3% (483,698) |
Means of transportation to work
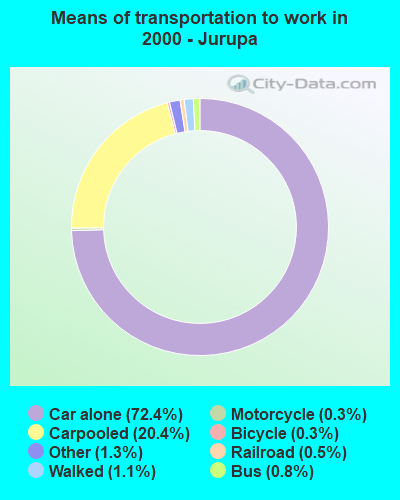

Drove car alone:
| Jurupa: | 72.4% (23,020) |
| California: | 71.8% (10,432,462) |
Carpooled:
| Jurupa: | 20.4% (6,473) |
| California: | 14.5% (2,113,313) |
Bus or trolley bus:
| Jurupa: | 0.8% (260) |
| California: | 3.8% (549,425) |
Railroad:
| Jurupa: | 0.5% (159) |
| California: | 0.3% (41,022) |
Motorcycle:
| Jurupa: | 0.3% (90) |
| California: | 0.2% (36,262) |
Bicycle:
| Jurupa: | 0.3% (101) |
| California: | 0.8% (120,567) |
Walked:
| Jurupa: | 1.1% (336) |
| California: | 2.9% (414,581) |
Other means:
| Jurupa: | 1.3% (420) |
| California: | 0.8% (115,064) |
Private vehicle occupancy
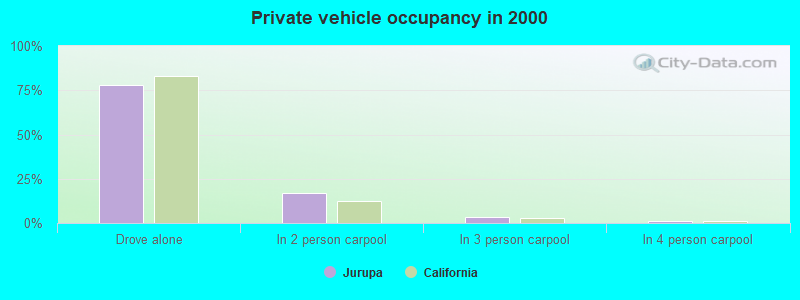
Drove alone:
| Jurupa: | 78.1% (23,020) |
| California: | 83.2% (10,432,462) |
In 2 person carpool:
| Jurupa: | 16.7% (4,929) |
| California: | 12.5% (1,564,905) |
In 3 person carpool:
| Jurupa: | 3.2% (947) |
| California: | 2.6% (330,732) |
In 4 person carpool:
| Jurupa: | 1.1% (311) |
| California: | 1.0% (119,364) |
In 5-6 person carpool:
| Jurupa: | 0.4% (108) |
| California: | 0.5% (57,036) |
In 7+ person carpool:
| Jurupa: | 0.6% (178) |
| California: | 0.3% (41,276) |
Class of workers
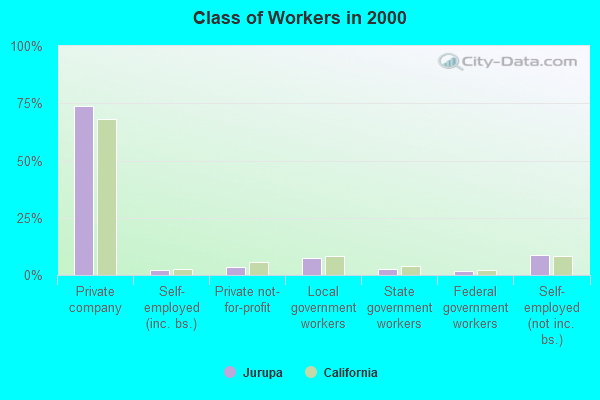
Employee of private company:
| Jurupa: | 73.8% (24,200) |
| California: | 68.0% (10,009,465) |
Self-employed in own incorporated business:
| Jurupa: | 2.1% (688) |
| California: | 2.7% (402,392) |
Private not-for-profit wage and salary workers:
| Jurupa: | 3.4% (1,117) |
| California: | 5.7% (845,536) |
Local government workers:
| Jurupa: | 7.5% (2,463) |
| California: | 8.3% (1,218,764) |
State government workers:
| Jurupa: | 2.5% (806) |
| California: | 4.0% (594,953) |
Federal government workers:
| Jurupa: | 1.7% (565) |
| California: | 2.3% (344,354) |
Self-employed workers in own not incorporated business:
| Jurupa: | 8.5% (2,794) |
| California: | 8.5% (1,249,530) |
Unpaid family workers:
| Jurupa: | 0.4% (147) |
| California: | 0.4% (53,934) |
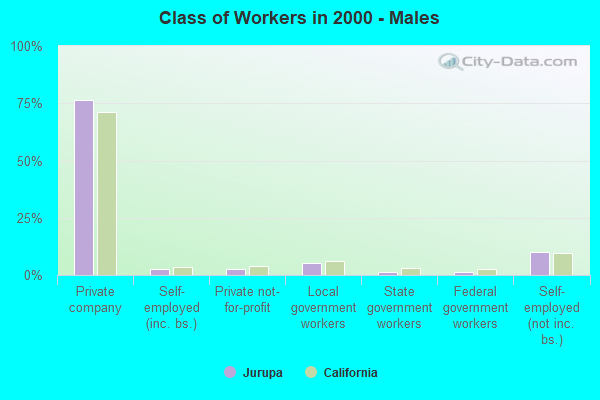
Employee of private company - Males:
| Jurupa: | 76.6% (14,679) |
| California: | 71.1% (5,716,697) |
Self-employed in own incorporated business - Males:
| Jurupa: | 2.7% (525) |
| California: | 3.6% (290,657) |
Private not-for-profit wage and salary workers - Males:
| Jurupa: | 2.7% (524) |
| California: | 3.8% (303,997) |
Local government workers - Males:
| Jurupa: | 5.1% (986) |
| California: | 6.2% (495,927) |
State government workers - Males:
| Jurupa: | 1.2% (223) |
| California: | 3.2% (255,434) |
Federal government workers - Males:
| Jurupa: | 1.1% (220) |
| California: | 2.5% (198,555) |
Self-employed workers in own not incorporated business - Males:
| Jurupa: | 10.1% (1,931) |
| California: | 9.5% (760,853) |
Unpaid family workers - Males:
| Jurupa: | 0.4% (69) |
| California: | 0.3% (23,230) |
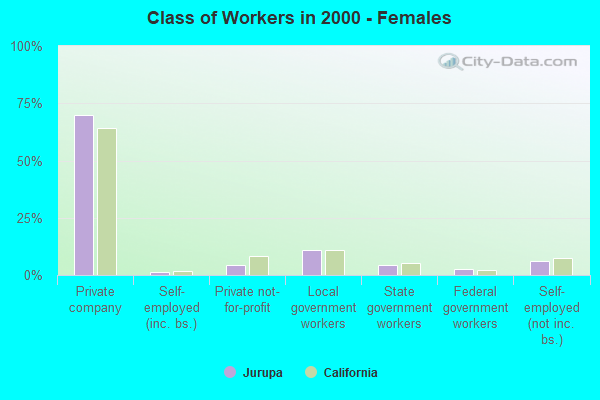
Employee of private company - Females:
| Jurupa: | 69.9% (9,521) |
| California: | 64.3% (4,292,768) |
Self-employed in own incorporated business - Females:
| Jurupa: | 1.2% (163) |
| California: | 1.7% (111,735) |
Private not-for-profit wage and salary workers - Females:
| Jurupa: | 4.4% (593) |
| California: | 8.1% (541,539) |
Local government workers - Females:
| Jurupa: | 10.8% (1,477) |
| California: | 10.8% (722,837) |
State government workers - Females:
| Jurupa: | 4.3% (583) |
| California: | 5.1% (339,519) |
Federal government workers - Females:
| Jurupa: | 2.5% (345) |
| California: | 2.2% (145,799) |
Self-employed workers in own not incorporated business - Females:
| Jurupa: | 6.3% (863) |
| California: | 7.3% (488,677) |
Unpaid family workers - Females:
| Jurupa: | 0.6% (78) |
| California: | 0.5% (30,704) |