Work and Jobs in Kenilworth, Pennsylvania (PA) Detailed Stats
Occupations, Industries, Unemployment, Workers, Commute
Settings
X


Recent posts about work in Kenilworth, Pennsylvania on our local forum with over 2,400,000 registered users:
 | Philadelphia 2035 (9298 replies) |
| Moving to Bethlehem/Nazareth area- need your help (2 replies) |
| Not sure where in Pennsylvania is for us... (14 replies) |
| Terrain apartments or Maiden Bridge/Canongate apartments?? (5 replies) |
Latest news about work in Kenilworth, PA collected exclusively by city-data.com from local newspapers, TV, and radio stations
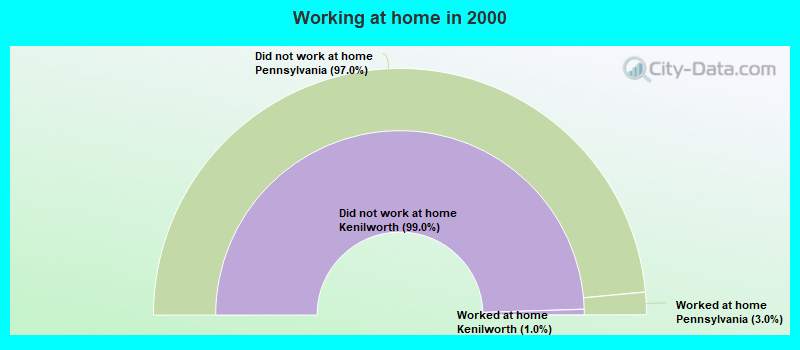
The most common industries in Kenilworth are: Accommodation & food services (11.0% of civilian employees), Health care (8.5% of civilian employees), Professional, scientific, technical services (8.4% of civilian employees). 47.6% of workers work in Chester County and 13.9% of all workers work at home. 76.3% of workers are employees of private companies, which is 11.3% greater than the rate of 67.7% across the entire state of Pennsylvania.
Whole page based on the data from 2000 / 2022 when the population of Kenilworth, Pennsylvania was 1,576 / 2,081
Whole page based on the data from 2000 / 2022 when the population of Kenilworth, Pennsylvania was 1,576 / 2,081
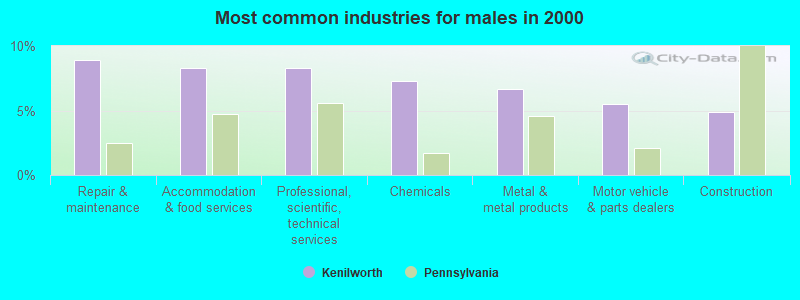
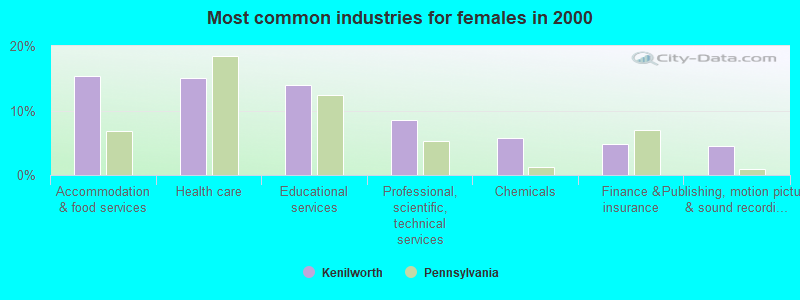
Most common industries

Most common industries | |||
|---|---|---|---|
Industry | All | Males | Females |
| Accommodation and food services | 11.0% (89) | 8.3% (41) | 15.3% (48) |
| Health care | 8.5% (69) | 4.5% (22) | 15.0% (47) |
| Professional, scientific, and technical services | 8.4% (68) | 8.3% (41) | 8.6% (27) |
| Educational services | 7.5% (61) | 3.4% (17) | 14.0% (44) |
| Chemicals | 6.7% (54) | 7.3% (36) | 5.7% (18) |
| Repair and maintenance | 5.4% (44) | 8.9% (44) | 0.0% (0) |
| Metal and metal products | 5.0% (40) | 6.7% (33) | 2.2% (7) |
| Motor vehicle and parts dealers | 3.3% (27) | 5.5% (27) | 0.0% (0) |
| Construction | 3.0% (24) | 4.9% (24) | 0.0% (0) |
| Real estate and rental and leasing | 2.7% (22) | 3.2% (16) | 1.9% (6) |
| Other transportation, and support activities, and couriers | 2.4% (19) | 3.8% (19) | 0.0% (0) |
| Publishing, and motion picture and sound recording industries | 2.2% (18) | 0.8% (4) | 4.5% (14) |
| Machinery, equipment, and supplies merchant wholesalers | 2.1% (17) | 3.4% (17) | 0.0% (0) |
| Utilities | 2.0% (16) | 3.2% (16) | 0.0% (0) |
| Finance and insurance | 1.9% (15) | 0.0% (0) | 4.8% (15) |
| Miscellaneous manufacturing | 1.7% (14) | 1.4% (7) | 2.2% (7) |
| Furniture and home furnishings, and household appliance stores | 1.7% (14) | 2.8% (14) | 0.0% (0) |
| Motor vehicles, parts and supplies merchant wholesalers | 1.5% (12) | 2.4% (12) | 0.0% (0) |
| Used merchandise, gift, novelty, and souvenir, and other miscellaneous stores | 1.4% (11) | 1.4% (7) | 1.3% (4) |
| Paper | 1.4% (11) | 0.0% (0) | 3.5% (11) |
| Administrative and support and waste management services | 1.4% (11) | 2.2% (11) | 0.0% (0) |
| Music stores | 1.2% (10) | 2.0% (10) | 0.0% (0) |
| Personal and laundry services | 1.1% (9) | 0.0% (0) | 2.9% (9) |
| Retail florists | 1.1% (9) | 0.0% (0) | 2.9% (9) |
| Petroleum and coal products | 1.0% (8) | 0.0% (0) | 2.5% (8) |
| Religious, grantmaking, civic, professional, and similar organizations | 1.0% (8) | 1.6% (8) | 0.0% (0) |
| Furniture and home furnishing merchant wholesalers | 0.9% (7) | 1.4% (7) | 0.0% (0) |
| Metals and minerals, except petroleum, merchant wholesalers | 0.9% (7) | 0.0% (0) | 2.2% (7) |
| Vending machine operators | 0.9% (7) | 1.4% (7) | 0.0% (0) |
| Arts, entertainment, and recreation | 0.9% (7) | 1.4% (7) | 0.0% (0) |
| Food | 0.9% (7) | 0.6% (3) | 1.3% (4) |
| Social assistance | 0.7% (6) | 0.0% (0) | 1.9% (6) |
| U. S. Postal service | 0.7% (6) | 1.2% (6) | 0.0% (0) |
| Computer and electronic products | 0.7% (6) | 1.2% (6) | 0.0% (0) |
| Transportation equipment | 0.6% (5) | 1.0% (5) | 0.0% (0) |
| Machinery | 0.6% (5) | 0.0% (0) | 1.6% (5) |
| Broadcasting and telecommunications | 0.6% (5) | 1.0% (5) | 0.0% (0) |
| Nonmetallic mineral products | 0.6% (5) | 1.0% (5) | 0.0% (0) |
| Printing and related support activities | 0.6% (5) | 1.0% (5) | 0.0% (0) |
| Sporting goods, camera, and hobby and toy stores | 0.6% (5) | 1.0% (5) | 0.0% (0) |
| Apparel | 0.6% (5) | 0.0% (0) | 1.6% (5) |
| Food and beverage stores | 0.6% (5) | 0.0% (0) | 1.6% (5) |
| Agriculture, forestry, fishing and hunting | 0.5% (4) | 0.8% (4) | 0.0% (0) |
| Paper and paper products merchant wholesalers | 0.5% (4) | 0.0% (0) | 1.3% (4) |
| Drugs, sundries, and chemical and allied products merchant wholesalers | 0.5% (4) | 0.0% (0) | 1.3% (4) |
| Department and other general merchandise stores | 0.4% (3) | 0.6% (3) | 0.0% (0) |
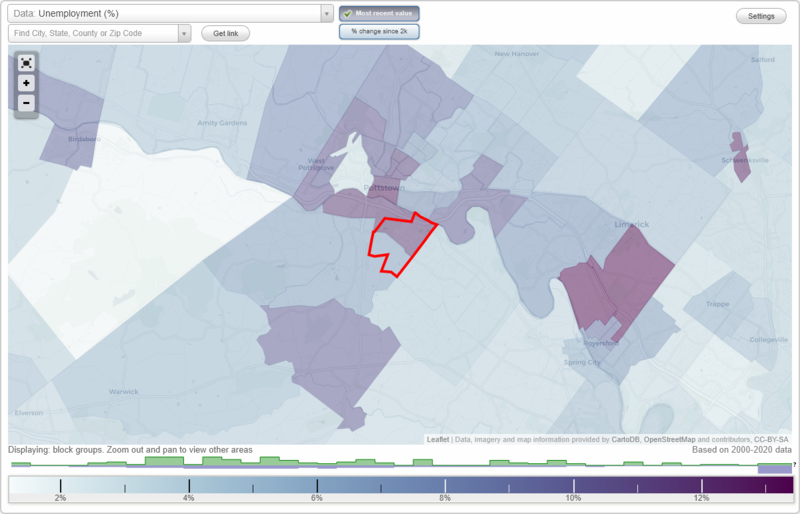
Unemployment in Kenilworth
- Unemployment by race in 2022
- Unemployment rate for White non-Hispanic residents
- 0.6%Males
- 2.0%Females
- Unemployment by race in 2000
- Unemployment rate for White non-Hispanic residents
- 1.3%Males
- 1.3%Females
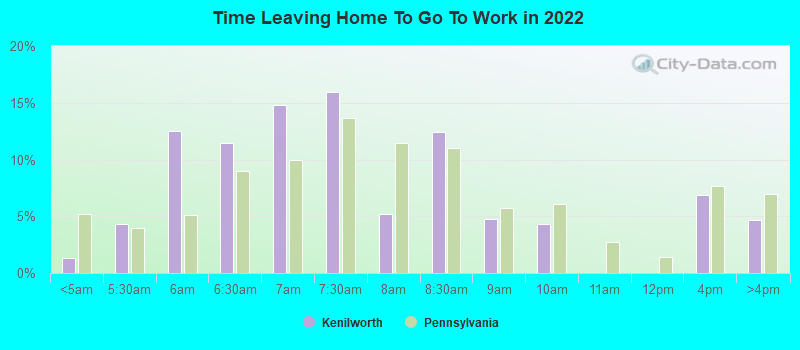
Time leaving home to go to work
12:00 a.m. to 4:59 a.m.:
| Kenilworth: | 1.3% (13) |
| Pennsylvania: | 5.2% (278,903) |
5:00 a.m. to 5:29 a.m.:
| Kenilworth: | 4.3% (43) |
| Pennsylvania: | 3.9% (210,362) |
5:30 a.m. to 5:59 a.m.:
| Kenilworth: | 12.5% (127) |
| Pennsylvania: | 5.1% (274,242) |
6:00 a.m. to 6:29 a.m.:
| Kenilworth: | 11.4% (116) |
| Pennsylvania: | 9.0% (480,402) |
6:30 a.m. to 6:59 a.m.:
| Kenilworth: | 14.8% (150) |
| Pennsylvania: | 10.0% (532,059) |
7:00 a.m. to 7:29 a.m.:
| Kenilworth: | 16.0% (162) |
| Pennsylvania: | 13.6% (726,980) |
7:30 a.m. to 7:59 a.m.:
| Kenilworth: | 5.2% (53) |
| Pennsylvania: | 11.5% (611,627) |
8:00 a.m. to 8:29 a.m.:
| Kenilworth: | 12.5% (126) |
| Pennsylvania: | 11.0% (585,665) |
8:30 a.m. to 8:59 a.m.:
| Kenilworth: | 4.8% (49) |
| Pennsylvania: | 5.7% (302,857) |
9:00 a.m. to 9:59 a.m.:
| Kenilworth: | 4.3% (43) |
| Pennsylvania: | 6.1% (324,576) |
12:00 p.m. to 3:59 p.m.:
| Kenilworth: | 6.8% (69) |
| Pennsylvania: | 7.6% (407,255) |
4:00 p.m. to 11:59 p.m.:
| Kenilworth: | 4.7% (47) |
| Pennsylvania: | 6.9% (369,524) |
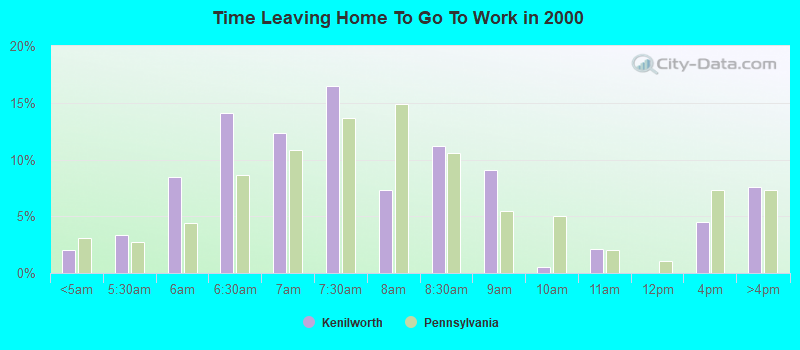
<5am:
| Kenilworth: | 2.0% (16) |
| Pennsylvania: | 3.1% (172,304) |
5:30am:
| Kenilworth: | 3.4% (27) |
| Pennsylvania: | 2.7% (150,168) |
6am:
| Kenilworth: | 8.5% (68) |
| Pennsylvania: | 4.4% (245,004) |
6:30am:
| Kenilworth: | 14.1% (113) |
| Pennsylvania: | 8.6% (478,636) |
7am:
| Kenilworth: | 12.3% (99) |
| Pennsylvania: | 10.8% (599,808) |
7:30am:
| Kenilworth: | 16.4% (132) |
| Pennsylvania: | 13.7% (759,372) |
8am:
| Kenilworth: | 7.3% (59) |
| Pennsylvania: | 14.9% (826,968) |
8:30am:
| Kenilworth: | 11.2% (90) |
| Pennsylvania: | 10.6% (588,440) |
9am:
| Kenilworth: | 9.1% (73) |
| Pennsylvania: | 5.5% (304,765) |
10am:
| Kenilworth: | 0.5% (4) |
| Pennsylvania: | 5.1% (280,812) |
11am:
| Kenilworth: | 2.1% (17) |
| Pennsylvania: | 2.1% (114,676) |
4pm:
| Kenilworth: | 4.5% (36) |
| Pennsylvania: | 7.3% (404,775) |
>4pm:
| Kenilworth: | 7.6% (61) |
| Pennsylvania: | 7.3% (408,070) |
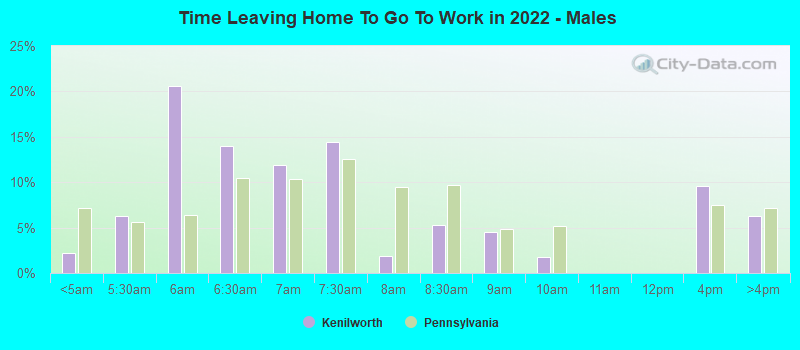
12:00 a.m. to 4:59 a.m. - Males:
| Kenilworth: | 2.2% (13) |
| Pennsylvania: | 7.2% (203,028) |
5:00 a.m. to 5:29 a.m. - Males:
| Kenilworth: | 6.3% (36) |
| Pennsylvania: | 5.6% (157,829) |
5:30 a.m. to 5:59 a.m. - Males:
| Kenilworth: | 20.6% (119) |
| Pennsylvania: | 6.4% (180,791) |
6:00 a.m. to 6:29 a.m. - Males:
| Kenilworth: | 14.0% (81) |
| Pennsylvania: | 10.5% (296,669) |
6:30 a.m. to 6:59 a.m. - Males:
| Kenilworth: | 11.9% (69) |
| Pennsylvania: | 10.4% (293,727) |
7:00 a.m. to 7:29 a.m. - Males:
| Kenilworth: | 14.4% (83) |
| Pennsylvania: | 12.6% (356,257) |
7:30 a.m. to 7:59 a.m. - Males:
| Kenilworth: | 1.9% (11) |
| Pennsylvania: | 9.5% (268,895) |
8:00 a.m. to 8:29 a.m. - Males:
| Kenilworth: | 5.3% (31) |
| Pennsylvania: | 9.7% (274,966) |
8:30 a.m. to 8:59 a.m. - Males:
| Kenilworth: | 4.6% (26) |
| Pennsylvania: | 4.9% (137,370) |
9:00 a.m. to 9:59 a.m. - Males:
| Kenilworth: | 1.7% (10) |
| Pennsylvania: | 5.1% (145,545) |
12:00 p.m. to 3:59 p.m. - Males:
| Kenilworth: | 9.5% (55) |
| Pennsylvania: | 7.4% (210,601) |
4:00 p.m. to 11:59 p.m. - Males:
| Kenilworth: | 6.3% (36) |
| Pennsylvania: | 7.1% (202,203) |
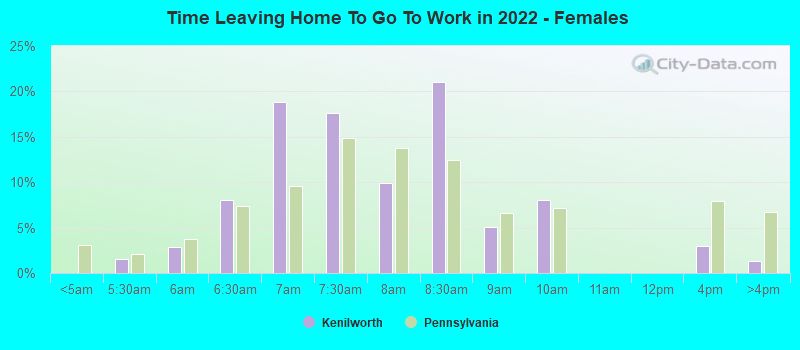
5:00 a.m. to 5:29 a.m. - Females:
| Kenilworth: | 1.6% (7) |
| Pennsylvania: | 2.1% (52,533) |
5:30 a.m. to 5:59 a.m. - Females:
| Kenilworth: | 2.8% (12) |
| Pennsylvania: | 3.7% (93,451) |
6:00 a.m. to 6:29 a.m. - Females:
| Kenilworth: | 8.1% (35) |
| Pennsylvania: | 7.4% (183,733) |
6:30 a.m. to 6:59 a.m. - Females:
| Kenilworth: | 18.8% (82) |
| Pennsylvania: | 9.5% (238,332) |
7:00 a.m. to 7:29 a.m. - Females:
| Kenilworth: | 17.6% (77) |
| Pennsylvania: | 14.8% (370,723) |
7:30 a.m. to 7:59 a.m. - Females:
| Kenilworth: | 9.9% (43) |
| Pennsylvania: | 13.7% (342,732) |
8:00 a.m. to 8:29 a.m. - Females:
| Kenilworth: | 21.0% (92) |
| Pennsylvania: | 12.4% (310,699) |
8:30 a.m. to 8:59 a.m. - Females:
| Kenilworth: | 5.0% (22) |
| Pennsylvania: | 6.6% (165,487) |
9:00 a.m. to 9:59 a.m. - Females:
| Kenilworth: | 8.0% (35) |
| Pennsylvania: | 7.2% (179,031) |
12:00 p.m. to 3:59 p.m. - Females:
| Kenilworth: | 3.0% (13) |
| Pennsylvania: | 7.9% (196,654) |
4:00 p.m. to 11:59 p.m. - Females:
| Kenilworth: | 1.3% (6) |
| Pennsylvania: | 6.7% (167,321) |
Travel time to work
Percentage of workers working in this county: 47.6%
Number of people working at home: 170 (13.9% of all workers)
Number of people working at home: 170 (13.9% of all workers)
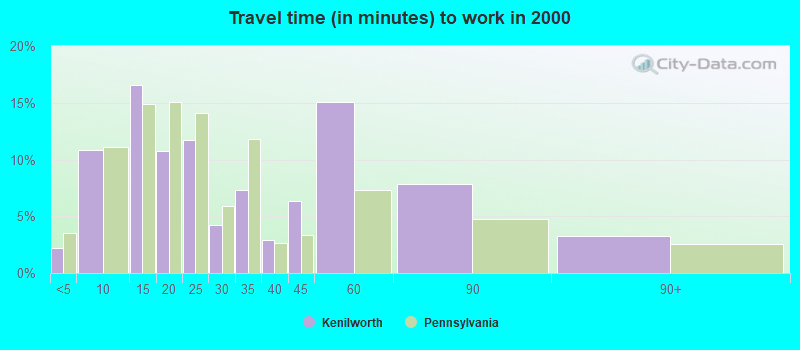
Less than 5 minutes:
| Kenilworth: | 2.2% (18) |
| Pennsylvania: | 3.5% (196,492) |
5 to 9 minutes:
| Kenilworth: | 10.8% (87) |
| Pennsylvania: | 11.1% (615,919) |
10 to 14 minutes:
| Kenilworth: | 16.6% (133) |
| Pennsylvania: | 14.9% (825,199) |
15 to 19 minutes:
| Kenilworth: | 10.7% (86) |
| Pennsylvania: | 15.0% (836,006) |
20 to 24 minutes:
| Kenilworth: | 11.7% (94) |
| Pennsylvania: | 14.1% (782,790) |
25 to 29 minutes:
| Kenilworth: | 4.2% (34) |
| Pennsylvania: | 5.9% (327,459) |
30 to 34 minutes:
| Kenilworth: | 7.3% (59) |
| Pennsylvania: | 11.8% (655,811) |
35 to 39 minutes:
| Kenilworth: | 2.9% (23) |
| Pennsylvania: | 2.7% (148,906) |
40 to 44 minutes:
| Kenilworth: | 6.4% (51) |
| Pennsylvania: | 3.4% (187,483) |
45 to 59 minutes:
| Kenilworth: | 15.1% (121) |
| Pennsylvania: | 7.3% (407,516) |
60 to 89 minutes:
| Kenilworth: | 7.8% (63) |
| Pennsylvania: | 4.8% (265,759) |
90 or more minutes:
| Kenilworth: | 3.2% (26) |
| Pennsylvania: | 2.6% (142,325) |
Means of transportation to work
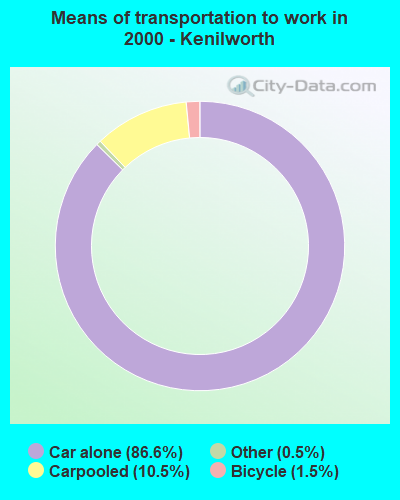

Drove car alone:
| Kenilworth: | 86.6% (695) |
| Pennsylvania: | 76.5% (4,247,836) |
Carpooled:
| Kenilworth: | 10.5% (84) |
| Pennsylvania: | 10.4% (577,364) |
Bicycle:
| Kenilworth: | 1.5% (12) |
| Pennsylvania: | 0.3% (14,001) |
Other means:
| Kenilworth: | 0.5% (4) |
| Pennsylvania: | 0.5% (29,805) |
Private vehicle occupancy
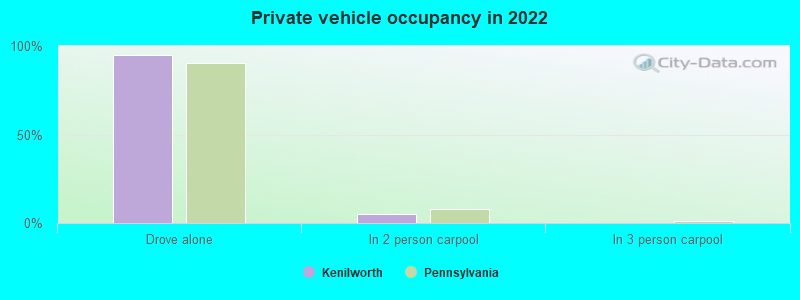
Drove alone:
| Kenilworth: | 94.8% (905) |
| Pennsylvania: | 90.2% (4,322,003) |
In 2 person carpool:
| Kenilworth: | 5.2% (49) |
| Pennsylvania: | 7.7% (367,639) |
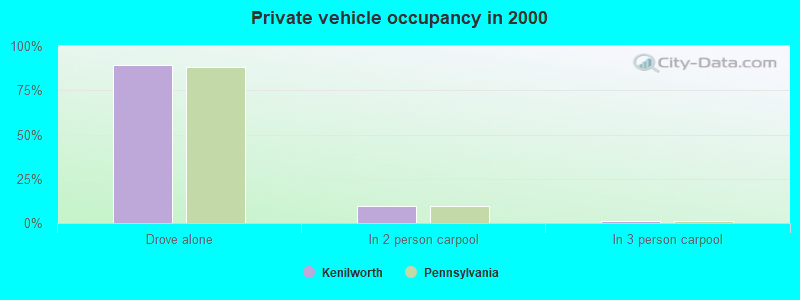
Drove alone:
| Kenilworth: | 89.2% (695) |
| Pennsylvania: | 88.0% (4,247,836) |
In 2 person carpool:
| Kenilworth: | 9.9% (77) |
| Pennsylvania: | 9.7% (470,174) |
In 3 person carpool:
| Kenilworth: | 0.9% (7) |
| Pennsylvania: | 1.4% (67,610) |
Class of workers
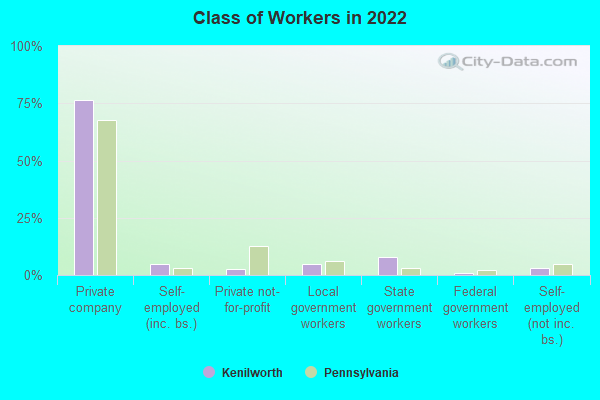
Employee of private company:
| Kenilworth: | 76.3% (942) |
| Pennsylvania: | 67.7% (4,333,849) |
Self-employed in own incorporated business:
| Kenilworth: | 4.7% (58) |
| Pennsylvania: | 3.2% (202,029) |
Private not-for-profit wage and salary workers:
| Kenilworth: | 2.6% (32) |
| Pennsylvania: | 12.7% (810,562) |
Local government workers:
| Kenilworth: | 4.8% (60) |
| Pennsylvania: | 6.2% (397,120) |
State government workers:
| Kenilworth: | 7.8% (97) |
| Pennsylvania: | 3.0% (193,490) |
Federal government workers:
| Kenilworth: | 0.8% (9) |
| Pennsylvania: | 2.1% (136,008) |
Self-employed workers in own not incorporated business:
| Kenilworth: | 3.0% (37) |
| Pennsylvania: | 5.0% (318,118) |
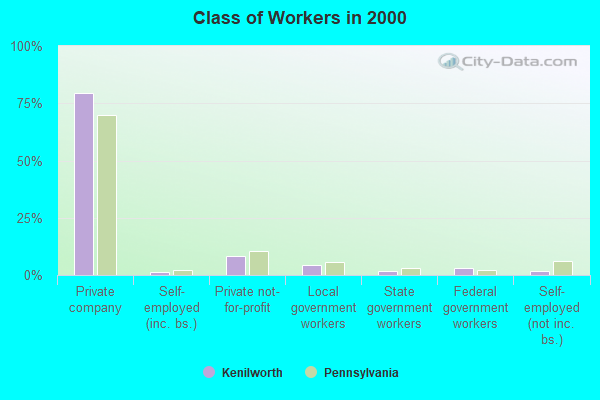
Employee of private company:
| Kenilworth: | 79.6% (643) |
| Pennsylvania: | 69.7% (3,942,119) |
Self-employed in own incorporated business:
| Kenilworth: | 1.4% (11) |
| Pennsylvania: | 2.4% (134,871) |
Private not-for-profit wage and salary workers:
| Kenilworth: | 8.2% (66) |
| Pennsylvania: | 10.3% (580,382) |
Local government workers:
| Kenilworth: | 4.5% (36) |
| Pennsylvania: | 5.8% (326,222) |
State government workers:
| Kenilworth: | 1.9% (15) |
| Pennsylvania: | 3.2% (182,232) |
Federal government workers:
| Kenilworth: | 2.8% (23) |
| Pennsylvania: | 2.3% (130,634) |
Self-employed workers in own not incorporated business:
| Kenilworth: | 1.7% (14) |
| Pennsylvania: | 6.0% (339,631) |
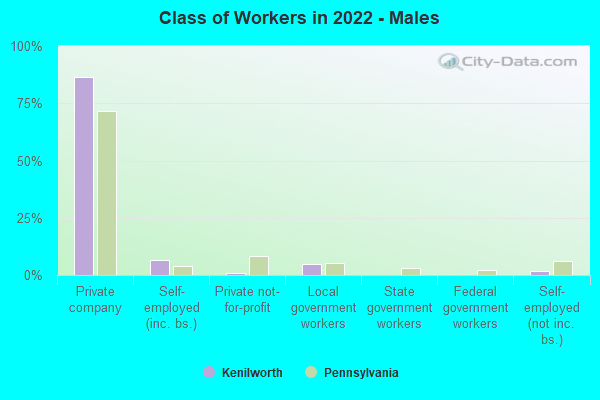
Employee of private company - Males:
| Kenilworth: | 86.4% (628) |
| Pennsylvania: | 71.5% (2,388,579) |
Self-employed in own incorporated business - Males:
| Kenilworth: | 6.5% (47) |
| Pennsylvania: | 4.0% (134,437) |
Private not-for-profit wage and salary workers - Males:
| Kenilworth: | 0.9% (6) |
| Pennsylvania: | 8.1% (270,498) |
Local government workers - Males:
| Kenilworth: | 4.7% (34) |
| Pennsylvania: | 5.0% (168,310) |
Self-employed workers in own not incorporated business - Males:
| Kenilworth: | 1.6% (11) |
| Pennsylvania: | 6.0% (199,421) |
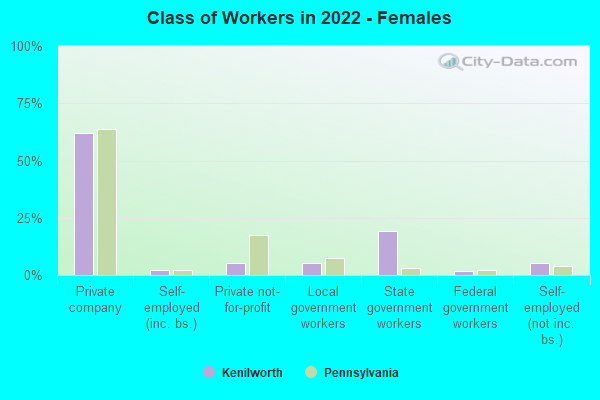
Employee of private company - Females:
| Kenilworth: | 61.9% (314) |
| Pennsylvania: | 63.5% (1,945,270) |
Self-employed in own incorporated business - Females:
| Kenilworth: | 2.0% (10) |
| Pennsylvania: | 2.2% (67,592) |
Private not-for-profit wage and salary workers - Females:
| Kenilworth: | 5.1% (26) |
| Pennsylvania: | 17.6% (540,064) |
Local government workers - Females:
| Kenilworth: | 5.1% (26) |
| Pennsylvania: | 7.5% (228,810) |
State government workers - Females:
| Kenilworth: | 19.1% (97) |
| Pennsylvania: | 3.1% (95,950) |
Federal government workers - Females:
| Kenilworth: | 1.8% (9) |
| Pennsylvania: | 2.0% (60,850) |
Self-employed workers in own not incorporated business - Females:
| Kenilworth: | 5.1% (26) |
| Pennsylvania: | 3.9% (118,697) |