Work and Jobs in Laytonville, California (CA) Detailed Stats
Occupations, Industries, Unemployment, Workers, Commute
Settings
X


Recent posts about work in Laytonville, California on our local forum with over 2,400,000 registered users:
 | Why doesn't California's northern third have a higher population? (89 replies) |
| Laytonville California (13 replies) |
| Best place to live in Northern California? (44 replies) |
| laytonville (4 replies) |
| best places to live (13 replies) |
| Norcal - Humboldt Weather Now ??? (8 replies) |
Latest news about work in Laytonville, CA collected exclusively by city-data.com from local newspapers, TV, and radio stations
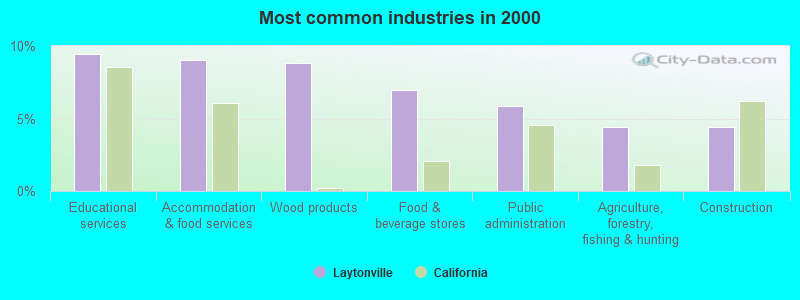
The most common industries in Laytonville are: Educational services (9.5% of civilian employees), Accommodation & food services (9.0% of civilian employees), Wood products (8.8% of civilian employees). 100.0% of workers work in Mendocino County and 27.9% of all workers work at home. 78.3% of workers are employees of private companies, which is 15.1% greater than the rate of 66.5% across the entire state of California.
Whole page based on the data from 2000 / 2022 when the population of Laytonville, California was 1,301 / 544
Whole page based on the data from 2000 / 2022 when the population of Laytonville, California was 1,301 / 544
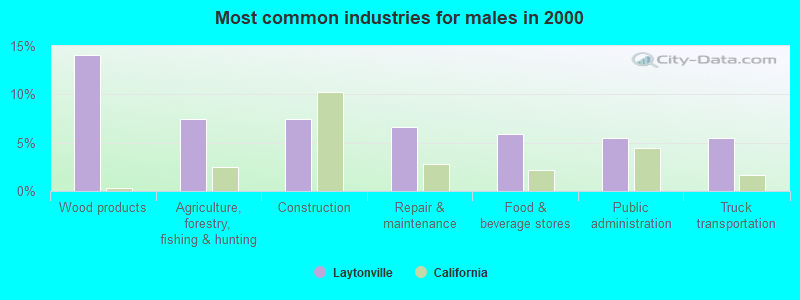
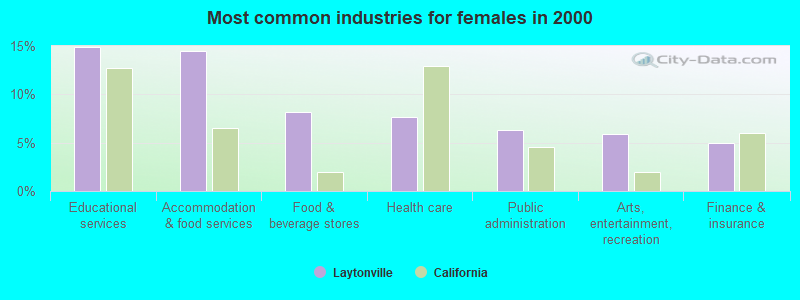
Most common industries
Most common industries | |||
|---|---|---|---|
Industry | All | Males | Females |
| Educational services | 9.5% (45) | 4.7% (12) | 14.9% (33) |
| Accommodation and food services | 9.0% (43) | 4.3% (11) | 14.5% (32) |
| Wood products | 8.8% (42) | 14.1% (36) | 2.7% (6) |
| Food and beverage stores | 6.9% (33) | 5.9% (15) | 8.1% (18) |
| Public administration | 5.9% (28) | 5.5% (14) | 6.3% (14) |
| Agriculture, forestry, fishing and hunting | 4.4% (21) | 7.5% (19) | 0.9% (2) |
| Construction | 4.4% (21) | 7.5% (19) | 0.9% (2) |
| Arts, entertainment, and recreation | 4.4% (21) | 3.1% (8) | 5.9% (13) |
| Health care | 4.2% (20) | 1.2% (3) | 7.7% (17) |
| Repair and maintenance | 3.6% (17) | 6.7% (17) | 0.0% (0) |
| Truck transportation | 2.9% (14) | 5.5% (14) | 0.0% (0) |
| Administrative and support and waste management services | 2.5% (12) | 3.1% (8) | 1.8% (4) |
| Real estate and rental and leasing | 2.5% (12) | 1.2% (3) | 4.1% (9) |
| Building material and garden equipment and supplies dealers | 2.5% (12) | 3.9% (10) | 0.9% (2) |
| Finance and insurance | 2.3% (11) | 0.0% (0) | 5.0% (11) |
| Publishing, and motion picture and sound recording industries | 2.1% (10) | 1.6% (4) | 2.7% (6) |
| Electronic shopping and mail-order houses | 1.9% (9) | 1.2% (3) | 2.7% (6) |
| Social assistance | 1.9% (9) | 1.2% (3) | 2.7% (6) |
| Computer and electronic products | 1.7% (8) | 2.4% (6) | 0.9% (2) |
| Lumber and other construction materials merchant wholesalers | 1.7% (8) | 3.1% (8) | 0.0% (0) |
| Metal and metal products | 1.5% (7) | 2.7% (7) | 0.0% (0) |
| Professional, scientific, and technical services | 1.3% (6) | 2.4% (6) | 0.0% (0) |
| Private households | 1.3% (6) | 1.2% (3) | 1.4% (3) |
| Machinery, equipment, and supplies merchant wholesalers | 1.1% (5) | 0.0% (0) | 2.3% (5) |
| Other direct selling establishments | 1.1% (5) | 0.0% (0) | 2.3% (5) |
| Religious, grantmaking, civic, professional, and similar organizations | 1.1% (5) | 0.4% (1) | 1.8% (4) |
| Mining, quarrying, and oil and gas extraction | 0.8% (4) | 1.6% (4) | 0.0% (0) |
| Fuel dealers | 0.8% (4) | 0.0% (0) | 1.8% (4) |
| Gasoline stations | 0.8% (4) | 1.2% (3) | 0.5% (1) |
| Department and other general merchandise stores | 0.6% (3) | 0.0% (0) | 1.4% (3) |
| Beverage and tobacco products | 0.6% (3) | 1.2% (3) | 0.0% (0) |
| Pharmacies and drug stores | 0.6% (3) | 0.0% (0) | 1.4% (3) |
| Machinery | 0.6% (3) | 0.0% (0) | 1.4% (3) |
| Rail transportation | 0.6% (3) | 1.2% (3) | 0.0% (0) |
| Other transportation, and support activities, and couriers | 0.6% (3) | 0.0% (0) | 1.4% (3) |
| Miscellaneous nondurable goods merchant wholesalers | 0.6% (3) | 1.2% (3) | 0.0% (0) |
| Motor vehicle and parts dealers | 0.6% (3) | 1.2% (3) | 0.0% (0) |
| Used merchandise, gift, novelty, and souvenir, and other miscellaneous stores | 0.4% (2) | 0.0% (0) | 0.9% (2) |
| Music stores | 0.4% (2) | 0.8% (2) | 0.0% (0) |
| Sporting goods, camera, and hobby and toy stores | 0.4% (2) | 0.0% (0) | 0.9% (2) |
| Radio, TV, and computer stores | 0.4% (2) | 0.8% (2) | 0.0% (0) |
| Recyclable material merchant wholesalers | 0.4% (2) | 0.8% (2) | 0.0% (0) |
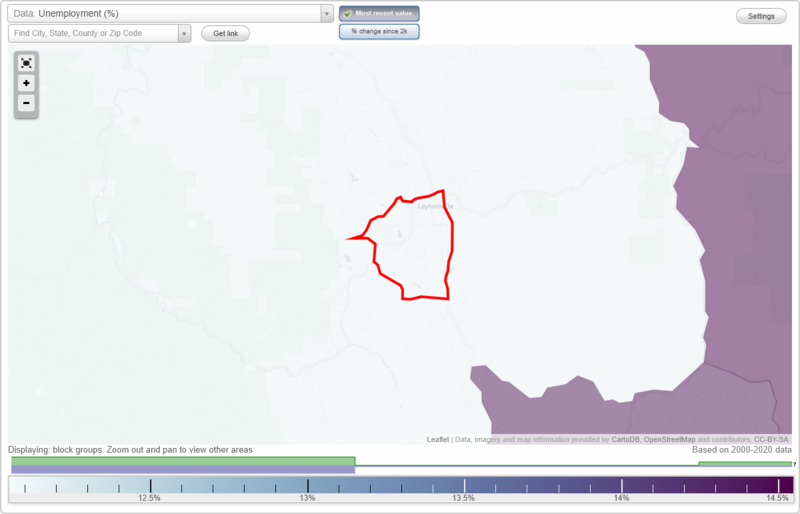
Unemployment in Laytonville
- Unemployment by race in 2022
- Unemployment rate for White non-Hispanic residents
- 3.0%Females
- Unemployment rate for American Indian and Alaska Native residents
- 14.7%Females
- Unemployment rate for two or more race residents
- 100.0%Females
- Unemployment rate for Hispanic or Latino residents
- 100.0%Females
- Unemployment by race in 2000
- Unemployment rate for White non-Hispanic residents
- 18.3%Males
- 7.3%Females
- Unemployment rate for American Indian and Alaska Native residents
- 39.0%Males
- 13.3%Females
- Unemployment rate for other race residents
- 33.3%Females
- Unemployment rate for two or more race residents
- 31.8%Males
- Unemployment rate for Hispanic or Latino residents
- 11.8%Males
- 10.5%Females
Time leaving home to go to work
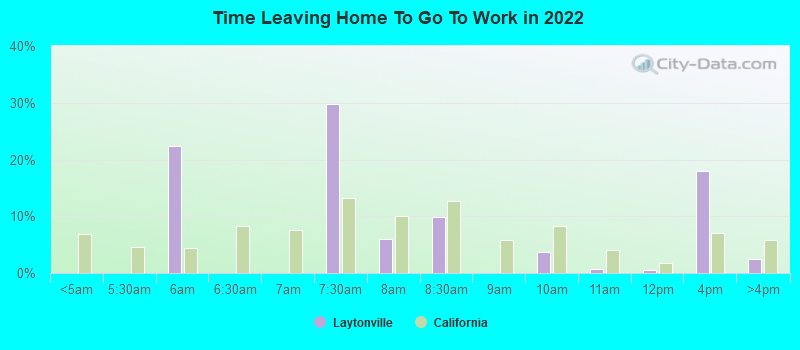
5:30 a.m. to 5:59 a.m.:
| Laytonville: | 22.4% (37) |
| California: | 4.3% (665,475) |
7:00 a.m. to 7:29 a.m.:
| Laytonville: | 29.8% (50) |
| California: | 13.2% (2,027,702) |
7:30 a.m. to 7:59 a.m.:
| Laytonville: | 5.9% (10) |
| California: | 10.1% (1,550,402) |
8:00 a.m. to 8:29 a.m.:
| Laytonville: | 9.9% (17) |
| California: | 12.7% (1,953,986) |
9:00 a.m. to 9:59 a.m.:
| Laytonville: | 3.7% (6) |
| California: | 8.4% (1,288,499) |
10:00 a.m. to 10:59 a.m.:
| Laytonville: | 0.7% (1) |
| California: | 4.0% (613,193) |
11:00 a.m. to 11:59 a.m.:
| Laytonville: | 0.6% (1) |
| California: | 1.8% (280,975) |
12:00 p.m. to 3:59 p.m.:
| Laytonville: | 18.0% (30) |
| California: | 7.0% (1,075,505) |
4:00 p.m. to 11:59 p.m.:
| Laytonville: | 2.5% (4) |
| California: | 5.8% (891,240) |
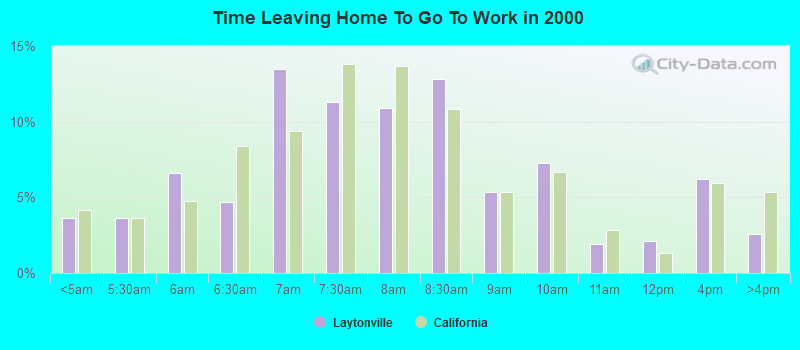
<5am:
| Laytonville: | 3.6% (17) |
| California: | 4.2% (606,086) |
5:30am:
| Laytonville: | 3.6% (17) |
| California: | 3.6% (523,209) |
6am:
| Laytonville: | 6.6% (31) |
| California: | 4.8% (692,256) |
6:30am:
| Laytonville: | 4.7% (22) |
| California: | 8.4% (1,216,867) |
7am:
| Laytonville: | 13.5% (63) |
| California: | 9.4% (1,362,830) |
7:30am:
| Laytonville: | 11.3% (53) |
| California: | 13.8% (2,006,950) |
8am:
| Laytonville: | 10.9% (51) |
| California: | 13.7% (1,986,831) |
8:30am:
| Laytonville: | 12.8% (60) |
| California: | 10.9% (1,577,815) |
9am:
| Laytonville: | 5.3% (25) |
| California: | 5.4% (778,152) |
10am:
| Laytonville: | 7.3% (34) |
| California: | 6.7% (972,355) |
11am:
| Laytonville: | 1.9% (9) |
| California: | 2.9% (414,479) |
12pm:
| Laytonville: | 2.1% (10) |
| California: | 1.3% (189,005) |
4pm:
| Laytonville: | 6.2% (29) |
| California: | 6.0% (865,284) |
>4pm:
| Laytonville: | 2.6% (12) |
| California: | 5.3% (776,167) |
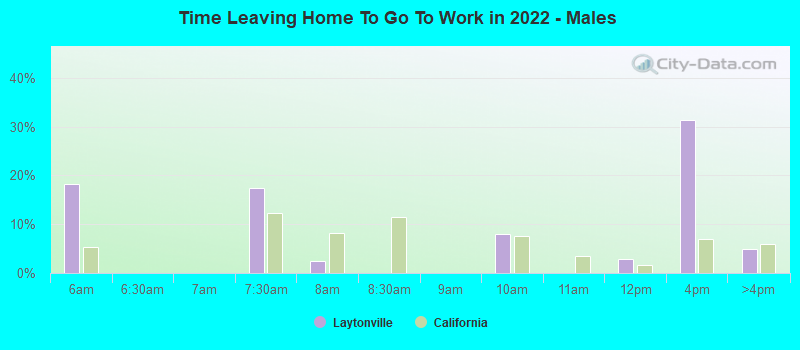
5:30 a.m. to 5:59 a.m. - Males:
| Laytonville: | 18.3% (13) |
| California: | 5.2% (448,269) |
7:00 a.m. to 7:29 a.m. - Males:
| Laytonville: | 17.5% (13) |
| California: | 12.4% (1,058,532) |
7:30 a.m. to 7:59 a.m. - Males:
| Laytonville: | 2.6% (2) |
| California: | 8.2% (702,727) |
9:00 a.m. to 9:59 a.m. - Males:
| Laytonville: | 8.1% (6) |
| California: | 7.7% (655,038) |
11:00 a.m. to 11:59 a.m. - Males:
| Laytonville: | 2.9% (2) |
| California: | 1.7% (141,620) |
12:00 p.m. to 3:59 p.m. - Males:
| Laytonville: | 31.4% (22) |
| California: | 7.0% (594,847) |
4:00 p.m. to 11:59 p.m. - Males:
| Laytonville: | 4.8% (3) |
| California: | 5.8% (499,471) |
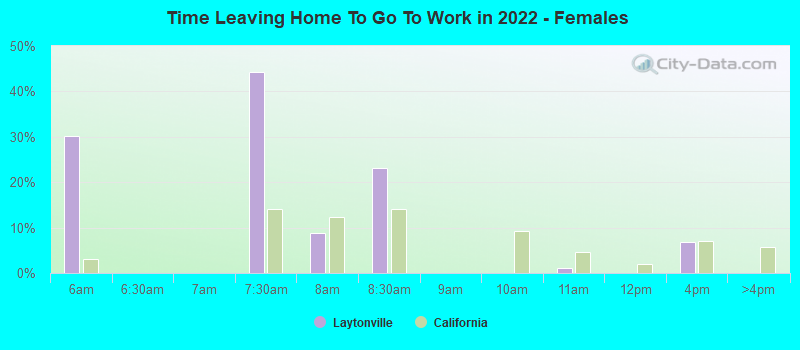
5:30 a.m. to 5:59 a.m. - Females:
| Laytonville: | 30.3% (29) |
| California: | 3.2% (217,206) |
7:00 a.m. to 7:29 a.m. - Females:
| Laytonville: | 44.2% (43) |
| California: | 14.1% (969,170) |
7:30 a.m. to 7:59 a.m. - Females:
| Laytonville: | 8.7% (8) |
| California: | 12.4% (847,675) |
8:00 a.m. to 8:29 a.m. - Females:
| Laytonville: | 23.0% (22) |
| California: | 14.1% (969,448) |
10:00 a.m. to 10:59 a.m. - Females:
| Laytonville: | 1.0% (1) |
| California: | 4.5% (311,768) |
12:00 p.m. to 3:59 p.m. - Females:
| Laytonville: | 6.9% (7) |
| California: | 7.0% (480,658) |
Travel time to work
Percentage of workers working in this county: 100.0%
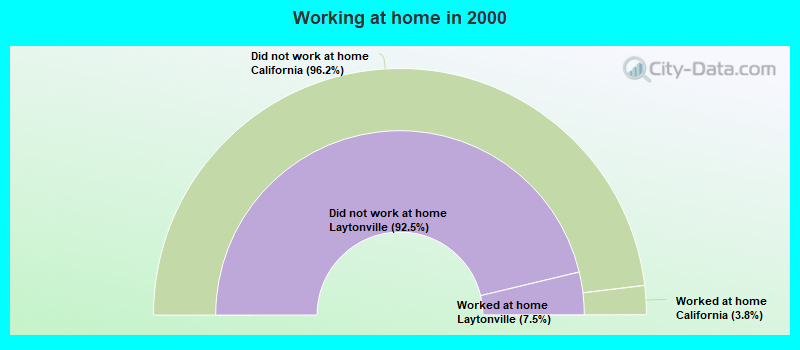
Number of people working at home: 65 (27.9% of all workers)
Number of people working at home: 65 (27.9% of all workers)
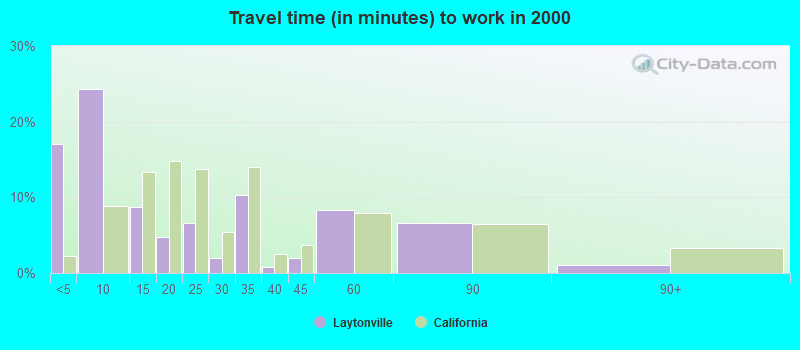
Less than 5 minutes:
| Laytonville: | 17.1% (80) |
| California: | 2.2% (324,703) |
5 to 9 minutes:
| Laytonville: | 24.4% (114) |
| California: | 8.8% (1,280,443) |
10 to 14 minutes:
| Laytonville: | 8.8% (41) |
| California: | 13.3% (1,930,263) |
15 to 19 minutes:
| Laytonville: | 4.7% (22) |
| California: | 14.9% (2,157,970) |
20 to 24 minutes:
| Laytonville: | 6.6% (31) |
| California: | 13.8% (2,004,060) |
25 to 29 minutes:
| Laytonville: | 1.9% (9) |
| California: | 5.4% (782,241) |
30 to 34 minutes:
| Laytonville: | 10.3% (48) |
| California: | 13.9% (2,025,657) |
35 to 39 minutes:
| Laytonville: | 0.9% (4) |
| California: | 2.5% (366,487) |
40 to 44 minutes:
| Laytonville: | 1.9% (9) |
| California: | 3.6% (528,043) |
45 to 59 minutes:
| Laytonville: | 8.3% (39) |
| California: | 7.9% (1,151,598) |
60 to 89 minutes:
| Laytonville: | 6.6% (31) |
| California: | 6.4% (933,123) |
90 or more minutes:
| Laytonville: | 1.1% (5) |
| California: | 3.3% (483,698) |
Means of transportation to work
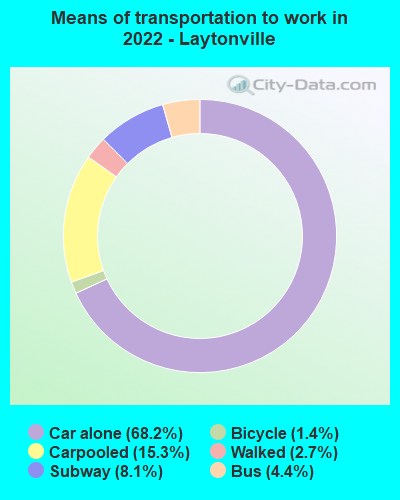

Drove car alone:
| Laytonville: | 68.2% (531) |
| California: | 79.1% (5,345,368) |
Carpooled:
| Laytonville: | 15.3% (119) |
| California: | 11.9% (878,699) |
Bus or trolley bus:
| Laytonville: | 4.4% (34) |
| California: | 2.2% (170,574) |
Subway or elevated:
| Laytonville: | 8.1% (63) |
| California: | 0.2% (16,750) |
Bicycle:
| Laytonville: | 1.4% (11) |
| California: | 0.9% (39,197) |
Walked:
| Laytonville: | 2.7% (21) |
| California: | 2.9% (218,374) |
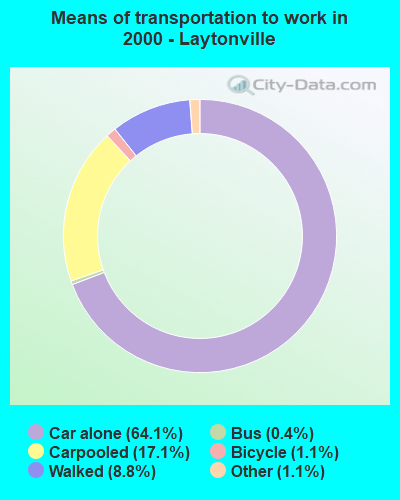

Drove car alone:
| Laytonville: | 64.1% (300) |
| California: | 71.8% (10,432,462) |
Carpooled:
| Laytonville: | 17.1% (80) |
| California: | 14.5% (2,113,313) |
Bus or trolley bus:
| Laytonville: | 0.4% (2) |
| California: | 3.8% (549,425) |
Bicycle:
| Laytonville: | 1.1% (5) |
| California: | 0.8% (120,567) |
Walked:
| Laytonville: | 8.8% (41) |
| California: | 2.9% (414,581) |
Other means:
| Laytonville: | 1.1% (5) |
| California: | 0.8% (115,064) |
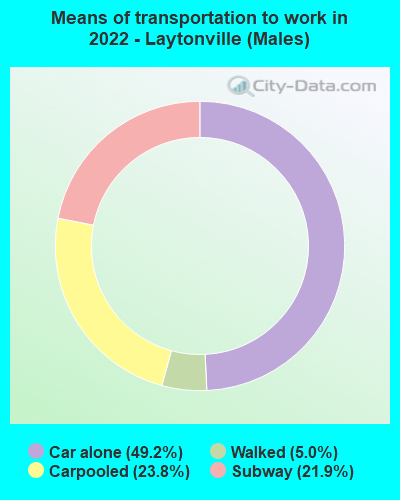

Drove car alone - Males:
| Laytonville: | 49.2% (138) |
| California: | 80.0% (5,345,368) |
Carpooled - Males:
| Laytonville: | 23.8% (67) |
| California: | 11.1% (878,699) |
Subway or elevated - Males:
| Laytonville: | 21.9% (62) |
| California: | 0.2% (16,750) |
Walked - Males:
| Laytonville: | 5.0% (14) |
| California: | 2.7% (218,374) |
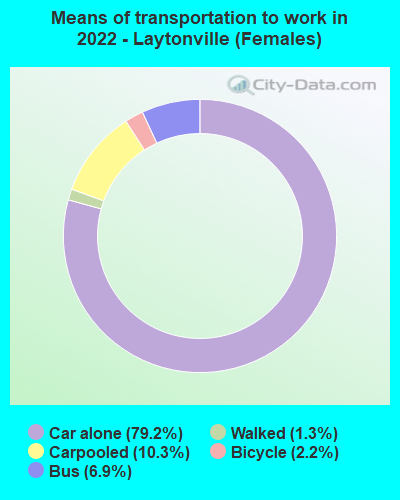

Drove car alone - Females:
| Laytonville: | 79.2% (398) |
| California: | 77.9% (5,345,368) |
Carpooled - Females:
| Laytonville: | 10.3% (52) |
| California: | 12.8% (878,699) |
Bus or trolley bus - Females:
| Laytonville: | 6.9% (35) |
| California: | 2.5% (170,574) |
Bicycle - Females:
| Laytonville: | 2.2% (11) |
| California: | 0.6% (39,197) |
Walked - Females:
| Laytonville: | 1.3% (7) |
| California: | 3.2% (218,374) |
Private vehicle occupancy
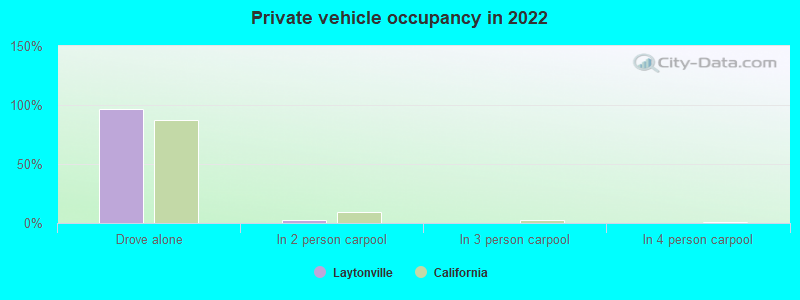
Drove alone:
| Laytonville: | 96.6% (150) |
| California: | 86.9% (12,187,486) |
In 2 person carpool:
| Laytonville: | 2.6% (4) |
| California: | 9.2% (1,295,561) |
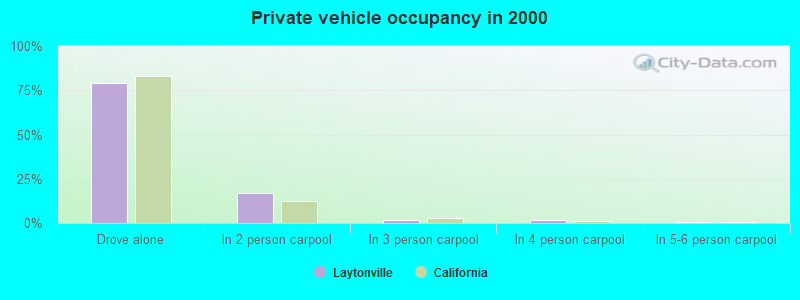
Drove alone:
| Laytonville: | 78.9% (300) |
| California: | 83.2% (10,432,462) |
In 2 person carpool:
| Laytonville: | 16.8% (64) |
| California: | 12.5% (1,564,905) |
In 3 person carpool:
| Laytonville: | 1.8% (7) |
| California: | 2.6% (330,732) |
In 4 person carpool:
| Laytonville: | 1.6% (6) |
| California: | 1.0% (119,364) |
In 5-6 person carpool:
| Laytonville: | 0.8% (3) |
| California: | 0.5% (57,036) |
Class of workers
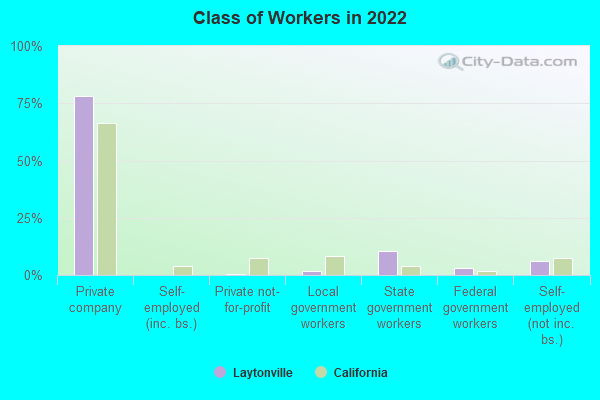
Employee of private company:
| Laytonville: | 78.3% (190) |
| California: | 66.5% (12,596,030) |
Private not-for-profit wage and salary workers:
| Laytonville: | 0.4% (1) |
| California: | 7.5% (1,417,407) |
Local government workers:
| Laytonville: | 1.7% (4) |
| California: | 8.2% (1,547,056) |
State government workers:
| Laytonville: | 10.6% (26) |
| California: | 4.1% (780,915) |
Federal government workers:
| Laytonville: | 3.0% (7) |
| California: | 2.0% (369,858) |
Self-employed workers in own not incorporated business:
| Laytonville: | 6.0% (14) |
| California: | 7.4% (1,410,735) |
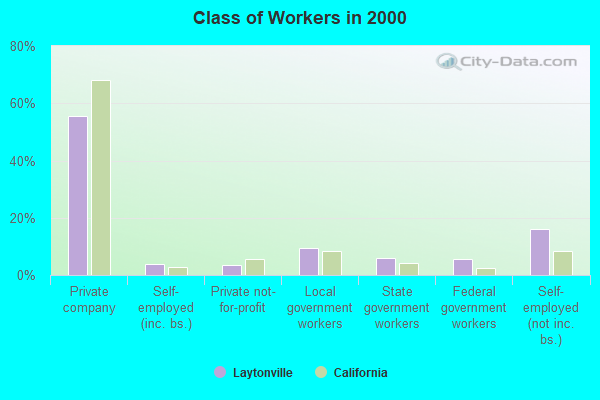
Employee of private company:
| Laytonville: | 55.7% (265) |
| California: | 68.0% (10,009,465) |
Self-employed in own incorporated business:
| Laytonville: | 4.0% (19) |
| California: | 2.7% (402,392) |
Private not-for-profit wage and salary workers:
| Laytonville: | 3.4% (16) |
| California: | 5.7% (845,536) |
Local government workers:
| Laytonville: | 9.5% (45) |
| California: | 8.3% (1,218,764) |
State government workers:
| Laytonville: | 5.9% (28) |
| California: | 4.0% (594,953) |
Federal government workers:
| Laytonville: | 5.7% (27) |
| California: | 2.3% (344,354) |
Self-employed workers in own not incorporated business:
| Laytonville: | 16.0% (76) |
| California: | 8.5% (1,249,530) |
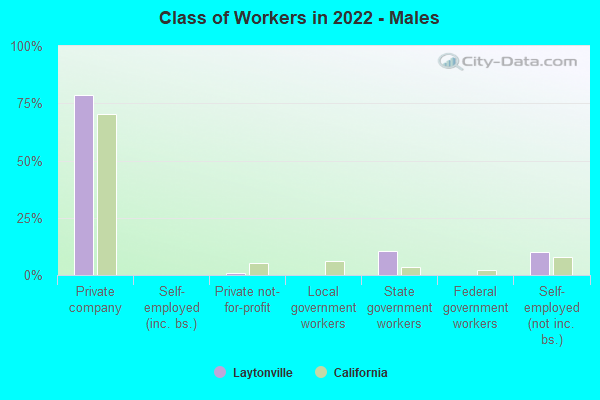
Employee of private company - Males:
| Laytonville: | 78.6% (107) |
| California: | 70.3% (7,191,252) |
Private not-for-profit wage and salary workers - Males:
| Laytonville: | 0.8% (1) |
| California: | 5.2% (529,122) |
State government workers - Males:
| Laytonville: | 10.7% (14) |
| California: | 3.4% (343,636) |
Self-employed workers in own not incorporated business - Males:
| Laytonville: | 9.9% (13) |
| California: | 8.1% (824,359) |
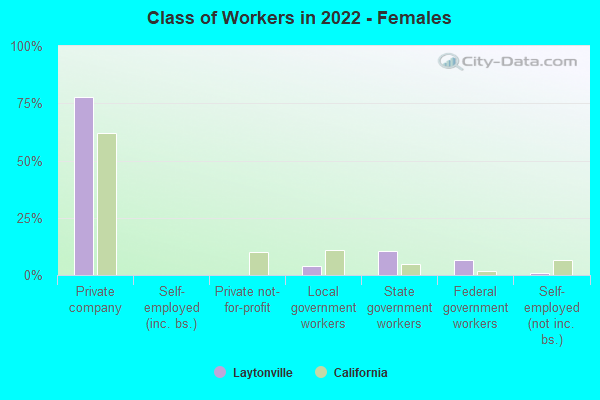
Employee of private company - Females:
| Laytonville: | 77.9% (84) |
| California: | 62.0% (5,404,778) |
Local government workers - Females:
| Laytonville: | 3.8% (4) |
| California: | 10.8% (936,725) |
State government workers - Females:
| Laytonville: | 10.6% (11) |
| California: | 5.0% (437,279) |
Federal government workers - Females:
| Laytonville: | 6.7% (7) |
| California: | 1.8% (159,984) |
Self-employed workers in own not incorporated business - Females:
| Laytonville: | 1.0% (1) |
| California: | 6.7% (586,376) |