Work and Jobs in Lompoc Valley, California (CA) Detailed Stats
Occupations, Industries, Unemployment, Workers, Commute
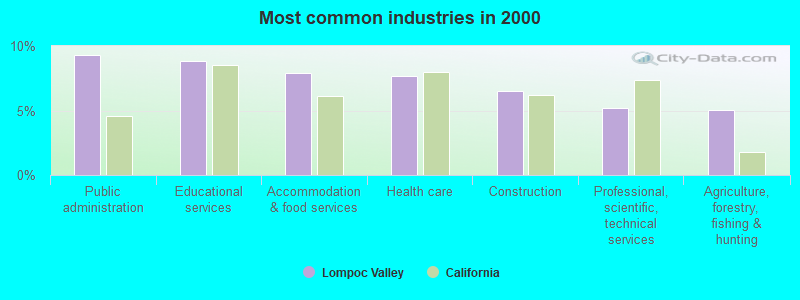
The most common industries in Lompoc Valley are: Public administration (9.3% of civilian employees), Educational services (8.8% of civilian employees), Accommodation & food services (7.9% of civilian employees). 61.9% of workers are employees of private companies, which is 9.8% less than the rate of 68.0% across the entire state of California.
Most common industries
Most common industries | |||
|---|---|---|---|
Industry | All | Males | Females |
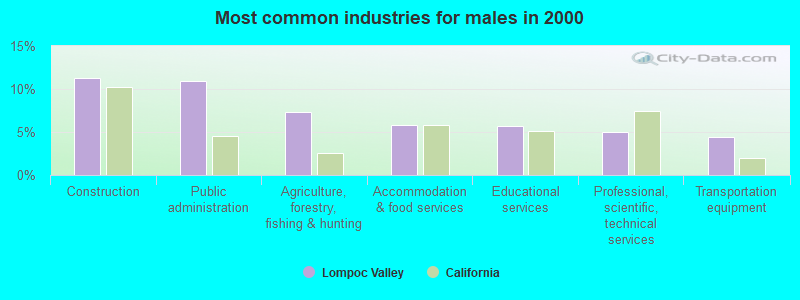
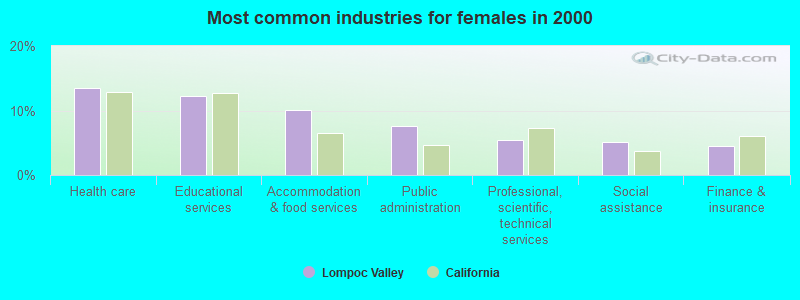
| Public administration | 9.3% (1,990) | 11.0% (1,207) | 7.6% (783) |
| Educational services | 8.8% (1,884) | 5.7% (626) | 12.2% (1,258) |
| Accommodation and food services | 7.9% (1,679) | 5.8% (642) | 10.1% (1,037) |
| Health care | 7.7% (1,631) | 2.2% (243) | 13.5% (1,388) |
| Construction | 6.5% (1,385) | 11.3% (1,239) | 1.4% (146) |
| Professional, scientific, and technical services | 5.2% (1,109) | 4.9% (544) | 5.5% (565) |
| Agriculture, forestry, fishing and hunting | 5.0% (1,074) | 7.3% (801) | 2.6% (273) |
| Administrative and support and waste management services | 3.2% (682) | 4.2% (463) | 2.1% (219) |
| Transportation equipment | 3.1% (662) | 4.4% (482) | 1.7% (180) |
| Social assistance | 2.8% (588) | 0.5% (60) | 5.1% (528) |
| Finance and insurance | 2.7% (573) | 1.0% (113) | 4.5% (460) |
| Food and beverage stores | 2.4% (508) | 2.2% (240) | 2.6% (268) |
| Arts, entertainment, and recreation | 2.2% (475) | 1.8% (199) | 2.7% (276) |
| Computer and electronic products | 2.2% (475) | 2.9% (320) | 1.5% (155) |
| Department and other general merchandise stores | 2.2% (472) | 1.6% (181) | 2.8% (291) |
| Real estate and rental and leasing | 2.0% (416) | 1.9% (214) | 2.0% (202) |
| Mining, quarrying, and oil and gas extraction | 2.0% (416) | 2.9% (324) | 0.9% (92) |
| Miscellaneous manufacturing | 1.8% (383) | 1.8% (203) | 1.7% (180) |
| Repair and maintenance | 1.7% (362) | 3.0% (329) | 0.3% (33) |
| Motor vehicle and parts dealers | 1.4% (302) | 2.2% (247) | 0.5% (55) |
| Personal and laundry services | 1.3% (276) | 0.6% (65) | 2.0% (211) |
| Religious, grantmaking, civic, professional, and similar organizations | 1.3% (273) | 1.0% (109) | 1.6% (164) |
| Publishing, and motion picture and sound recording industries | 1.1% (228) | 1.4% (151) | 0.7% (77) |
| Broadcasting and telecommunications | 1.0% (208) | 1.2% (129) | 0.8% (79) |
| Used merchandise, gift, novelty, and souvenir, and other miscellaneous stores | 1.0% (207) | 0.7% (78) | 1.3% (129) |
| Groceries and related products merchant wholesalers | 1.0% (207) | 1.3% (139) | 0.7% (68) |
| Private households | 0.9% (194) | 0.1% (16) | 1.7% (178) |
| Plastics and rubber products | 0.9% (188) | 0.9% (101) | 0.8% (87) |
| U. S. Postal service | 0.7% (158) | 0.9% (102) | 0.5% (56) |
| Other direct selling establishments | 0.7% (147) | 0.4% (43) | 1.0% (104) |
| Other transportation, and support activities, and couriers | 0.6% (135) | 1.0% (106) | 0.3% (29) |
| Metal and metal products | 0.6% (133) | 0.9% (97) | 0.3% (36) |
| Utilities | 0.6% (130) | 0.9% (102) | 0.3% (28) |
| Truck transportation | 0.6% (122) | 1.1% (116) | 0.1% (6) |
| Radio, TV, and computer stores | 0.5% (99) | 0.5% (60) | 0.4% (39) |
| Office supplies and stationery stores | 0.4% (93) | 0.5% (56) | 0.4% (37) |
| Clothing and accessories, including shoe, stores | 0.4% (93) | 0.3% (29) | 0.6% (64) |
| Building material and garden equipment and supplies dealers | 0.4% (89) | 0.6% (69) | 0.2% (20) |
| Miscellaneous nondurable goods merchant wholesalers | 0.4% (84) | 0.5% (58) | 0.3% (26) |
| Pharmacies and drug stores | 0.4% (77) | 0.1% (14) | 0.6% (63) |
| Furniture and home furnishings, and household appliance stores | 0.3% (73) | 0.5% (60) | 0.1% (13) |
| Beverage and tobacco products | 0.3% (69) | 0.3% (38) | 0.3% (31) |
| Sporting goods, camera, and hobby and toy stores | 0.3% (69) | 0.3% (30) | 0.4% (39) |
| Data processing, libraries, and other information services | 0.3% (63) | 0.1% (11) | 0.5% (52) |
| Furniture and related product manufacturing | 0.2% (48) | 0.4% (48) | 0.0% (0) |
| Retail florists | 0.2% (45) | 0.2% (18) | 0.3% (27) |
| Petroleum and petroleum products merchant wholesalers | 0.2% (45) | 0.4% (42) | 0.0% (3) |
| Nonmetallic mineral products | 0.2% (44) | 0.2% (20) | 0.2% (24) |
| Air transportation | 0.2% (41) | 0.2% (26) | 0.1% (15) |
| Food | 0.2% (40) | 0.1% (10) | 0.3% (30) |
| Machinery, equipment, and supplies merchant wholesalers | 0.2% (40) | 0.3% (33) | 0.1% (7) |
| Book stores and news dealers | 0.2% (39) | 0.3% (31) | 0.1% (8) |
| Gasoline stations | 0.2% (38) | 0.2% (18) | 0.2% (20) |
| Electrical and electronic goods merchant wholesalers | 0.2% (33) | 0.2% (18) | 0.1% (15) |
| Motor vehicles, parts and supplies merchant wholesalers | 0.1% (31) | 0.1% (7) | 0.2% (24) |
| Electronic shopping and mail-order houses | 0.1% (30) | 0.1% (15) | 0.1% (15) |
| Recyclable material merchant wholesalers | 0.1% (30) | 0.3% (30) | 0.0% (0) |
| Machinery | 0.1% (28) | 0.2% (23) | 0.0% (5) |
| Wood products | 0.1% (26) | 0.2% (26) | 0.0% (0) |
| Electrical equipment, appliances, and components | 0.1% (25) | 0.2% (18) | 0.1% (7) |
| Warehousing and storage | 0.1% (25) | 0.1% (12) | 0.1% (13) |
| Printing and related support activities | 0.1% (24) | 0.2% (19) | 0.0% (5) |
| Farm supplies merchant wholesalers | 0.1% (22) | 0.1% (9) | 0.1% (13) |
| Chemicals | 0.1% (22) | 0.2% (22) | 0.0% (0) |
| Petroleum and coal products | 0.1% (20) | 0.2% (20) | 0.0% (0) |
| Sewing, needlework, and piece goods stores | 0.1% (12) | 0.1% (12) | 0.0% (0) |
Unemployment in Lompoc Valley
- Unemployment by race in 2000
- Unemployment rate for White non-Hispanic residents
- 6.0%Males
- 5.6%Females
- Unemployment rate for Black residents
- 8.7%Males
- 8.3%Females
- Unemployment rate for American Indian and Alaska Native residents
- 9.7%Males
- 10.9%Females
- Unemployment rate for Asian residents
- 4.0%Males
- 4.0%Females
- Unemployment rate for other race residents
- 18.4%Males
- 20.8%Females
- Unemployment rate for two or more race residents
- 7.0%Males
- 8.7%Females
- Unemployment rate for Hispanic or Latino residents
- 14.3%Males
- 14.2%Females
Time leaving home to go to work
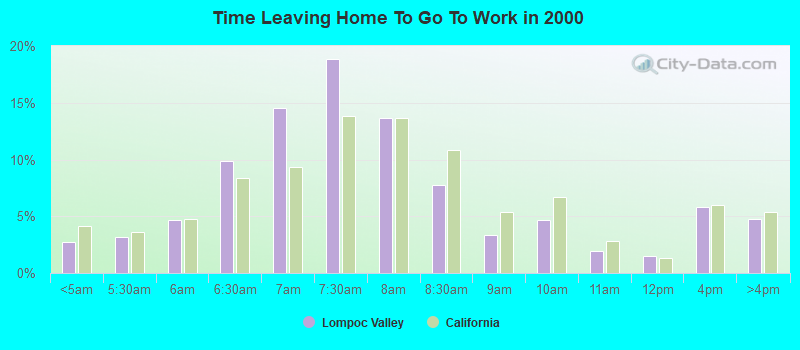
<5am:
| Lompoc Valley: | 2.8% (641) |
| California: | 4.2% (606,086) |
5:30am:
| Lompoc Valley: | 3.2% (744) |
| California: | 3.6% (523,209) |
6am:
| Lompoc Valley: | 4.7% (1,080) |
| California: | 4.8% (692,256) |
6:30am:
| Lompoc Valley: | 9.9% (2,287) |
| California: | 8.4% (1,216,867) |
7am:
| Lompoc Valley: | 14.5% (3,365) |
| California: | 9.4% (1,362,830) |
7:30am:
| Lompoc Valley: | 18.9% (4,371) |
| California: | 13.8% (2,006,950) |
8am:
| Lompoc Valley: | 13.7% (3,168) |
| California: | 13.7% (1,986,831) |
8:30am:
| Lompoc Valley: | 7.8% (1,801) |
| California: | 10.9% (1,577,815) |
9am:
| Lompoc Valley: | 3.4% (781) |
| California: | 5.4% (778,152) |
10am:
| Lompoc Valley: | 4.6% (1,077) |
| California: | 6.7% (972,355) |
11am:
| Lompoc Valley: | 1.9% (442) |
| California: | 2.9% (414,479) |
12pm:
| Lompoc Valley: | 1.5% (344) |
| California: | 1.3% (189,005) |
4pm:
| Lompoc Valley: | 5.8% (1,341) |
| California: | 6.0% (865,284) |
>4pm:
| Lompoc Valley: | 4.7% (1,094) |
| California: | 5.3% (776,167) |
Travel time to work
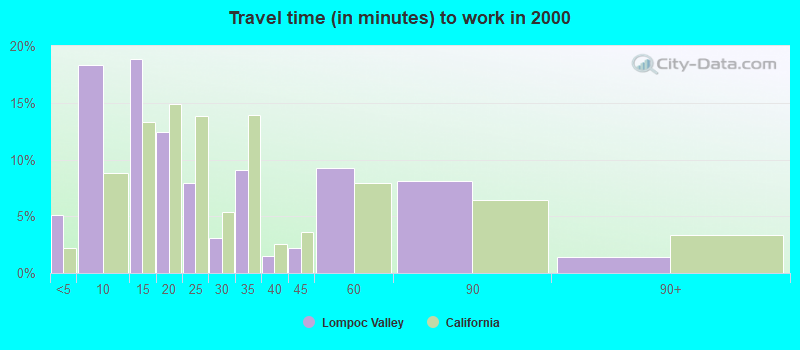
Less than 5 minutes:
| Lompoc Valley: | 5.1% (1,188) |
| California: | 2.2% (324,703) |
5 to 9 minutes:
| Lompoc Valley: | 18.3% (4,243) |
| California: | 8.8% (1,280,443) |
10 to 14 minutes:
| Lompoc Valley: | 18.9% (4,375) |
| California: | 13.3% (1,930,263) |
15 to 19 minutes:
| Lompoc Valley: | 12.4% (2,881) |
| California: | 14.9% (2,157,970) |
20 to 24 minutes:
| Lompoc Valley: | 7.9% (1,832) |
| California: | 13.8% (2,004,060) |
25 to 29 minutes:
| Lompoc Valley: | 3.1% (709) |
| California: | 5.4% (782,241) |
30 to 34 minutes:
| Lompoc Valley: | 9.1% (2,107) |
| California: | 13.9% (2,025,657) |
35 to 39 minutes:
| Lompoc Valley: | 1.5% (344) |
| California: | 2.5% (366,487) |
40 to 44 minutes:
| Lompoc Valley: | 2.2% (505) |
| California: | 3.6% (528,043) |
45 to 59 minutes:
| Lompoc Valley: | 9.3% (2,149) |
| California: | 7.9% (1,151,598) |
60 to 89 minutes:
| Lompoc Valley: | 8.1% (1,869) |
| California: | 6.4% (933,123) |
90 or more minutes:
| Lompoc Valley: | 1.4% (334) |
| California: | 3.3% (483,698) |
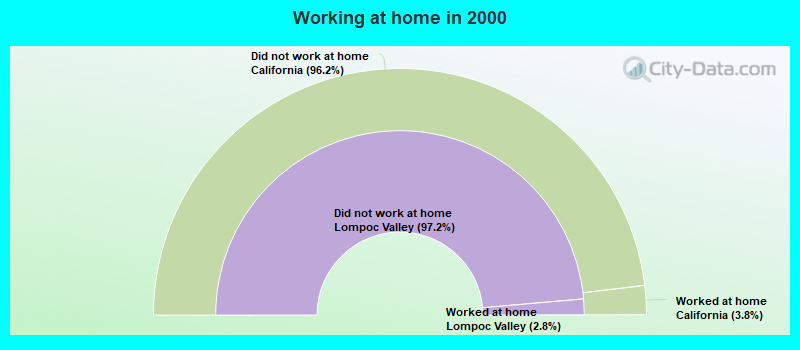
Means of transportation to work
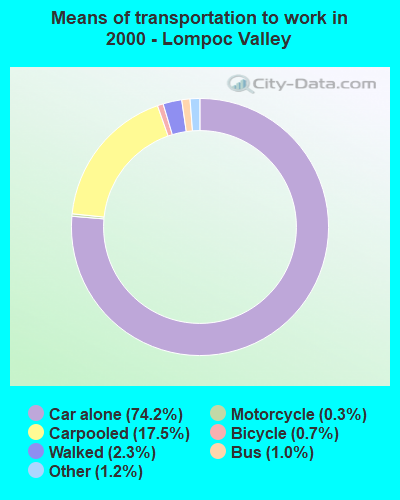

Drove car alone:
| Lompoc Valley: | 74.2% (17,206) |
| California: | 71.8% (10,432,462) |
Carpooled:
| Lompoc Valley: | 17.5% (4,045) |
| California: | 14.5% (2,113,313) |
Bus or trolley bus:
| Lompoc Valley: | 1.0% (236) |
| California: | 3.8% (549,425) |
Taxicab:
| Lompoc Valley: | 0.0% (5) |
| California: | 0.1% (9,890) |
Motorcycle:
| Lompoc Valley: | 0.3% (74) |
| California: | 0.2% (36,262) |
Bicycle:
| Lompoc Valley: | 0.7% (165) |
| California: | 0.8% (120,567) |
Walked:
| Lompoc Valley: | 2.3% (526) |
| California: | 2.9% (414,581) |
Other means:
| Lompoc Valley: | 1.2% (279) |
| California: | 0.8% (115,064) |
Private vehicle occupancy
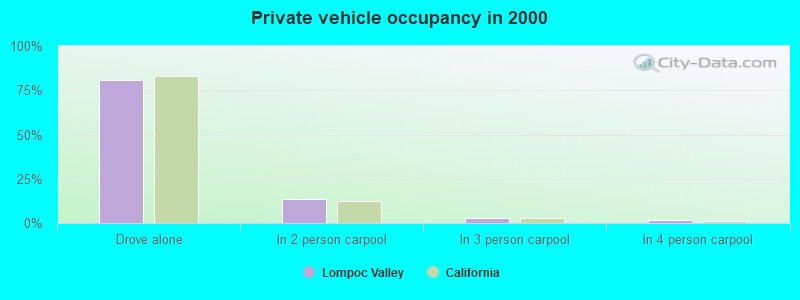
Drove alone:
| Lompoc Valley: | 81.0% (17,206) |
| California: | 83.2% (10,432,462) |
In 2 person carpool:
| Lompoc Valley: | 13.6% (2,900) |
| California: | 12.5% (1,564,905) |
In 3 person carpool:
| Lompoc Valley: | 2.9% (622) |
| California: | 2.6% (330,732) |
In 4 person carpool:
| Lompoc Valley: | 1.6% (339) |
| California: | 1.0% (119,364) |
In 5-6 person carpool:
| Lompoc Valley: | 0.6% (122) |
| California: | 0.5% (57,036) |
In 7+ person carpool:
| Lompoc Valley: | 0.3% (62) |
| California: | 0.3% (41,276) |
Class of workers

Employee of private company:
| Lompoc Valley: | 61.9% (13,199) |
| California: | 68.0% (10,009,465) |
Self-employed in own incorporated business:
| Lompoc Valley: | 1.8% (385) |
| California: | 2.7% (402,392) |
Private not-for-profit wage and salary workers:
| Lompoc Valley: | 6.5% (1,385) |
| California: | 5.7% (845,536) |
Local government workers:
| Lompoc Valley: | 9.1% (1,947) |
| California: | 8.3% (1,218,764) |
State government workers:
| Lompoc Valley: | 3.8% (813) |
| California: | 4.0% (594,953) |
Federal government workers:
| Lompoc Valley: | 9.2% (1,968) |
| California: | 2.3% (344,354) |
Self-employed workers in own not incorporated business:
| Lompoc Valley: | 7.4% (1,578) |
| California: | 8.5% (1,249,530) |
Unpaid family workers:
| Lompoc Valley: | 0.2% (36) |
| California: | 0.4% (53,934) |
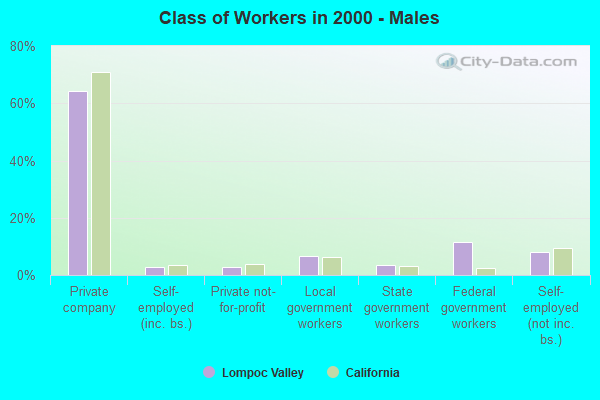
Employee of private company - Males:
| Lompoc Valley: | 64.4% (7,079) |
| California: | 71.1% (5,716,697) |
Self-employed in own incorporated business - Males:
| Lompoc Valley: | 2.8% (306) |
| California: | 3.6% (290,657) |
Private not-for-profit wage and salary workers - Males:
| Lompoc Valley: | 2.8% (313) |
| California: | 3.8% (303,997) |
Local government workers - Males:
| Lompoc Valley: | 6.5% (713) |
| California: | 6.2% (495,927) |
State government workers - Males:
| Lompoc Valley: | 3.5% (388) |
| California: | 3.2% (255,434) |
Federal government workers - Males:
| Lompoc Valley: | 11.7% (1,284) |
| California: | 2.5% (198,555) |
Self-employed workers in own not incorporated business - Males:
| Lompoc Valley: | 8.1% (892) |
| California: | 9.5% (760,853) |
Unpaid family workers - Males:
| Lompoc Valley: | 0.2% (25) |
| California: | 0.3% (23,230) |
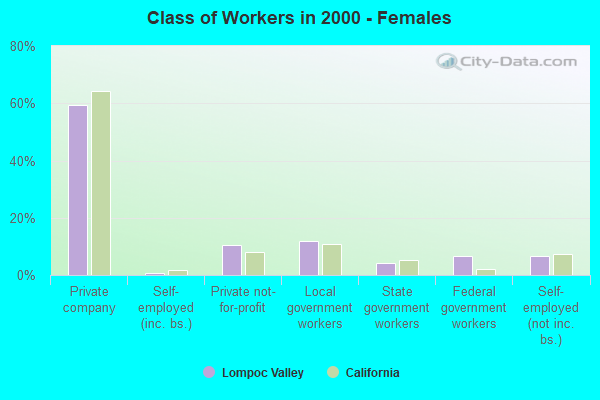
Employee of private company - Females:
| Lompoc Valley: | 59.4% (6,120) |
| California: | 64.3% (4,292,768) |
Self-employed in own incorporated business - Females:
| Lompoc Valley: | 0.8% (79) |
| California: | 1.7% (111,735) |
Private not-for-profit wage and salary workers - Females:
| Lompoc Valley: | 10.4% (1,072) |
| California: | 8.1% (541,539) |
Local government workers - Females:
| Lompoc Valley: | 12.0% (1,234) |
| California: | 10.8% (722,837) |
State government workers - Females:
| Lompoc Valley: | 4.1% (425) |
| California: | 5.1% (339,519) |
Federal government workers - Females:
| Lompoc Valley: | 6.6% (684) |
| California: | 2.2% (145,799) |
Self-employed workers in own not incorporated business - Females:
| Lompoc Valley: | 6.7% (686) |
| California: | 7.3% (488,677) |
Unpaid family workers - Females:
| Lompoc Valley: | 0.1% (11) |
| California: | 0.5% (30,704) |