Work and Jobs in Lone Star, Texas (TX) Detailed Stats
Occupations, Industries, Unemployment, Workers, Commute
Settings
X


Recent posts about work in Lone Star, Texas on our local forum with over 2,400,000 registered users:
 | Texas ranked as worst state to work in (71 replies) |
| Houston's economic diversity Thread .. (1243 replies) |
| Downtown developments in San Antonio (68 replies) |
| Abbott sent migrants to LA. (42 replies) |
| Texas Dominates The Best Cities For Good Jobs (36 replies) |
| Coronavirus in DFW - News & Discussion (3109 replies) |
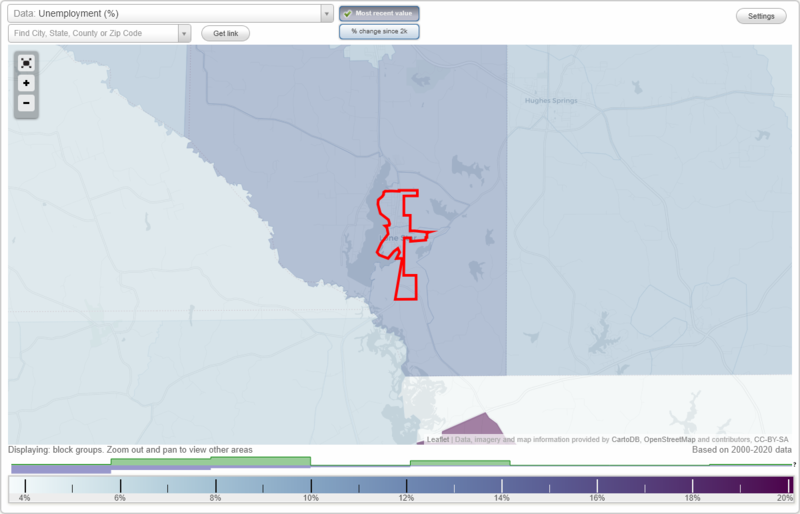
The most common industries in Lone Star are: Metal & metal products (14.2% of civilian employees), Health care (10.7% of civilian employees), Educational services (8.3% of civilian employees). 39.1% of workers work in Morris County. 90.4% of workers are employees of private companies, which is 23.1% greater than the rate of 69.6% across the entire state of Texas.
Whole page based on the data from 2000 / 2022 when the population of Lone Star, Texas was 1,631 / 1,697
Whole page based on the data from 2000 / 2022 when the population of Lone Star, Texas was 1,631 / 1,697
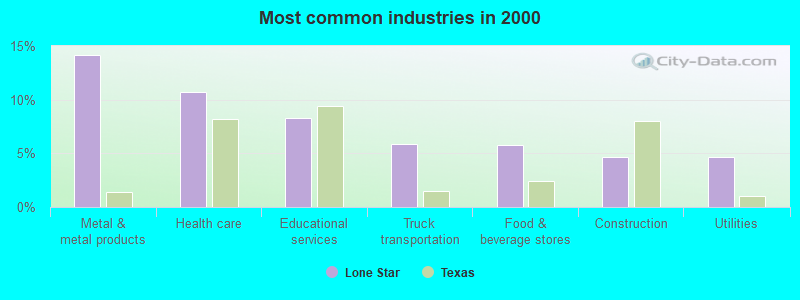
Most common industries
Most common industries | |||
|---|---|---|---|
Industry | All | Males | Females |
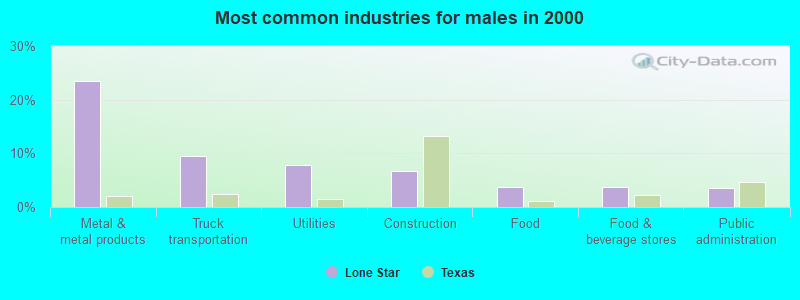
| Metal and metal products | 14.2% (89) | 23.5% (81) | 2.8% (8) |
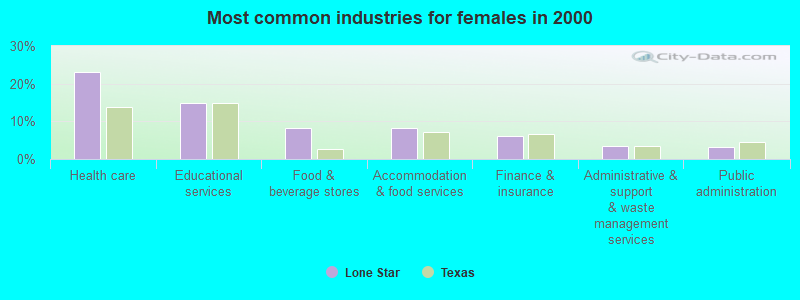
| Health care | 10.7% (67) | 0.6% (2) | 23.0% (65) |
| Educational services | 8.3% (52) | 2.9% (10) | 14.9% (42) |
| Truck transportation | 5.9% (37) | 9.6% (33) | 1.4% (4) |
| Food and beverage stores | 5.7% (36) | 3.8% (13) | 8.2% (23) |
| Construction | 4.6% (29) | 6.7% (23) | 2.1% (6) |
| Utilities | 4.6% (29) | 7.8% (27) | 0.7% (2) |
| Accommodation and food services | 4.1% (26) | 0.9% (3) | 8.2% (23) |
| Public administration | 3.3% (21) | 3.5% (12) | 3.2% (9) |
| Administrative and support and waste management services | 3.0% (19) | 2.6% (9) | 3.5% (10) |
| Finance and insurance | 3.0% (19) | 0.6% (2) | 6.0% (17) |
| Food | 2.7% (17) | 3.8% (13) | 1.4% (4) |
| Professional, scientific, and technical services | 2.1% (13) | 2.3% (8) | 1.8% (5) |
| Groceries and related products merchant wholesalers | 2.1% (13) | 2.3% (8) | 1.8% (5) |
| Mining, quarrying, and oil and gas extraction | 1.9% (12) | 2.9% (10) | 0.7% (2) |
| Repair and maintenance | 1.4% (9) | 2.0% (7) | 0.7% (2) |
| Building material and garden equipment and supplies dealers | 1.4% (9) | 1.2% (4) | 1.8% (5) |
| Recyclable material merchant wholesalers | 1.3% (8) | 1.7% (6) | 0.7% (2) |
| Religious, grantmaking, civic, professional, and similar organizations | 1.3% (8) | 0.9% (3) | 1.8% (5) |
| Electrical and electronic goods merchant wholesalers | 1.1% (7) | 2.0% (7) | 0.0% (0) |
| Machinery | 1.1% (7) | 2.0% (7) | 0.0% (0) |
| Transportation equipment | 1.1% (7) | 2.0% (7) | 0.0% (0) |
| Agriculture, forestry, fishing and hunting | 1.0% (6) | 1.4% (5) | 0.4% (1) |
| Broadcasting and telecommunications | 1.0% (6) | 0.0% (0) | 2.1% (6) |
| Petroleum and coal products | 1.0% (6) | 1.7% (6) | 0.0% (0) |
| Paper | 1.0% (6) | 1.2% (4) | 0.7% (2) |
| Apparel | 0.8% (5) | 0.0% (0) | 1.8% (5) |
| Computer and electronic products | 0.8% (5) | 0.6% (2) | 1.1% (3) |
| Other direct selling establishments | 0.8% (5) | 0.3% (1) | 1.4% (4) |
| Motor vehicle and parts dealers | 0.8% (5) | 0.9% (3) | 0.7% (2) |
| Plastics and rubber products | 0.6% (4) | 0.6% (2) | 0.7% (2) |
| Publishing, and motion picture and sound recording industries | 0.6% (4) | 0.6% (2) | 0.7% (2) |
| Data processing, libraries, and other information services | 0.6% (4) | 0.6% (2) | 0.7% (2) |
| Social assistance | 0.6% (4) | 0.0% (0) | 1.4% (4) |
| Private households | 0.6% (4) | 0.6% (2) | 0.7% (2) |
| Nonmetallic mineral products | 0.5% (3) | 0.9% (3) | 0.0% (0) |
| Furniture and home furnishings, and household appliance stores | 0.5% (3) | 0.6% (2) | 0.4% (1) |
| Electrical equipment, appliances, and components | 0.3% (2) | 0.6% (2) | 0.0% (0) |
| Wood products | 0.3% (2) | 0.6% (2) | 0.0% (0) |
| Miscellaneous manufacturing | 0.3% (2) | 0.0% (0) | 0.7% (2) |
| Metals and minerals, except petroleum, merchant wholesalers | 0.3% (2) | 0.6% (2) | 0.0% (0) |
| Water transportation | 0.3% (2) | 0.6% (2) | 0.0% (0) |
| U. S. Postal service | 0.3% (2) | 0.0% (0) | 0.7% (2) |
| Real estate and rental and leasing | 0.3% (2) | 0.6% (2) | 0.0% (0) |
| Farm supplies merchant wholesalers | 0.3% (2) | 0.6% (2) | 0.0% (0) |
| Department and other general merchandise stores | 0.3% (2) | 0.0% (0) | 0.7% (2) |
| Alcoholic beverages merchant wholesalers | 0.3% (2) | 0.6% (2) | 0.0% (0) |
| Rail transportation | 0.2% (1) | 0.3% (1) | 0.0% (0) |
| Clothing and accessories, including shoe, stores | 0.2% (1) | 0.3% (1) | 0.0% (0) |
| Arts, entertainment, and recreation | 0.2% (1) | 0.0% (0) | 0.4% (1) |
Unemployment in Lone Star
- Unemployment by race in 2022
- Unemployment rate for White non-Hispanic residents
- 2.0%Males
- 4.9%Females
- Unemployment rate for two or more race residents
- 52.5%Females
- Unemployment by race in 2000
- Unemployment rate for White non-Hispanic residents
- 4.7%Males
- 11.6%Females
- Unemployment rate for Black residents
- 20.3%Males
- 10.5%Females
- Unemployment rate for two or more race residents
- 33.3%Females
- Unemployment rate for Hispanic or Latino residents
- 22.2%Females
Time leaving home to go to work
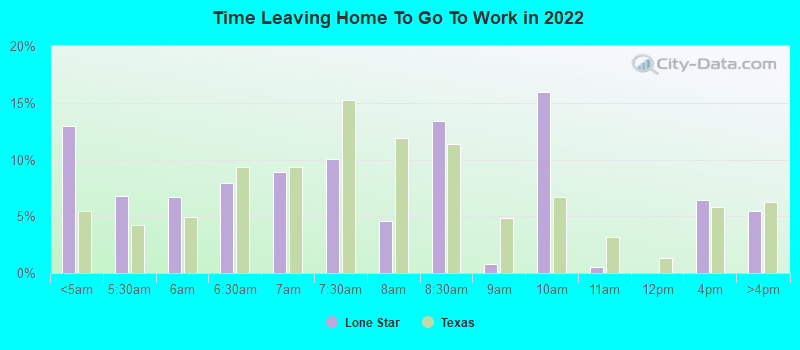
12:00 a.m. to 4:59 a.m.:
| Lone Star: | 13.0% (85) |
| Texas: | 5.5% (678,264) |
5:00 a.m. to 5:29 a.m.:
| Lone Star: | 6.8% (44) |
| Texas: | 4.3% (525,841) |
5:30 a.m. to 5:59 a.m.:
| Lone Star: | 6.7% (44) |
| Texas: | 4.9% (603,953) |
6:00 a.m. to 6:29 a.m.:
| Lone Star: | 7.9% (52) |
| Texas: | 9.4% (1,155,020) |
6:30 a.m. to 6:59 a.m.:
| Lone Star: | 8.9% (58) |
| Texas: | 9.3% (1,152,822) |
7:00 a.m. to 7:29 a.m.:
| Lone Star: | 10.0% (65) |
| Texas: | 15.3% (1,885,477) |
7:30 a.m. to 7:59 a.m.:
| Lone Star: | 4.6% (30) |
| Texas: | 11.9% (1,469,628) |
8:00 a.m. to 8:29 a.m.:
| Lone Star: | 13.4% (87) |
| Texas: | 11.3% (1,400,175) |
8:30 a.m. to 8:59 a.m.:
| Lone Star: | 0.8% (5) |
| Texas: | 4.9% (599,574) |
9:00 a.m. to 9:59 a.m.:
| Lone Star: | 15.9% (104) |
| Texas: | 6.7% (829,367) |
10:00 a.m. to 10:59 a.m.:
| Lone Star: | 0.5% (3) |
| Texas: | 3.2% (390,354) |
12:00 p.m. to 3:59 p.m.:
| Lone Star: | 6.5% (42) |
| Texas: | 5.8% (720,594) |
4:00 p.m. to 11:59 p.m.:
| Lone Star: | 5.4% (35) |
| Texas: | 6.3% (777,072) |
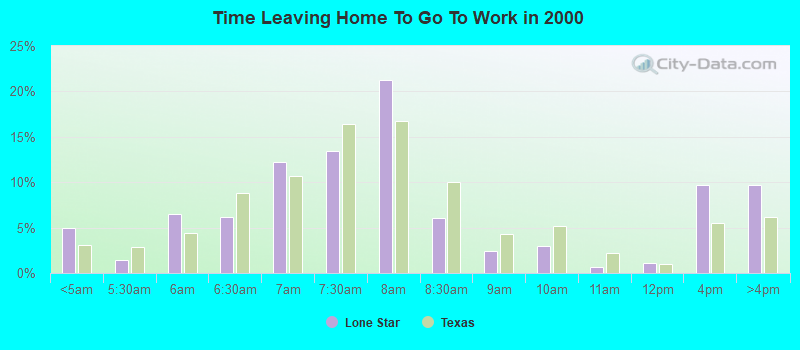
<5am:
| Lone Star: | 4.9% (30) |
| Texas: | 3.1% (281,361) |
5:30am:
| Lone Star: | 1.5% (9) |
| Texas: | 2.9% (262,060) |
6am:
| Lone Star: | 6.5% (40) |
| Texas: | 4.4% (403,423) |
6:30am:
| Lone Star: | 6.2% (38) |
| Texas: | 8.8% (808,876) |
7am:
| Lone Star: | 12.3% (75) |
| Texas: | 10.7% (976,557) |
7:30am:
| Lone Star: | 13.4% (82) |
| Texas: | 16.4% (1,500,904) |
8am:
| Lone Star: | 21.3% (130) |
| Texas: | 16.8% (1,536,308) |
8:30am:
| Lone Star: | 6.1% (37) |
| Texas: | 10.0% (913,601) |
9am:
| Lone Star: | 2.5% (15) |
| Texas: | 4.4% (398,656) |
10am:
| Lone Star: | 2.9% (18) |
| Texas: | 5.2% (472,592) |
11am:
| Lone Star: | 0.7% (4) |
| Texas: | 2.2% (197,844) |
12pm:
| Lone Star: | 1.1% (7) |
| Texas: | 0.9% (86,997) |
4pm:
| Lone Star: | 9.7% (59) |
| Texas: | 5.5% (503,565) |
>4pm:
| Lone Star: | 9.7% (59) |
| Texas: | 6.1% (563,107) |
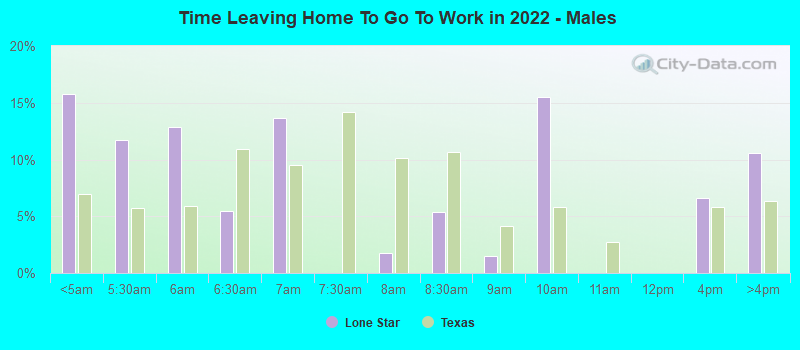
12:00 a.m. to 4:59 a.m. - Males:
| Lone Star: | 15.8% (54) |
| Texas: | 7.0% (477,284) |
5:00 a.m. to 5:29 a.m. - Males:
| Lone Star: | 11.7% (40) |
| Texas: | 5.8% (394,876) |
5:30 a.m. to 5:59 a.m. - Males:
| Lone Star: | 12.9% (44) |
| Texas: | 5.9% (402,788) |
6:00 a.m. to 6:29 a.m. - Males:
| Lone Star: | 5.5% (19) |
| Texas: | 10.9% (751,118) |
6:30 a.m. to 6:59 a.m. - Males:
| Lone Star: | 13.7% (47) |
| Texas: | 9.5% (652,306) |
7:30 a.m. to 7:59 a.m. - Males:
| Lone Star: | 1.8% (6) |
| Texas: | 10.2% (696,429) |
8:00 a.m. to 8:29 a.m. - Males:
| Lone Star: | 5.4% (18) |
| Texas: | 10.6% (729,041) |
8:30 a.m. to 8:59 a.m. - Males:
| Lone Star: | 1.5% (5) |
| Texas: | 4.1% (281,762) |
9:00 a.m. to 9:59 a.m. - Males:
| Lone Star: | 15.5% (53) |
| Texas: | 5.8% (401,071) |
12:00 p.m. to 3:59 p.m. - Males:
| Lone Star: | 6.6% (23) |
| Texas: | 5.8% (397,795) |
4:00 p.m. to 11:59 p.m. - Males:
| Lone Star: | 10.6% (36) |
| Texas: | 6.4% (435,950) |
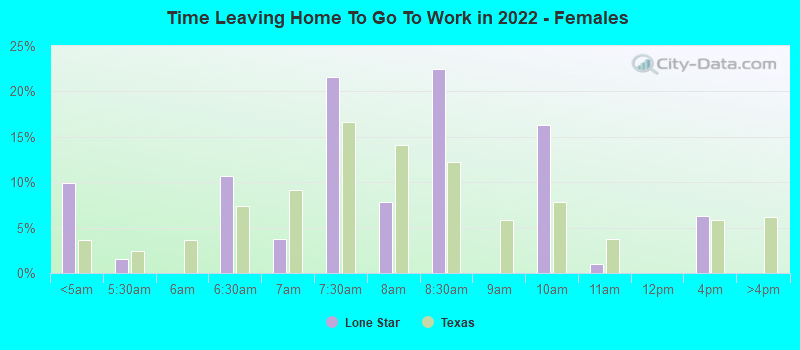
12:00 a.m. to 4:59 a.m. - Females:
| Lone Star: | 9.9% (31) |
| Texas: | 3.7% (200,980) |
5:00 a.m. to 5:29 a.m. - Females:
| Lone Star: | 1.5% (5) |
| Texas: | 2.4% (130,965) |
6:00 a.m. to 6:29 a.m. - Females:
| Lone Star: | 10.7% (33) |
| Texas: | 7.4% (403,902) |
6:30 a.m. to 6:59 a.m. - Females:
| Lone Star: | 3.8% (12) |
| Texas: | 9.1% (500,516) |
7:00 a.m. to 7:29 a.m. - Females:
| Lone Star: | 21.6% (67) |
| Texas: | 16.7% (914,879) |
7:30 a.m. to 7:59 a.m. - Females:
| Lone Star: | 7.8% (24) |
| Texas: | 14.1% (773,199) |
8:00 a.m. to 8:29 a.m. - Females:
| Lone Star: | 22.5% (69) |
| Texas: | 12.2% (671,134) |
9:00 a.m. to 9:59 a.m. - Females:
| Lone Star: | 16.3% (50) |
| Texas: | 7.8% (428,296) |
10:00 a.m. to 10:59 a.m. - Females:
| Lone Star: | 1.0% (3) |
| Texas: | 3.7% (203,885) |
12:00 p.m. to 3:59 p.m. - Females:
| Lone Star: | 6.3% (19) |
| Texas: | 5.9% (322,799) |
Travel time to work
Percentage of workers working in this county: 39.1%
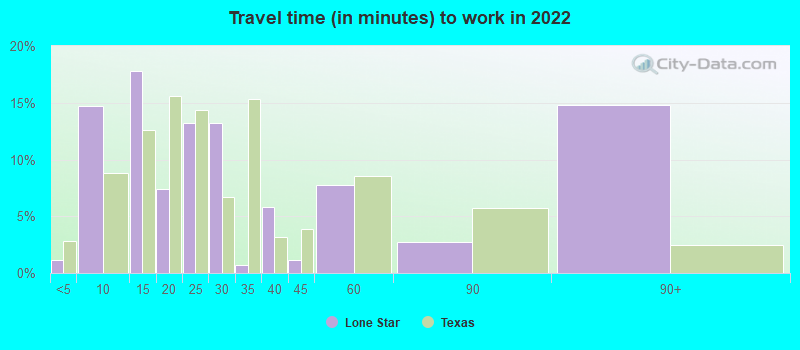
Less than 5 minutes:
| Lone Star: | 1.1% (10) |
| Texas: | 2.8% (350,462) |
5 to 9 minutes:
| Lone Star: | 14.7% (129) |
| Texas: | 8.8% (1,087,762) |
10 to 14 minutes:
| Lone Star: | 17.8% (156) |
| Texas: | 12.6% (1,550,271) |
15 to 19 minutes:
| Lone Star: | 7.4% (64) |
| Texas: | 15.6% (1,918,353) |
20 to 24 minutes:
| Lone Star: | 13.2% (116) |
| Texas: | 14.4% (1,772,079) |
25 to 29 minutes:
| Lone Star: | 13.2% (116) |
| Texas: | 6.7% (827,833) |
30 to 34 minutes:
| Lone Star: | 0.7% (6) |
| Texas: | 15.3% (1,887,878) |
35 to 39 minutes:
| Lone Star: | 5.8% (51) |
| Texas: | 3.2% (394,170) |
40 to 44 minutes:
| Lone Star: | 1.1% (10) |
| Texas: | 3.9% (476,118) |
45 to 59 minutes:
| Lone Star: | 7.7% (68) |
| Texas: | 8.6% (1,058,376) |
60 to 89 minutes:
| Lone Star: | 2.7% (24) |
| Texas: | 5.7% (706,002) |
90 or more minutes:
| Lone Star: | 14.8% (129) |
| Texas: | 2.4% (299,884) |
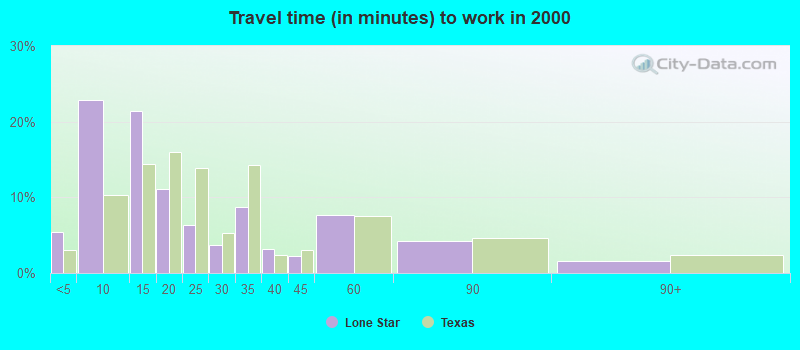
Less than 5 minutes:
| Lone Star: | 5.4% (33) |
| Texas: | 3.0% (277,642) |
5 to 9 minutes:
| Lone Star: | 22.9% (140) |
| Texas: | 10.3% (942,891) |
10 to 14 minutes:
| Lone Star: | 21.4% (131) |
| Texas: | 14.4% (1,317,555) |
15 to 19 minutes:
| Lone Star: | 11.1% (68) |
| Texas: | 16.0% (1,467,945) |
20 to 24 minutes:
| Lone Star: | 6.4% (39) |
| Texas: | 13.9% (1,276,781) |
25 to 29 minutes:
| Lone Star: | 3.8% (23) |
| Texas: | 5.3% (482,838) |
30 to 34 minutes:
| Lone Star: | 8.7% (53) |
| Texas: | 14.3% (1,309,699) |
35 to 39 minutes:
| Lone Star: | 3.1% (19) |
| Texas: | 2.4% (219,873) |
40 to 44 minutes:
| Lone Star: | 2.3% (14) |
| Texas: | 3.1% (280,916) |
45 to 59 minutes:
| Lone Star: | 7.7% (47) |
| Texas: | 7.6% (692,006) |
60 to 89 minutes:
| Lone Star: | 4.3% (26) |
| Texas: | 4.6% (418,905) |
90 or more minutes:
| Lone Star: | 1.6% (10) |
| Texas: | 2.4% (218,800) |
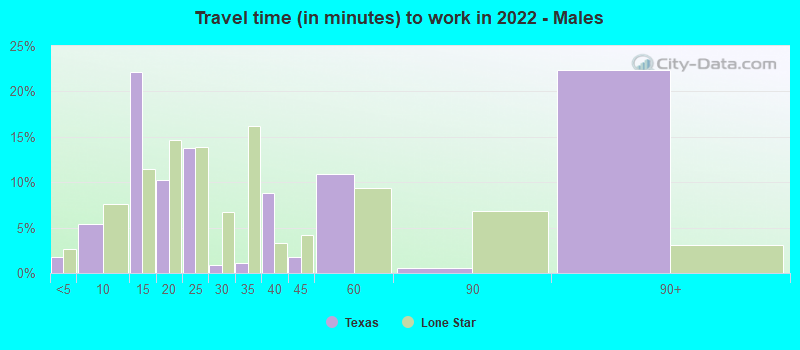
Less than 5 minutes - Males:
| Lone Star: | 1.7% (10) |
| Texas: | 2.7% (181,937) |
5 to 9 minutes - Males:
| Lone Star: | 5.4% (31) |
| Texas: | 7.6% (522,166) |
10 to 14 minutes - Males:
| Lone Star: | 22.2% (127) |
| Texas: | 11.5% (785,572) |
15 to 19 minutes - Males:
| Lone Star: | 10.2% (58) |
| Texas: | 14.6% (1,001,179) |
20 to 24 minutes - Males:
| Lone Star: | 13.8% (79) |
| Texas: | 13.9% (950,043) |
25 to 29 minutes - Males:
| Lone Star: | 0.9% (5) |
| Texas: | 6.7% (457,259) |
30 to 34 minutes - Males:
| Lone Star: | 1.1% (6) |
| Texas: | 16.2% (1,110,357) |
35 to 39 minutes - Males:
| Lone Star: | 8.8% (50) |
| Texas: | 3.3% (223,512) |
40 to 44 minutes - Males:
| Lone Star: | 1.8% (10) |
| Texas: | 4.2% (289,434) |
45 to 59 minutes - Males:
| Lone Star: | 10.8% (62) |
| Texas: | 9.3% (639,122) |
60 to 89 minutes - Males:
| Lone Star: | 0.5% (3) |
| Texas: | 6.8% (467,154) |
90 or more minutes - Males:
| Lone Star: | 22.3% (128) |
| Texas: | 3.1% (211,313) |
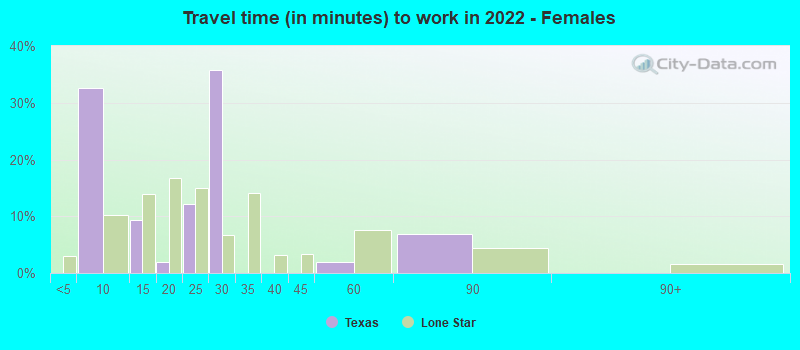
5 to 9 minutes - Females:
| Lone Star: | 32.6% (99) |
| Texas: | 10.3% (565,596) |
10 to 14 minutes - Females:
| Lone Star: | 9.3% (28) |
| Texas: | 13.9% (764,699) |
15 to 19 minutes - Females:
| Lone Star: | 2.0% (6) |
| Texas: | 16.7% (917,174) |
20 to 24 minutes - Females:
| Lone Star: | 12.1% (37) |
| Texas: | 15.0% (822,036) |
25 to 29 minutes - Females:
| Lone Star: | 35.8% (109) |
| Texas: | 6.7% (370,574) |
45 to 59 minutes - Females:
| Lone Star: | 2.0% (6) |
| Texas: | 7.6% (419,254) |
60 to 89 minutes - Females:
| Lone Star: | 6.8% (21) |
| Texas: | 4.4% (238,848) |
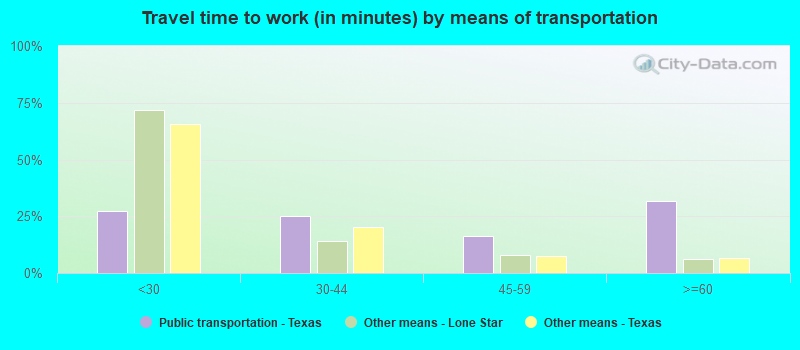
Means of transportation to work
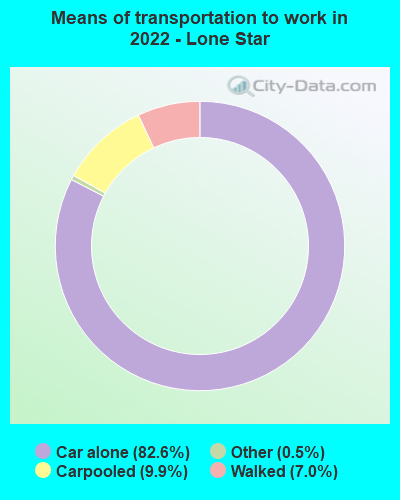

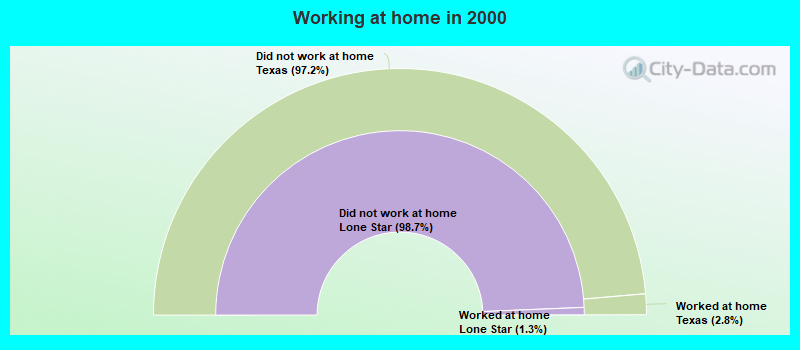
Drove car alone:
| Lone Star: | 82.6% (754) |
| Texas: | 83.3% (4,557,023) |
Carpooled:
| Lone Star: | 9.9% (90) |
| Texas: | 11.7% (674,818) |
Walked:
| Lone Star: | 7.0% (64) |
| Texas: | 1.7% (99,911) |
Other means:
| Lone Star: | 0.5% (4) |
| Texas: | 2.0% (95,481) |
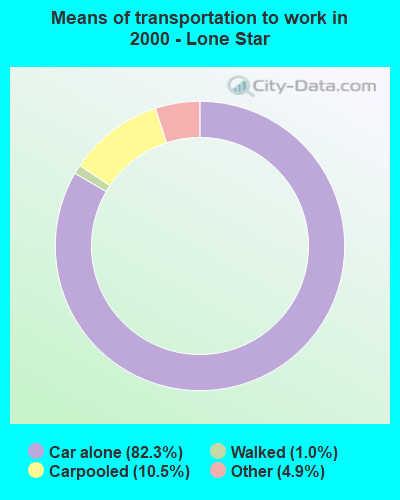

Drove car alone:
| Lone Star: | 82.3% (503) |
| Texas: | 77.7% (7,115,590) |
Carpooled:
| Lone Star: | 10.5% (64) |
| Texas: | 14.5% (1,326,012) |
Walked:
| Lone Star: | 1.0% (6) |
| Texas: | 1.9% (173,670) |
Other means:
| Lone Star: | 4.9% (30) |
| Texas: | 0.9% (86,692) |
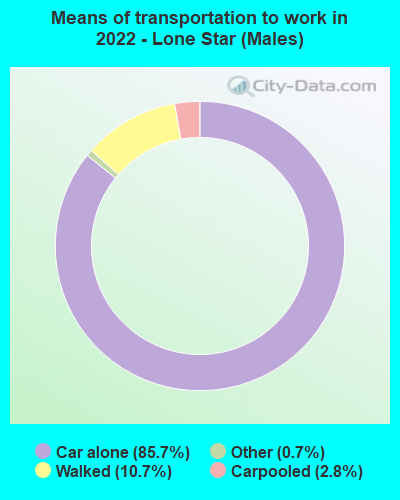

Drove car alone - Males:
| Lone Star: | 85.7% (509) |
| Texas: | 83.6% (4,557,023) |
Carpooled - Males:
| Lone Star: | 2.8% (17) |
| Texas: | 11.2% (674,818) |
Walked - Males:
| Lone Star: | 10.7% (64) |
| Texas: | 1.7% (99,911) |
Other means - Males:
| Lone Star: | 0.7% (4) |
| Texas: | 2.2% (95,481) |
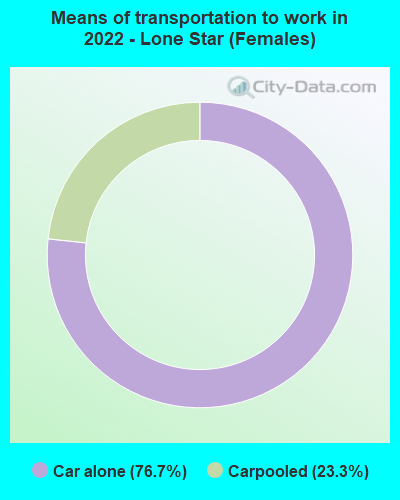

Drove car alone - Females:
| Lone Star: | 76.7% (244) |
| Texas: | 83.0% (4,557,023) |
Carpooled - Females:
| Lone Star: | 23.3% (74) |
| Texas: | 12.3% (674,818) |
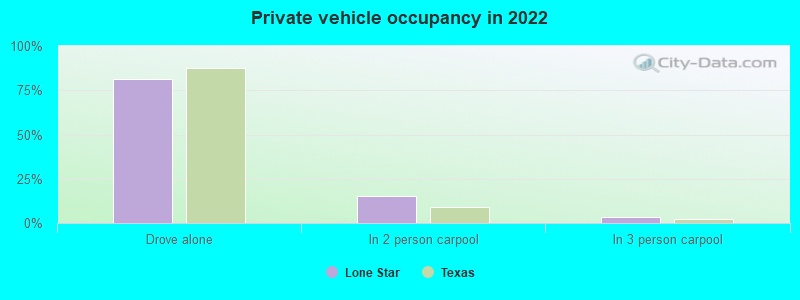
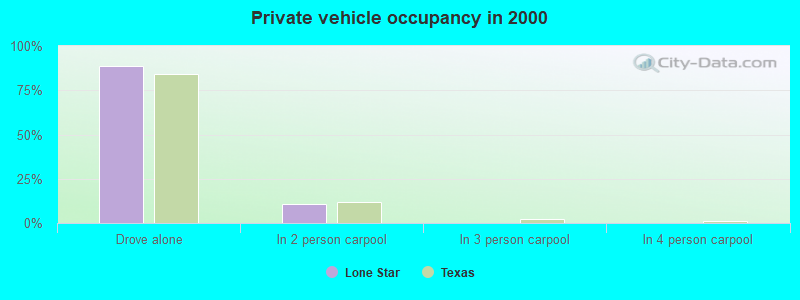
Private vehicle occupancy
Drove alone:
| Lone Star: | 81.4% (472) |
| Texas: | 87.6% (10,283,021) |
In 2 person carpool:
| Lone Star: | 15.3% (89) |
| Texas: | 9.0% (1,052,595) |
In 3 person carpool:
| Lone Star: | 3.3% (19) |
| Texas: | 2.1% (244,139) |
Drove alone:
| Lone Star: | 88.7% (503) |
| Texas: | 84.3% (7,115,590) |
In 2 person carpool:
| Lone Star: | 10.9% (62) |
| Texas: | 11.6% (982,994) |
In 3 person carpool:
| Lone Star: | 0.2% (1) |
| Texas: | 2.4% (201,602) |
In 4 person carpool:
| Lone Star: | 0.2% (1) |
| Texas: | 1.0% (83,518) |
Class of workers
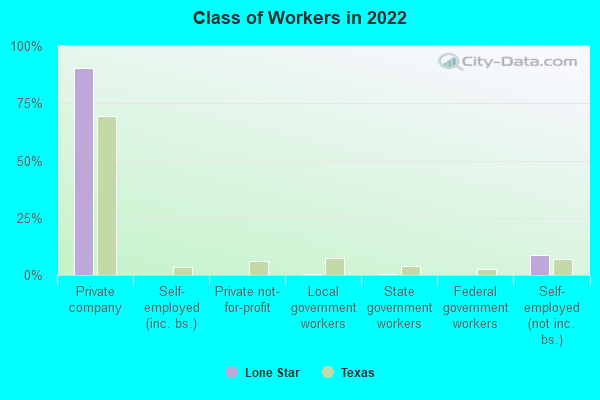
Employee of private company:
| Lone Star: | 90.4% (611) |
| Texas: | 69.6% (10,139,666) |
Local government workers:
| Lone Star: | 0.3% (2) |
| Texas: | 7.6% (1,109,799) |
State government workers:
| Lone Star: | 0.5% (3) |
| Texas: | 3.8% (558,618) |
Self-employed workers in own not incorporated business:
| Lone Star: | 8.8% (60) |
| Texas: | 6.8% (998,270) |
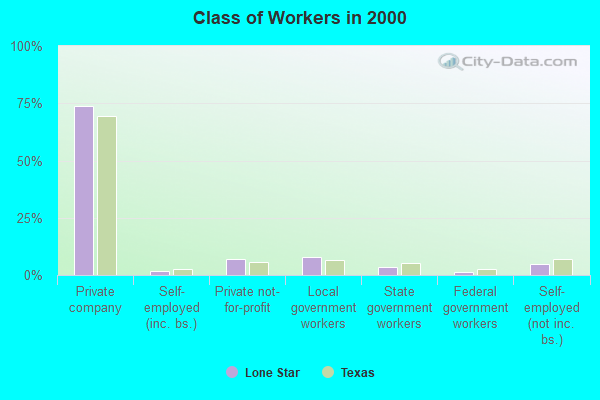
Employee of private company:
| Lone Star: | 73.7% (462) |
| Texas: | 69.6% (6,425,274) |
Self-employed in own incorporated business:
| Lone Star: | 1.6% (10) |
| Texas: | 2.7% (250,864) |
Private not-for-profit wage and salary workers:
| Lone Star: | 7.2% (45) |
| Texas: | 5.7% (526,631) |
Local government workers:
| Lone Star: | 8.0% (50) |
| Texas: | 6.6% (608,479) |
State government workers:
| Lone Star: | 3.5% (22) |
| Texas: | 5.4% (501,082) |
Federal government workers:
| Lone Star: | 1.1% (7) |
| Texas: | 2.6% (237,177) |
Self-employed workers in own not incorporated business:
| Lone Star: | 4.9% (31) |
| Texas: | 7.1% (653,527) |
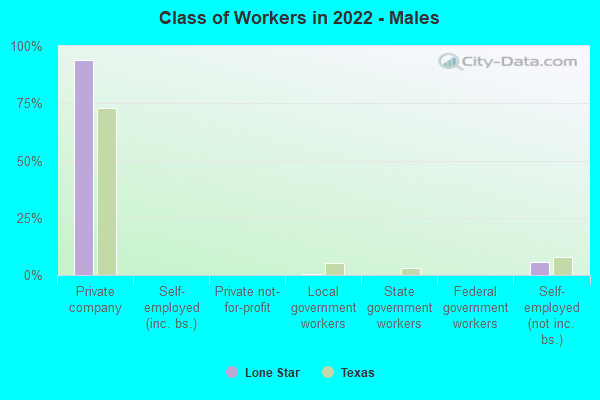
Employee of private company - Males:
| Lone Star: | 93.8% (333) |
| Texas: | 73.1% (5,788,450) |
Local government workers - Males:
| Lone Star: | 0.6% (2) |
| Texas: | 5.1% (405,467) |
Self-employed workers in own not incorporated business - Males:
| Lone Star: | 5.6% (20) |
| Texas: | 7.7% (609,246) |
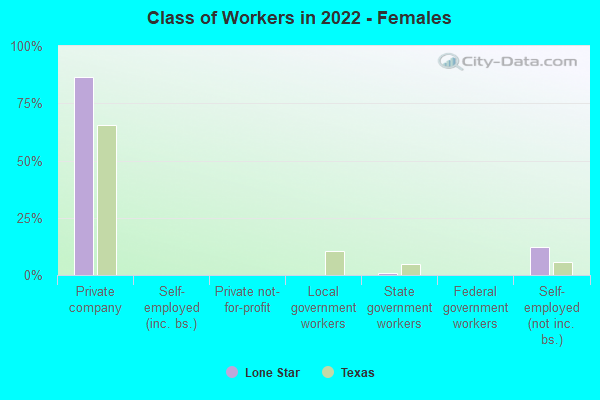
Employee of private company - Females:
| Lone Star: | 86.6% (278) |
| Texas: | 65.4% (4,351,216) |
State government workers - Females:
| Lone Star: | 1.0% (3) |
| Texas: | 4.8% (321,912) |
Self-employed workers in own not incorporated business - Females:
| Lone Star: | 12.4% (40) |
| Texas: | 5.8% (389,024) |