Work and Jobs in Louisville, Kentucky (KY) Detailed Stats
Occupations, Industries, Unemployment, Workers, Commute
Settings
X


Recent posts about work in Louisville, Kentucky on our local forum with over 2,400,000 registered users:
 | Teaching jobs around Louisville? (7 replies) |
| Louisville to try giving away free money - Universal Basic Income (0 replies) |
| How much salary shall I ask for to live comfortable in Louisville? (26 replies) |
| Job Offer in Louisville (11 replies) |
| Is a 50k year salary a good one in Louisville KY? (23 replies) |
| Louisville Exceeded My Expectations!! Thinking of moving.. (21 replies) |
Latest news about work in Louisville, KY collected exclusively by city-data.com from local newspapers, TV, and radio stations
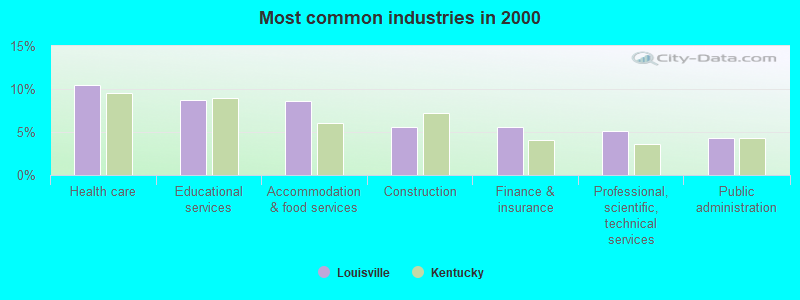
The most common industries in Louisville are: Health care (10.5% of civilian employees), Educational services (8.7% of civilian employees), Accommodation & food services (8.6% of civilian employees). 68.6% of workers are employees of private companies, which is about the same as the rate of 68.7% across the entire state of Kentucky.
Most common industries
Most common industries | |||
|---|---|---|---|
Industry | All | Males | Females |
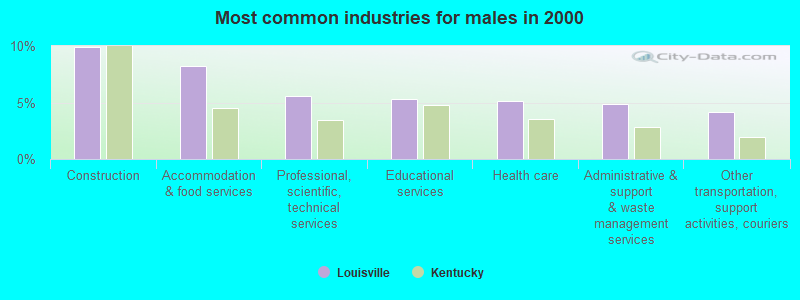
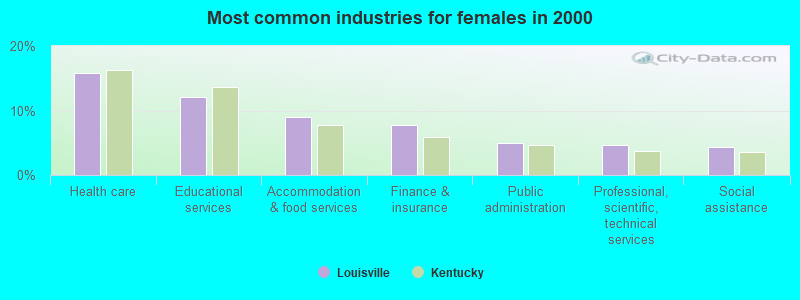
| Health care | 10.5% (11,905) | 5.1% (2,918) | 15.9% (8,987) |
| Educational services | 8.7% (9,887) | 5.3% (3,028) | 12.1% (6,859) |
| Accommodation and food services | 8.6% (9,767) | 8.3% (4,698) | 8.9% (5,069) |
| Construction | 5.6% (6,373) | 9.9% (5,649) | 1.3% (724) |
| Finance and insurance | 5.6% (6,321) | 3.5% (1,974) | 7.7% (4,347) |
| Professional, scientific, and technical services | 5.1% (5,837) | 5.6% (3,165) | 4.7% (2,672) |
| Public administration | 4.3% (4,881) | 3.7% (2,080) | 4.9% (2,801) |
| Administrative and support and waste management services | 4.2% (4,732) | 4.8% (2,754) | 3.5% (1,978) |
| Other transportation, and support activities, and couriers | 3.3% (3,741) | 4.2% (2,390) | 2.4% (1,351) |
| Arts, entertainment, and recreation | 2.7% (3,033) | 3.0% (1,693) | 2.4% (1,340) |
| Social assistance | 2.5% (2,794) | 0.6% (348) | 4.3% (2,446) |
| Religious, grantmaking, civic, professional, and similar organizations | 2.4% (2,777) | 2.0% (1,150) | 2.9% (1,627) |
| Food and beverage stores | 2.4% (2,766) | 2.7% (1,527) | 2.2% (1,239) |
| Personal and laundry services | 1.8% (2,001) | 1.2% (682) | 2.3% (1,319) |
| Department and other general merchandise stores | 1.7% (1,938) | 1.0% (580) | 2.4% (1,358) |
| Real estate and rental and leasing | 1.7% (1,936) | 1.9% (1,073) | 1.5% (863) |
| Transportation equipment | 1.6% (1,831) | 2.6% (1,461) | 0.7% (370) |
| Repair and maintenance | 1.6% (1,821) | 2.5% (1,444) | 0.7% (377) |
| Metal and metal products | 1.5% (1,722) | 2.2% (1,279) | 0.8% (443) |
| Food | 1.4% (1,544) | 1.7% (980) | 1.0% (564) |
| Broadcasting and telecommunications | 1.3% (1,430) | 1.2% (688) | 1.3% (742) |
| Publishing, and motion picture and sound recording industries | 1.0% (1,104) | 1.2% (665) | 0.8% (439) |
| Miscellaneous manufacturing | 0.9% (1,053) | 1.3% (721) | 0.6% (332) |
| Machinery | 0.9% (1,051) | 1.3% (758) | 0.5% (293) |
| Motor vehicle and parts dealers | 0.9% (1,044) | 1.4% (819) | 0.4% (225) |
| Printing and related support activities | 0.9% (994) | 0.9% (511) | 0.9% (483) |
| Truck transportation | 0.9% (971) | 1.5% (833) | 0.2% (138) |
| Chemicals | 0.8% (879) | 1.0% (577) | 0.5% (302) |
| Electrical equipment, appliances, and components | 0.7% (846) | 0.8% (475) | 0.7% (371) |
| U. S. Postal service | 0.7% (783) | 0.8% (441) | 0.6% (342) |
| Utilities | 0.7% (757) | 0.8% (467) | 0.5% (290) |
| Building material and garden equipment and supplies dealers | 0.6% (704) | 0.9% (522) | 0.3% (182) |
| Clothing and accessories, including shoe, stores | 0.6% (680) | 0.5% (297) | 0.7% (383) |
| Used merchandise, gift, novelty, and souvenir, and other miscellaneous stores | 0.6% (657) | 0.5% (299) | 0.6% (358) |
| Plastics and rubber products | 0.6% (633) | 0.6% (333) | 0.5% (300) |
| Furniture and home furnishings, and household appliance stores | 0.6% (632) | 0.7% (375) | 0.5% (257) |
| Data processing, libraries, and other information services | 0.6% (631) | 0.4% (245) | 0.7% (386) |
| Groceries and related products merchant wholesalers | 0.5% (588) | 0.9% (493) | 0.2% (95) |
| Paper | 0.5% (580) | 0.6% (367) | 0.4% (213) |
| Beverage and tobacco products | 0.5% (559) | 0.6% (338) | 0.4% (221) |
| Wood products | 0.4% (484) | 0.7% (418) | 0.1% (66) |
| Machinery, equipment, and supplies merchant wholesalers | 0.4% (483) | 0.5% (287) | 0.3% (196) |
| Radio, TV, and computer stores | 0.4% (471) | 0.6% (339) | 0.2% (132) |
| Private households | 0.4% (442) | 0.0% (18) | 0.7% (424) |
| Pharmacies and drug stores | 0.4% (405) | 0.3% (151) | 0.4% (254) |
| Furniture and related product manufacturing | 0.3% (396) | 0.5% (302) | 0.2% (94) |
| Nonmetallic mineral products | 0.3% (360) | 0.4% (254) | 0.2% (106) |
| Agriculture, forestry, fishing and hunting | 0.3% (358) | 0.5% (280) | 0.1% (78) |
| Professional and commercial equipment and supplies merchant wholesalers | 0.3% (338) | 0.3% (193) | 0.3% (145) |
| Gasoline stations | 0.3% (327) | 0.3% (158) | 0.3% (169) |
| Computer and electronic products | 0.3% (312) | 0.4% (206) | 0.2% (106) |
| Other direct selling establishments | 0.3% (294) | 0.3% (148) | 0.3% (146) |
| Electrical and electronic goods merchant wholesalers | 0.3% (284) | 0.4% (217) | 0.1% (67) |
| Motor vehicles, parts and supplies merchant wholesalers | 0.2% (266) | 0.4% (242) | 0.0% (24) |
| Sporting goods, camera, and hobby and toy stores | 0.2% (251) | 0.3% (151) | 0.2% (100) |
| Warehousing and storage | 0.2% (249) | 0.4% (221) | 0.0% (28) |
| Miscellaneous durable goods merchant wholesalers | 0.2% (237) | 0.2% (118) | 0.2% (119) |
| Air transportation | 0.2% (237) | 0.3% (161) | 0.1% (76) |
| Miscellaneous nondurable goods merchant wholesalers | 0.2% (230) | 0.3% (167) | 0.1% (63) |
| Lumber and other construction materials merchant wholesalers | 0.2% (224) | 0.3% (193) | 0.1% (31) |
| Health and personal care, except drug, stores | 0.2% (213) | 0.1% (57) | 0.3% (156) |
| Music stores | 0.2% (173) | 0.2% (108) | 0.1% (65) |
| Book stores and news dealers | 0.1% (159) | 0.1% (80) | 0.1% (79) |
| Alcoholic beverages merchant wholesalers | 0.1% (157) | 0.3% (143) | 0.0% (14) |
| Drugs, sundries, and chemical and allied products merchant wholesalers | 0.1% (156) | 0.1% (60) | 0.2% (96) |
| Apparel | 0.1% (144) | 0.1% (55) | 0.2% (89) |
| Hardware, plumbing and heating equipment, and supplies merchant wholesalers | 0.1% (143) | 0.2% (124) | 0.0% (19) |
| Jewelry, luggage, and leather goods stores | 0.1% (137) | 0.1% (37) | 0.2% (100) |
| Rail transportation | 0.1% (135) | 0.2% (112) | 0.0% (23) |
| Paper and paper products merchant wholesalers | 0.1% (109) | 0.1% (83) | 0.0% (26) |
| Mining, quarrying, and oil and gas extraction | 0.1% (109) | 0.2% (95) | 0.0% (14) |
| Recyclable material merchant wholesalers | 0.1% (107) | 0.2% (100) | 0.0% (7) |
| Petroleum and petroleum products merchant wholesalers | 0.1% (86) | 0.1% (64) | 0.0% (22) |
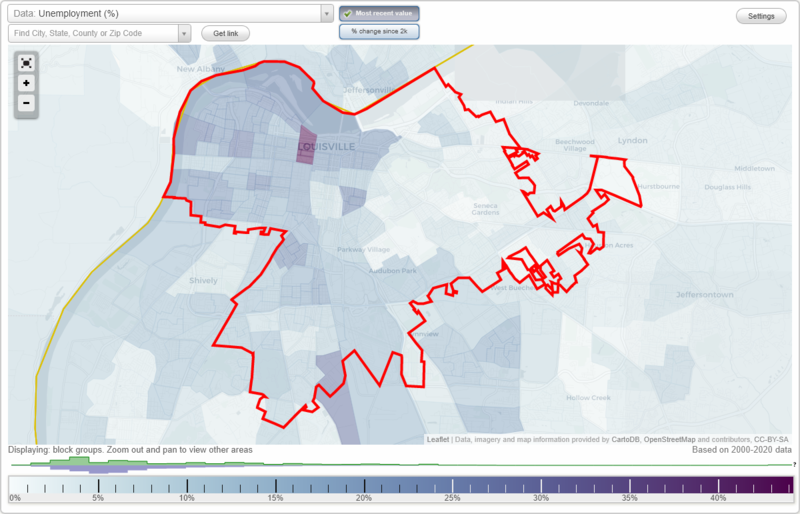
Unemployment in Louisville
- Unemployment by race in 2000
- Unemployment rate for White non-Hispanic residents
- 4.5%Males
- 5.0%Females
- Unemployment rate for Black residents
- 15.5%Males
- 12.1%Females
- Unemployment rate for American Indian and Alaska Native residents
- 7.6%Males
- 9.3%Females
- Unemployment rate for Asian residents
- 7.4%Males
- 5.2%Females
- Unemployment rate for other race residents
- 5.4%Males
- 5.4%Females
- Unemployment rate for two or more race residents
- 14.3%Males
- 10.8%Females
- Unemployment rate for Hispanic or Latino residents
- 8.5%Males
- 10.5%Females
Time leaving home to go to work
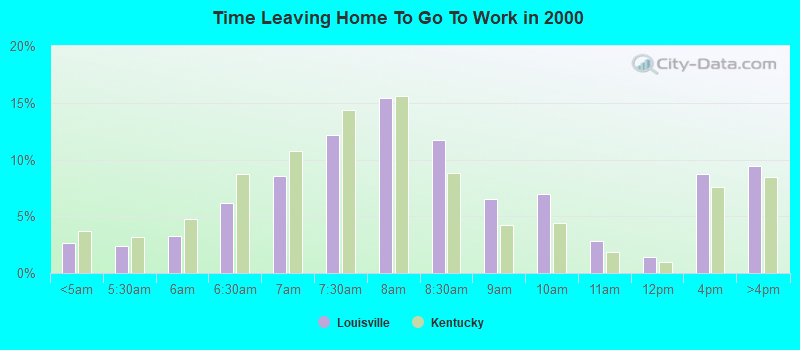
<5am:
| Louisville: | 2.6% (2,913) |
| Kentucky: | 3.7% (65,918) |
5:30am:
| Louisville: | 2.4% (2,619) |
| Kentucky: | 3.1% (55,792) |
6am:
| Louisville: | 3.3% (3,650) |
| Kentucky: | 4.7% (84,161) |
6:30am:
| Louisville: | 6.1% (6,803) |
| Kentucky: | 8.8% (156,072) |
7am:
| Louisville: | 8.5% (9,441) |
| Kentucky: | 10.8% (191,924) |
7:30am:
| Louisville: | 12.2% (13,481) |
| Kentucky: | 14.4% (256,256) |
8am:
| Louisville: | 15.5% (17,148) |
| Kentucky: | 15.6% (277,275) |
8:30am:
| Louisville: | 11.7% (13,028) |
| Kentucky: | 8.8% (156,855) |
9am:
| Louisville: | 6.6% (7,276) |
| Kentucky: | 4.2% (75,532) |
10am:
| Louisville: | 7.0% (7,738) |
| Kentucky: | 4.4% (77,954) |
11am:
| Louisville: | 2.8% (3,125) |
| Kentucky: | 1.9% (33,406) |
12pm:
| Louisville: | 1.4% (1,607) |
| Kentucky: | 1.0% (17,303) |
4pm:
| Louisville: | 8.7% (9,636) |
| Kentucky: | 7.6% (135,045) |
>4pm:
| Louisville: | 9.5% (10,490) |
| Kentucky: | 8.4% (150,096) |
Travel time to work
Daytime population change due to commuting: +80,342 (+31.4%)
Workers who live and work in this city: 67,206 (60.6%)
Workers who live and work in this city: 67,206 (60.6%)
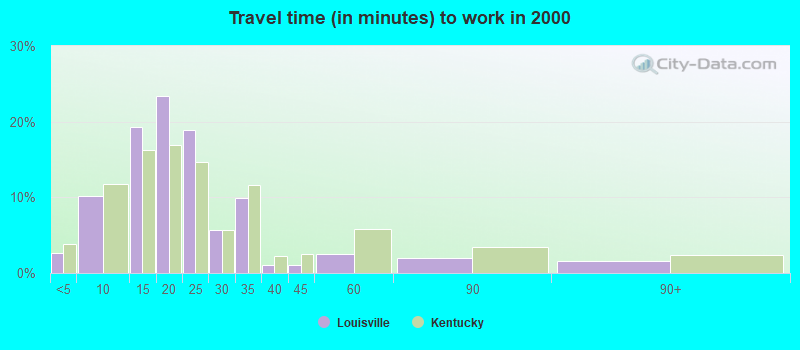
Less than 5 minutes:
| Louisville: | 2.6% (2,885) |
| Kentucky: | 3.8% (67,210) |
5 to 9 minutes:
| Louisville: | 10.1% (11,251) |
| Kentucky: | 11.8% (210,440) |
10 to 14 minutes:
| Louisville: | 19.3% (21,366) |
| Kentucky: | 16.3% (290,128) |
15 to 19 minutes:
| Louisville: | 23.4% (25,953) |
| Kentucky: | 16.9% (301,009) |
20 to 24 minutes:
| Louisville: | 18.8% (20,894) |
| Kentucky: | 14.7% (262,418) |
25 to 29 minutes:
| Louisville: | 5.7% (6,315) |
| Kentucky: | 5.7% (101,130) |
30 to 34 minutes:
| Louisville: | 10.0% (11,058) |
| Kentucky: | 11.7% (208,362) |
35 to 39 minutes:
| Louisville: | 1.1% (1,229) |
| Kentucky: | 2.3% (40,576) |
40 to 44 minutes:
| Louisville: | 1.1% (1,233) |
| Kentucky: | 2.5% (44,172) |
45 to 59 minutes:
| Louisville: | 2.5% (2,762) |
| Kentucky: | 5.8% (102,842) |
60 to 89 minutes:
| Louisville: | 2.0% (2,209) |
| Kentucky: | 3.5% (61,841) |
90 or more minutes:
| Louisville: | 1.6% (1,800) |
| Kentucky: | 2.4% (43,461) |
Means of transportation to work
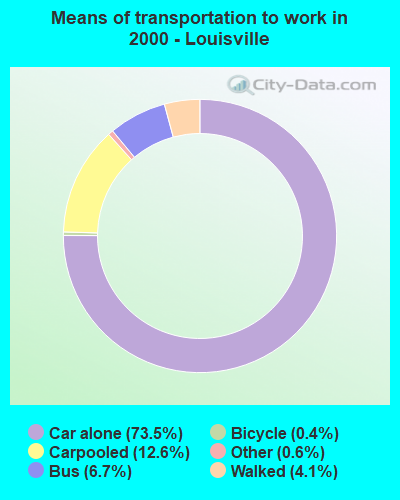
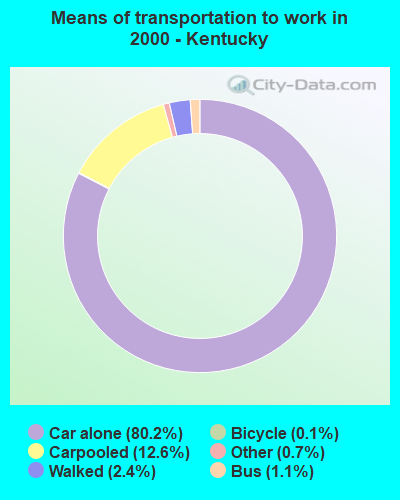
Drove car alone:
| Louisville: | 73.5% (81,542) |
| Kentucky: | 80.2% (1,429,053) |
Carpooled:
| Louisville: | 12.6% (14,016) |
| Kentucky: | 12.6% (224,643) |
Bus or trolley bus:
| Louisville: | 6.7% (7,461) |
| Kentucky: | 1.1% (19,522) |
Streetcar or trolley car:
| Louisville: | 0.1% (62) |
| Kentucky: | 0.0% (203) |
Subway or elevated:
| Louisville: | 0.0% (6) |
| Kentucky: | 0.0% (154) |
Ferryboat:
| Louisville: | 0.0% (12) |
| Kentucky: | 0.0% (203) |
Taxicab:
| Louisville: | 0.1% (67) |
| Kentucky: | 0.1% (1,333) |
Motorcycle:
| Louisville: | 0.1% (101) |
| Kentucky: | 0.1% (894) |
Bicycle:
| Louisville: | 0.4% (489) |
| Kentucky: | 0.1% (2,609) |
Walked:
| Louisville: | 4.1% (4,539) |
| Kentucky: | 2.4% (42,494) |
Other means:
| Louisville: | 0.6% (660) |
| Kentucky: | 0.7% (12,374) |
Private vehicle occupancy
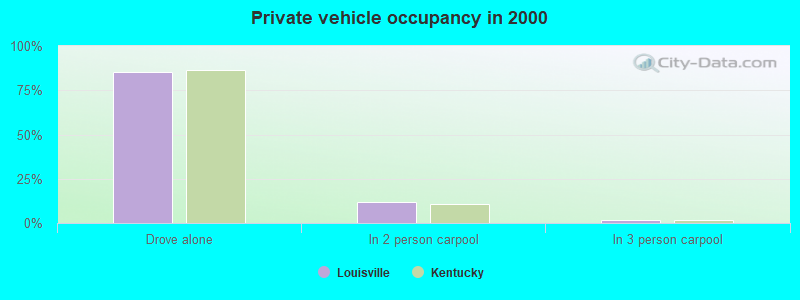
Drove alone:
| Louisville: | 85.3% (81,542) |
| Kentucky: | 86.4% (1,429,053) |
In 2 person carpool:
| Louisville: | 12.0% (11,478) |
| Kentucky: | 10.8% (178,387) |
In 3 person carpool:
| Louisville: | 1.8% (1,713) |
| Kentucky: | 1.8% (30,156) |
In 4 person carpool:
| Louisville: | 0.5% (472) |
| Kentucky: | 0.6% (10,003) |
In 5-6 person carpool:
| Louisville: | 0.2% (221) |
| Kentucky: | 0.2% (3,981) |
In 7+ person carpool:
| Louisville: | 0.1% (132) |
| Kentucky: | 0.1% (2,116) |
Class of workers
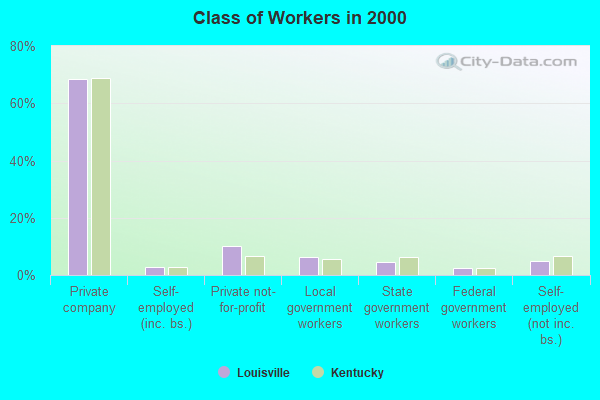
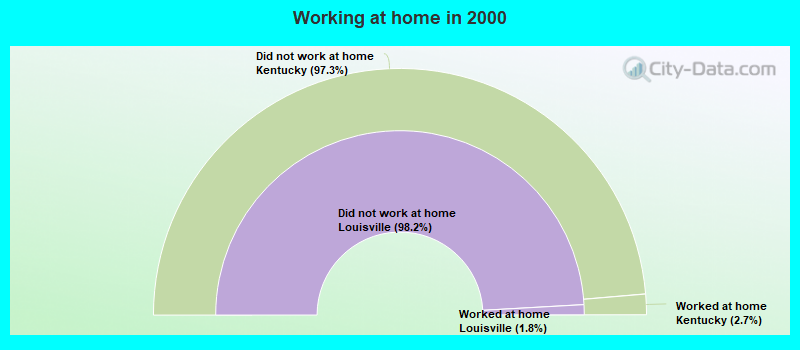
Employee of private company:
| Louisville: | 68.6% (77,857) |
| Kentucky: | 68.7% (1,235,989) |
Self-employed in own incorporated business:
| Louisville: | 2.7% (3,040) |
| Kentucky: | 3.0% (53,084) |
Private not-for-profit wage and salary workers:
| Louisville: | 10.1% (11,475) |
| Kentucky: | 6.8% (121,764) |
Local government workers:
| Louisville: | 6.5% (7,338) |
| Kentucky: | 5.6% (100,920) |
State government workers:
| Louisville: | 4.5% (5,067) |
| Kentucky: | 6.4% (114,791) |
Federal government workers:
| Louisville: | 2.6% (2,940) |
| Kentucky: | 2.5% (44,072) |
Self-employed workers in own not incorporated business:
| Louisville: | 4.9% (5,520) |
| Kentucky: | 6.7% (120,288) |
Unpaid family workers:
| Louisville: | 0.3% (295) |
| Kentucky: | 0.4% (7,356) |
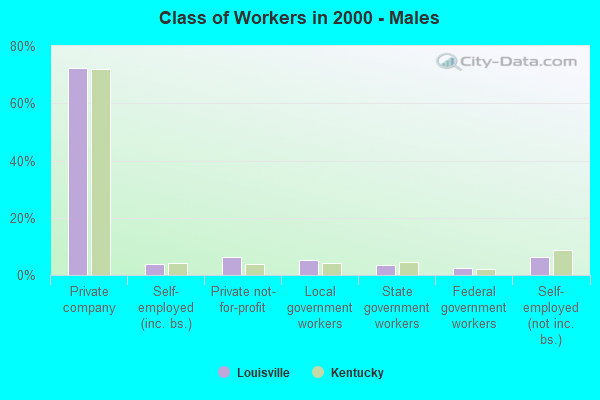
Employee of private company - Males:
| Louisville: | 72.4% (41,193) |
| Kentucky: | 72.0% (690,861) |
Self-employed in own incorporated business - Males:
| Louisville: | 4.0% (2,268) |
| Kentucky: | 4.1% (39,506) |
Private not-for-profit wage and salary workers - Males:
| Louisville: | 6.3% (3,585) |
| Kentucky: | 4.0% (37,911) |
Local government workers - Males:
| Louisville: | 5.2% (2,932) |
| Kentucky: | 4.2% (39,968) |
State government workers - Males:
| Louisville: | 3.4% (1,949) |
| Kentucky: | 4.5% (43,483) |
Federal government workers - Males:
| Louisville: | 2.3% (1,311) |
| Kentucky: | 2.2% (21,587) |
Self-employed workers in own not incorporated business - Males:
| Louisville: | 6.2% (3,525) |
| Kentucky: | 8.6% (82,249) |
Unpaid family workers - Males:
| Louisville: | 0.2% (132) |
| Kentucky: | 0.4% (4,031) |
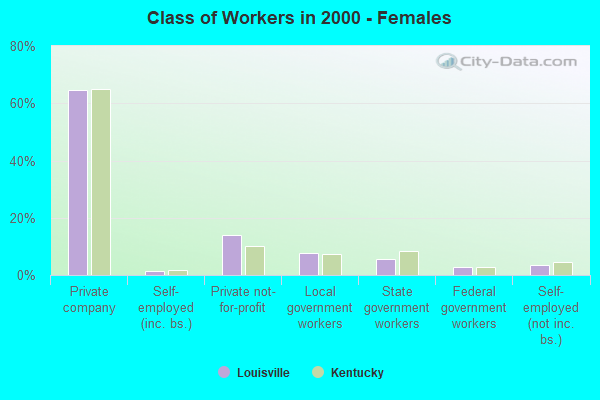
Employee of private company - Females:
| Louisville: | 64.7% (36,664) |
| Kentucky: | 65.0% (545,128) |
Self-employed in own incorporated business - Females:
| Louisville: | 1.4% (772) |
| Kentucky: | 1.6% (13,578) |
Private not-for-profit wage and salary workers - Females:
| Louisville: | 13.9% (7,890) |
| Kentucky: | 10.0% (83,853) |
Local government workers - Females:
| Louisville: | 7.8% (4,406) |
| Kentucky: | 7.3% (60,952) |
State government workers - Females:
| Louisville: | 5.5% (3,118) |
| Kentucky: | 8.5% (71,308) |
Federal government workers - Females:
| Louisville: | 2.9% (1,629) |
| Kentucky: | 2.7% (22,485) |
Self-employed workers in own not incorporated business - Females:
| Louisville: | 3.5% (1,995) |
| Kentucky: | 4.5% (38,039) |
Unpaid family workers - Females:
| Louisville: | 0.3% (163) |
| Kentucky: | 0.4% (3,325) |