Work and Jobs in Nesmith, South Carolina (SC) Detailed Stats
Occupations, Industries, Unemployment, Workers, Commute
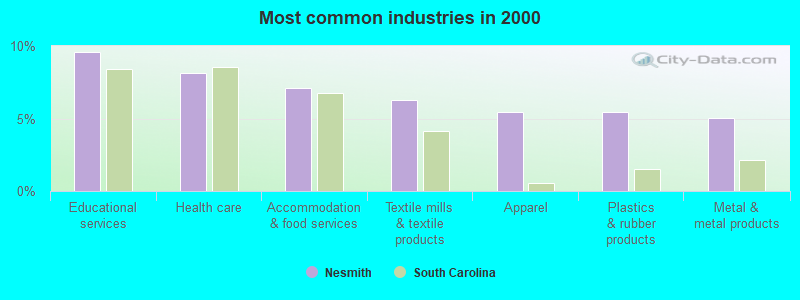
The most common industries in Nesmith are: Educational services (9.6% of civilian employees), Health care (8.1% of civilian employees), Accommodation & food services (7.1% of civilian employees). 70.9% of workers are employees of private companies, which is about the same as the rate of 70.4% across the entire state of South Carolina.
Most common industries
Most common industries | |||
|---|---|---|---|
Industry | All | Males | Females |
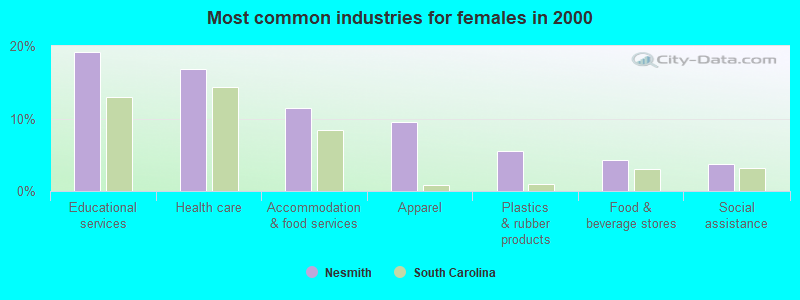
| Educational services | 9.6% (124) | 0.7% (5) | 19.1% (119) |
| Health care | 8.1% (105) | 0.0% (0) | 16.9% (105) |
| Accommodation and food services | 7.1% (92) | 3.1% (21) | 11.4% (71) |
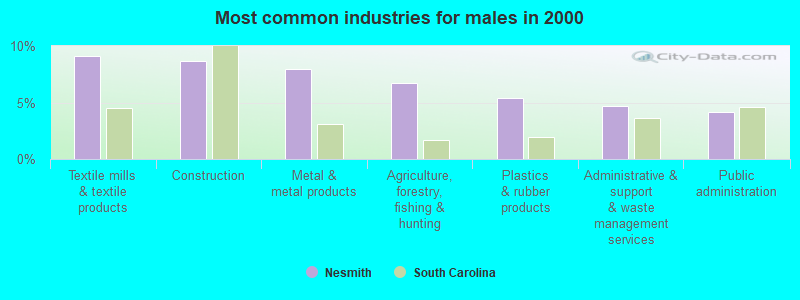
| Textile mills and textile products | 6.3% (81) | 9.1% (61) | 3.2% (20) |
| Apparel | 5.4% (70) | 1.6% (11) | 9.5% (59) |
| Plastics and rubber products | 5.4% (70) | 5.4% (36) | 5.5% (34) |
| Metal and metal products | 5.0% (65) | 7.9% (53) | 1.9% (12) |
| Agriculture, forestry, fishing and hunting | 5.0% (64) | 6.7% (45) | 3.1% (19) |
| Construction | 4.5% (58) | 8.7% (58) | 0.0% (0) |
| Public administration | 3.5% (45) | 4.2% (28) | 2.7% (17) |
| Food and beverage stores | 3.5% (45) | 2.7% (18) | 4.3% (27) |
| Administrative and support and waste management services | 3.0% (39) | 4.6% (31) | 1.3% (8) |
| Miscellaneous manufacturing | 2.0% (26) | 3.0% (20) | 1.0% (6) |
| Finance and insurance | 1.9% (24) | 0.6% (4) | 3.2% (20) |
| Utilities | 1.9% (24) | 2.7% (18) | 1.0% (6) |
| Chemicals | 1.9% (24) | 3.6% (24) | 0.0% (0) |
| Social assistance | 1.8% (23) | 0.0% (0) | 3.7% (23) |
| Religious, grantmaking, civic, professional, and similar organizations | 1.7% (22) | 2.5% (17) | 0.8% (5) |
| Real estate and rental and leasing | 1.6% (21) | 2.1% (14) | 1.1% (7) |
| Building material and garden equipment and supplies dealers | 1.6% (21) | 3.1% (21) | 0.0% (0) |
| Professional, scientific, and technical services | 1.3% (17) | 1.5% (10) | 1.1% (7) |
| Retail florists | 1.3% (17) | 2.5% (17) | 0.0% (0) |
| Truck transportation | 1.3% (17) | 2.5% (17) | 0.0% (0) |
| Personal and laundry services | 1.2% (16) | 2.4% (16) | 0.0% (0) |
| Petroleum and coal products | 1.2% (16) | 2.4% (16) | 0.0% (0) |
| Department and other general merchandise stores | 1.0% (13) | 0.0% (0) | 2.1% (13) |
| Arts, entertainment, and recreation | 1.0% (13) | 0.7% (5) | 1.3% (8) |
| Repair and maintenance | 1.0% (13) | 1.9% (13) | 0.0% (0) |
| Paper | 0.9% (12) | 1.8% (12) | 0.0% (0) |
| Motor vehicle and parts dealers | 0.9% (12) | 1.8% (12) | 0.0% (0) |
| Wood products | 0.9% (11) | 1.6% (11) | 0.0% (0) |
| Electrical and electronic goods merchant wholesalers | 0.8% (10) | 1.5% (10) | 0.0% (0) |
| Other transportation, and support activities, and couriers | 0.8% (10) | 1.5% (10) | 0.0% (0) |
| Broadcasting and telecommunications | 0.7% (9) | 0.0% (0) | 1.4% (9) |
| Printing and related support activities | 0.6% (8) | 0.0% (0) | 1.3% (8) |
| Motor vehicles, parts and supplies merchant wholesalers | 0.6% (8) | 0.0% (0) | 1.3% (8) |
| Machinery | 0.5% (7) | 1.0% (7) | 0.0% (0) |
| Electrical equipment, appliances, and components | 0.5% (6) | 0.0% (0) | 1.0% (6) |
| Nonmetallic mineral products | 0.5% (6) | 0.9% (6) | 0.0% (0) |
| Miscellaneous nondurable goods merchant wholesalers | 0.5% (6) | 0.9% (6) | 0.0% (0) |
| Groceries and related products merchant wholesalers | 0.5% (6) | 0.9% (6) | 0.0% (0) |
| Gasoline stations | 0.4% (5) | 0.0% (0) | 0.8% (5) |
| Music stores | 0.3% (4) | 0.6% (4) | 0.0% (0) |
| U. S. Postal service | 0.3% (4) | 0.6% (4) | 0.0% (0) |
Unemployment in Nesmith
- Unemployment by race in 2000
- Unemployment rate for White non-Hispanic residents
- 8.5%Males
- 3.4%Females
- Unemployment rate for Black residents
- 10.7%Males
- 10.9%Females
Time leaving home to go to work
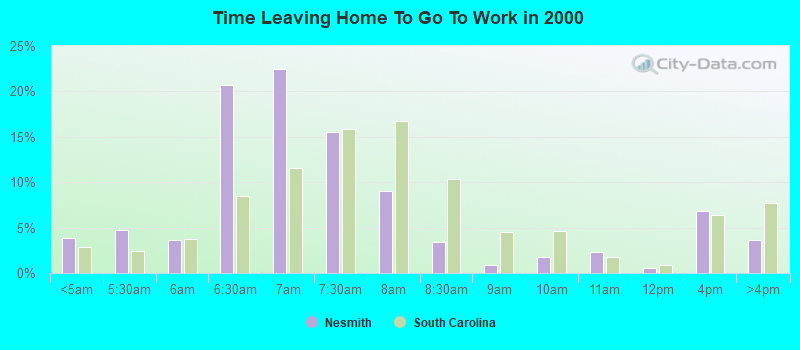
<5am:
| Nesmith: | 3.8% (48) |
| South Carolina: | 2.9% (52,042) |
5:30am:
| Nesmith: | 4.7% (59) |
| South Carolina: | 2.4% (44,320) |
6am:
| Nesmith: | 3.7% (46) |
| South Carolina: | 3.8% (68,753) |
6:30am:
| Nesmith: | 20.7% (261) |
| South Carolina: | 8.4% (153,907) |
7am:
| Nesmith: | 22.4% (282) |
| South Carolina: | 11.5% (210,295) |
7:30am:
| Nesmith: | 15.6% (196) |
| South Carolina: | 15.9% (289,937) |
8am:
| Nesmith: | 9.0% (113) |
| South Carolina: | 16.7% (305,268) |
8:30am:
| Nesmith: | 3.4% (43) |
| South Carolina: | 10.4% (189,373) |
9am:
| Nesmith: | 0.9% (11) |
| South Carolina: | 4.5% (82,760) |
10am:
| Nesmith: | 1.7% (22) |
| South Carolina: | 4.6% (83,870) |
11am:
| Nesmith: | 2.3% (29) |
| South Carolina: | 1.8% (32,177) |
12pm:
| Nesmith: | 0.6% (7) |
| South Carolina: | 0.8% (15,242) |
4pm:
| Nesmith: | 6.8% (86) |
| South Carolina: | 6.4% (116,272) |
>4pm:
| Nesmith: | 3.6% (45) |
| South Carolina: | 7.7% (140,518) |
Travel time to work
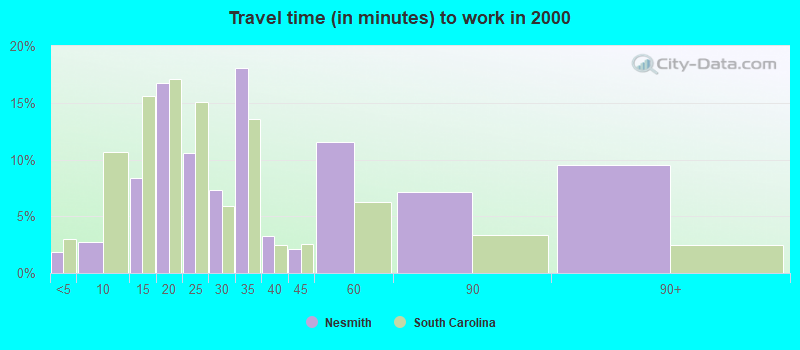
Less than 5 minutes:
| Nesmith: | 1.8% (23) |
| South Carolina: | 3.0% (53,890) |
5 to 9 minutes:
| Nesmith: | 2.7% (34) |
| South Carolina: | 10.6% (193,658) |
10 to 14 minutes:
| Nesmith: | 8.3% (105) |
| South Carolina: | 15.6% (284,615) |
15 to 19 minutes:
| Nesmith: | 16.8% (211) |
| South Carolina: | 17.1% (311,394) |
20 to 24 minutes:
| Nesmith: | 10.6% (133) |
| South Carolina: | 15.0% (274,138) |
25 to 29 minutes:
| Nesmith: | 7.3% (92) |
| South Carolina: | 5.9% (108,410) |
30 to 34 minutes:
| Nesmith: | 18.0% (227) |
| South Carolina: | 13.5% (246,792) |
35 to 39 minutes:
| Nesmith: | 3.3% (41) |
| South Carolina: | 2.5% (44,712) |
40 to 44 minutes:
| Nesmith: | 2.1% (27) |
| South Carolina: | 2.6% (46,969) |
45 to 59 minutes:
| Nesmith: | 11.5% (145) |
| South Carolina: | 6.3% (114,459) |
60 to 89 minutes:
| Nesmith: | 7.2% (90) |
| South Carolina: | 3.4% (61,532) |
90 or more minutes:
| Nesmith: | 9.5% (120) |
| South Carolina: | 2.4% (44,165) |
Means of transportation to work
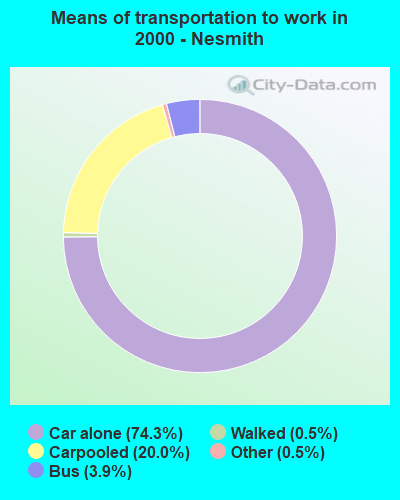
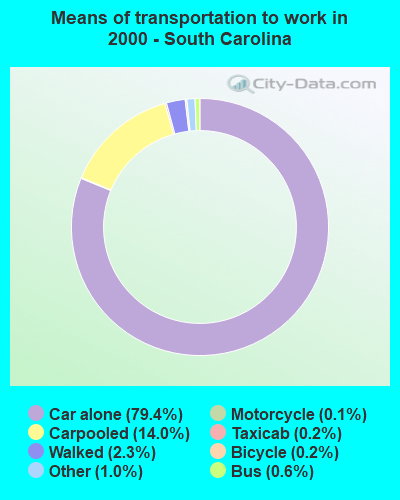
Drove car alone:
| Nesmith: | 74.3% (935) |
| South Carolina: | 79.4% (1,447,338) |
Carpooled:
| Nesmith: | 20.0% (252) |
| South Carolina: | 14.0% (255,857) |
Bus or trolley bus:
| Nesmith: | 3.9% (49) |
| South Carolina: | 0.6% (11,168) |
Walked:
| Nesmith: | 0.5% (6) |
| South Carolina: | 2.3% (42,567) |
Other means:
| Nesmith: | 0.5% (6) |
| South Carolina: | 1.0% (17,527) |
Private vehicle occupancy
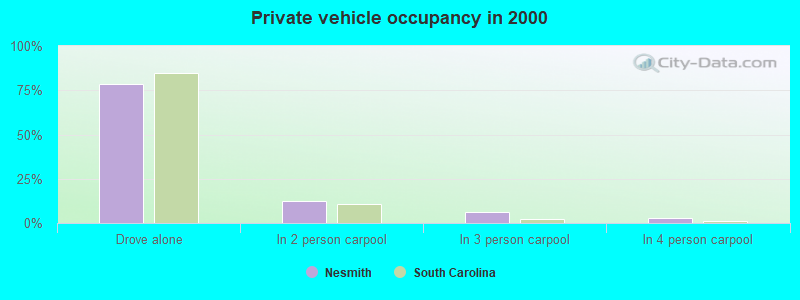
Drove alone:
| Nesmith: | 78.8% (935) |
| South Carolina: | 85.0% (1,447,338) |
In 2 person carpool:
| Nesmith: | 12.5% (148) |
| South Carolina: | 11.0% (187,418) |
In 3 person carpool:
| Nesmith: | 6.0% (71) |
| South Carolina: | 2.4% (40,124) |
In 4 person carpool:
| Nesmith: | 2.8% (33) |
| South Carolina: | 0.9% (15,038) |
Class of workers
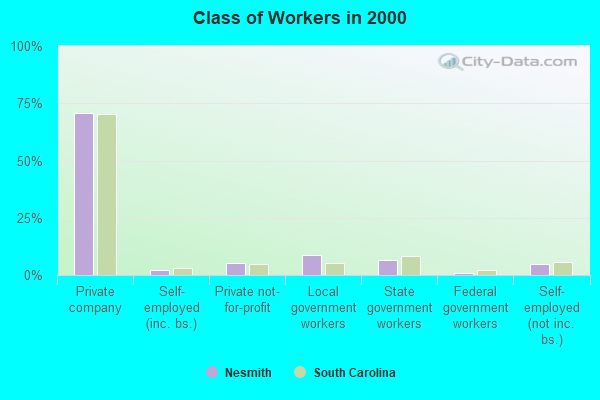
Employee of private company:
| Nesmith: | 70.9% (914) |
| South Carolina: | 70.4% (1,284,199) |
Self-employed in own incorporated business:
| Nesmith: | 2.2% (28) |
| South Carolina: | 3.1% (56,628) |
Private not-for-profit wage and salary workers:
| Nesmith: | 5.4% (70) |
| South Carolina: | 4.6% (84,506) |
Local government workers:
| Nesmith: | 8.8% (113) |
| South Carolina: | 5.4% (99,319) |
State government workers:
| Nesmith: | 6.4% (83) |
| South Carolina: | 8.1% (147,384) |
Federal government workers:
| Nesmith: | 0.7% (9) |
| South Carolina: | 2.4% (43,164) |
Self-employed workers in own not incorporated business:
| Nesmith: | 5.0% (64) |
| South Carolina: | 5.7% (104,649) |
Unpaid family workers:
| Nesmith: | 0.6% (8) |
| South Carolina: | 0.3% (4,851) |
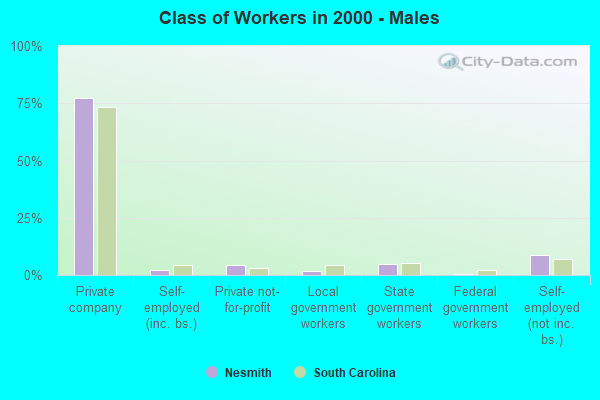
Employee of private company - Males:
| Nesmith: | 77.5% (517) |
| South Carolina: | 73.5% (702,345) |
Self-employed in own incorporated business - Males:
| Nesmith: | 2.4% (16) |
| South Carolina: | 4.4% (41,954) |
Private not-for-profit wage and salary workers - Males:
| Nesmith: | 4.2% (28) |
| South Carolina: | 3.0% (28,252) |
Local government workers - Males:
| Nesmith: | 1.8% (12) |
| South Carolina: | 4.2% (40,534) |
State government workers - Males:
| Nesmith: | 4.9% (33) |
| South Carolina: | 5.1% (49,132) |
Federal government workers - Males:
| Nesmith: | 0.6% (4) |
| South Carolina: | 2.4% (22,630) |
Self-employed workers in own not incorporated business - Males:
| Nesmith: | 8.5% (57) |
| South Carolina: | 7.2% (68,656) |
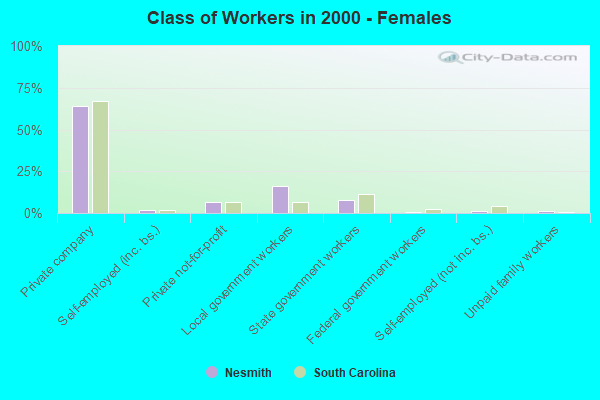
Employee of private company - Females:
| Nesmith: | 63.8% (397) |
| South Carolina: | 67.0% (581,854) |
Self-employed in own incorporated business - Females:
| Nesmith: | 1.9% (12) |
| South Carolina: | 1.7% (14,674) |
Private not-for-profit wage and salary workers - Females:
| Nesmith: | 6.8% (42) |
| South Carolina: | 6.5% (56,254) |
Local government workers - Females:
| Nesmith: | 16.2% (101) |
| South Carolina: | 6.8% (58,785) |
State government workers - Females:
| Nesmith: | 8.0% (50) |
| South Carolina: | 11.3% (98,252) |
Federal government workers - Females:
| Nesmith: | 0.8% (5) |
| South Carolina: | 2.4% (20,534) |
Self-employed workers in own not incorporated business - Females:
| Nesmith: | 1.1% (7) |
| South Carolina: | 4.1% (35,993) |
Unpaid family workers - Females:
| Nesmith: | 1.3% (8) |
| South Carolina: | 0.3% (2,590) |