Work and Jobs in North Alamo, Texas (TX) Detailed Stats
Data:
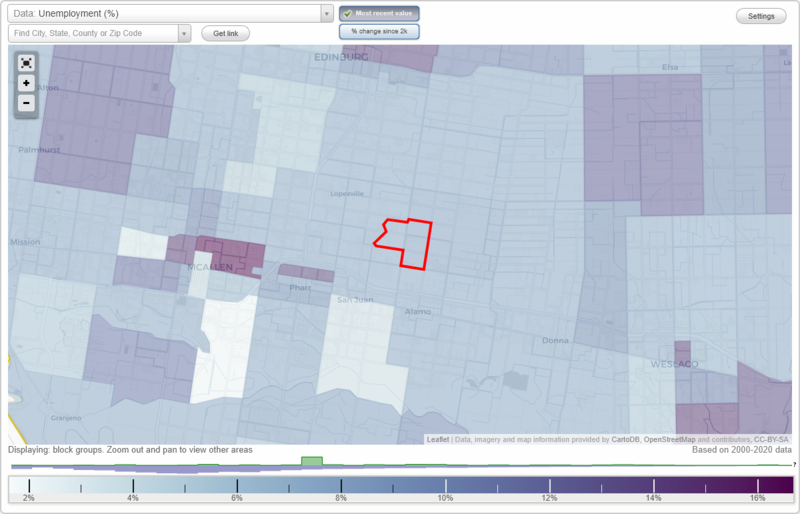
Unemployment (%)
Unemployment (% change since 2000)
Unemployment (%) - White
Unemployment (% change since 2000) - White
Unemployment (%) - Black or African American
Unemployment (% change since 2000) - Black or African American
Unemployment (%) - Asian
Unemployment (% change since 2000) - Asian
Unemployment (%) - Hispanic or Latino
Unemployment (% change since 2000) - Hispanic or Latino
Unemployment (%) - American Indian and Alaska Native
Unemployment (% change since 2000) - American Indian and Alaska Native
Unemployment (%) - Multirace
Unemployment (% change since 2000) - Multirace
Unemployment (%) - Other Race
Unemployment (% change since 2000) - Other Race
Industry diversity
Most Common Industries - Agriculture, forestry, fishing and hunting, and mining (%)
Most Common Industries - Agriculture, forestry, fishing and hunting (%)
Most Common Industries - Mining, quarrying, and oil and gas extraction (%)
Most Common Industries - Construction (%)
Most Common Industries - Manufacturing (%)
Most Common Industries - Wholesale trade (%)
Most Common Industries - Retail trade (%)
Most Common Industries - Transportation and warehousing, and utilities (%)
Most Common Industries - Transportation and warehousing (%)
Most Common Industries - Utilities (%)
Most Common Industries - Information (%)
Most Common Industries - Finance and insurance, and real estate and rental and leasing (%)
Most Common Industries - Finance and insurance (%)
Most Common Industries - Real estate and rental and leasing (%)
Most Common Industries - Professional, scientific, and management, and administrative and waste management services (%)
Most Common Industries - Professional, scientific, and technical services (%)
Most Common Industries - Management of companies and enterprises (%)
Most Common Industries - Administrative and support and waste management services (%)
Most Common Industries - Educational services, and health care and social assistance (%)
Most Common Industries - Educational services (%)
Most Common Industries - Health care and social assistance (%)
Most Common Industries - Arts, entertainment, and recreation, and accommodation and food services (%)
Most Common Industries - Arts, entertainment, and recreation (%)
Most Common Industries - Accommodation and food services (%)
Most Common Industries - Other services, except public administration (%)
Most Common Industries - Public administration (%)
Occupation diversity
Most Common Occupations - Management, business, science, and arts occupations (%)
Most Common Occupations - Management, business, and financial occupations (%)
Most Common Occupations - Management occupations (%)
Most Common Occupations - Business and financial operations occupations (%)
Most Common Occupations - Computer, engineering, and science occupations (%)
Most Common Occupations - Computer and mathematical occupations (%)
Most Common Occupations - Architecture and engineering occupations (%)
Most Common Occupations - Life, physical, and social science occupations (%)
Most Common Occupations - Education, legal, community service, arts, and media occupations (%)
Most Common Occupations - Community and social service occupations (%)
Most Common Occupations - Legal occupations (%)
Most Common Occupations - Education, training, and library occupations (%)
Most Common Occupations - Arts, design, entertainment, sports, and media occupations (%)
Most Common Occupations - Healthcare practitioners and technical occupations (%)
Most Common Occupations - Health diagnosing and treating practitioners and other technical occupations (%)
Most Common Occupations - Health technologists and technicians (%)
Most Common Occupations - Service occupations (%)
Most Common Occupations - Healthcare support occupations (%)
Most Common Occupations - Protective service occupations (%)
Most Common Occupations - Fire fighting and prevention, and other protective service workers including supervisors (%)
Most Common Occupations - Law enforcement workers including supervisors (%)
Most Common Occupations - Food preparation and serving related occupations (%)
Most Common Occupations - Building and grounds cleaning and maintenance occupations (%)
Most Common Occupations - Personal care and service occupations (%)
Most Common Occupations - Sales and office occupations (%)
Most Common Occupations - Sales and related occupations (%)
Most Common Occupations - Office and administrative support occupations (%)
Most Common Occupations - Natural resources, construction, and maintenance occupations (%)
Most Common Occupations - Farming, fishing, and forestry occupations (%)
Most Common Occupations - Construction and extraction occupations (%)
Most Common Occupations - Installation, maintenance, and repair occupations (%)
Most Common Occupations - Production, transportation, and material moving occupations (%)
Most Common Occupations - Production occupations (%)
Most Common Occupations - Transportation occupations (%)
Most Common Occupations - Material moving occupations (%)
Private vehicle occupancy - Drove alone (% change since 2000)
Private vehicle occupancy - Carpooled (%)
Private vehicle occupancy - Carpooled (% change since 2000)
Private vehicle occupancy - In 2-person carpool (%)
Private vehicle occupancy - In 2-person carpool (% change since 2000)
Private vehicle occupancy - In 3-person carpool (%)
Private vehicle occupancy - In 3-person carpool (% change since 2000)
Private vehicle occupancy - In 4-person carpool (%)
Private vehicle occupancy - In 4-person carpool (% change since 2000)
Private vehicle occupancy - In 5- or 6-person carpool (%)
Private vehicle occupancy - In 5- or 6-person carpool (% change since 2000)
Private vehicle occupancy - In 7-or-more-person carpool (%)
Private vehicle occupancy - In 7-or-more-person carpool (% change since 2000)
Time Leaving Home To Go To Work - 12:00 a.m. to 4:59 a.m. (%)
Time Leaving Home To Go To Work - 12:00 a.m. to 4:59 a.m. (% change since 2000)
Time Leaving Home To Go To Work - 5:00 a.m. to 5:59 a.m. (%)
Time Leaving Home To Go To Work - 5:00 a.m. to 5:59 a.m. (% change since 2000)
Time Leaving Home To Go To Work - 6:00 a.m. to 6:59 a.m. (%)
Time Leaving Home To Go To Work - 6:00 a.m. to 6:59 a.m. (% change since 2000)
Time Leaving Home To Go To Work - 7:00 a.m. to 7:59 a.m. (%)
Time Leaving Home To Go To Work - 7:00 a.m. to 7:59 a.m. (% change since 2000)
Time Leaving Home To Go To Work - 8:00 a.m. to 8:59 a.m. (%)
Time Leaving Home To Go To Work - 8:00 a.m. to 8:59 a.m. (% change since 2000)
Time Leaving Home To Go To Work - 9:00 a.m. to 9:59 a.m. (%)
Time Leaving Home To Go To Work - 9:00 a.m. to 9:59 a.m. (% change since 2000)
Time Leaving Home To Go To Work - 10:00 a.m. to 10:59 a.m. (%)
Time Leaving Home To Go To Work - 10:00 a.m. to 10:59 a.m. (% change since 2000)
Time Leaving Home To Go To Work - 11:00 a.m. to 11:59 a.m. (%)
Time Leaving Home To Go To Work - 11:00 a.m. to 11:59 a.m. (% change since 2000)
Time Leaving Home To Go To Work - 12:00 p.m. to 3:59 p.m. (%)
Time Leaving Home To Go To Work - 12:00 p.m. to 3:59 p.m. (% change since 2000)
Time Leaving Home To Go To Work - 4:00 p.m. to 11:59 p.m. (%)
Time Leaving Home To Go To Work - 4:00 p.m. to 11:59 p.m. (% change since 2000)
Class of Workers - Employee of private company (%)
Class of Workers - Employee of private company (% change since 2000)
Class of Workers - Self-employed in own incorporated business (%)
Class of Workers - Self-employed in own incorporated business (% change since 2000)
Class of Workers - Private not-for-profit wage and salary workers (%)
Class of Workers - Private not-for-profit wage and salary workers (% change since 2000)
Class of Workers - Local government workers (%)
Class of Workers - Local government workers (% change since 2000)
Class of Workers - State government workers (%)
Class of Workers - State government workers (% change since 2000)
Class of Workers - Federal government workers (%)
Class of Workers - Federal government workers (% change since 2000)
Class of Workers - Self-employed workers in own not incorporated business and Unpaid family workers (%)
Class of Workers - Self-employed workers in own not incorporated business and Unpaid family workers (% change since 2000)
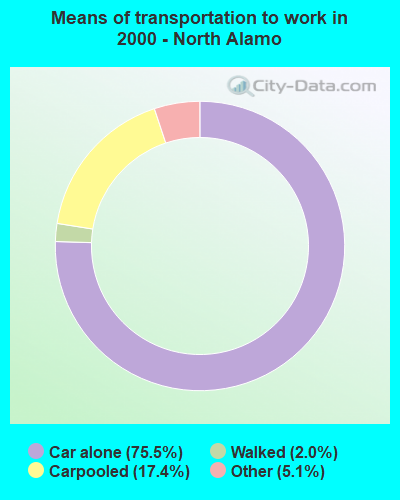
Means of transportation to work - Drove car alone (%)
Means of transportation to work - Drove car alone (% change since 2000)
Means of transportation to work - Carpooled (%)
Means of transportation to work - Carpooled (% change since 2000)
Means of transportation to work - Public transportation (%)
Means of transportation to work - Public transportation (% change since 2000)
Means of transportation to work - Bus or trolley bus (%)
Means of transportation to work - Bus or trolley bus (% change since 2000)
Means of transportation to work - Streetcar or trolley car (%)
Means of transportation to work - Streetcar or trolley car (% change since 2000)
Means of transportation to work - Subway or elevated (%)
Means of transportation to work - Subway or elevated (% change since 2000)
Means of transportation to work - Railroad (%)
Means of transportation to work - Railroad (% change since 2000)
Means of transportation to work - Ferryboat (%)
Means of transportation to work - Ferryboat (% change since 2000)
Means of transportation to work - Taxicab (%)
Means of transportation to work - Taxicab (% change since 2000)
Means of transportation to work - Motorcycle (%)
Means of transportation to work - Motorcycle (% change since 2000)
Means of transportation to work - Bicycle (%)
Means of transportation to work - Bicycle (% change since 2000)
Means of transportation to work - Walked (%)
Means of transportation to work - Walked (% change since 2000)
Means of transportation to work - Other means (%)
Means of transportation to work - Other means (% change since 2000)
Working at home (%)
Working at home (% change since 2000)
Travel time to work - Less than 5 minutes (%)
Travel time to work - Less than 5 minutes (% change since 2000)
Travel time to work - 5 to 9 minutes (%)
Travel time to work - 5 to 9 minutes (% change since 2000)
Travel time to work - 10 to 19 minutes (%)
Travel time to work - 10 to 19 minutes (% change since 2000)
Travel time to work - 20 to 29 minutes (%)
Travel time to work - 20 to 29 minutes (% change since 2000)
Travel time to work - 30 to 39 minutes (%)
Travel time to work - 30 to 39 minutes (% change since 2000)
Travel time to work - 40 to 59 minutes (%)
Travel time to work - 40 to 59 minutes (% change since 2000)
Travel time to work - 60 to 89 minutes (%)
Travel time to work - 60 to 89 minutes (% change since 2000)
Travel time to work - 90 or more minutes (%)
Travel time to work - 90 or more minutes (% change since 2000)
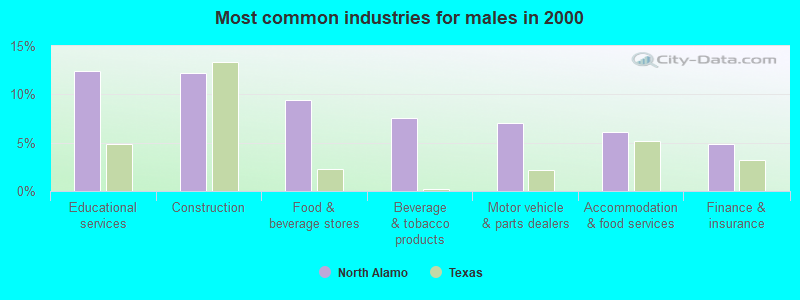
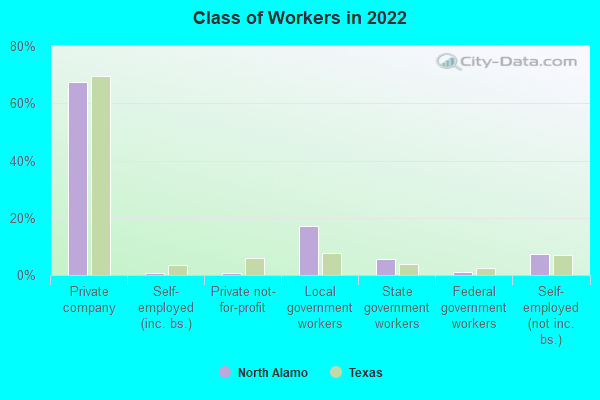
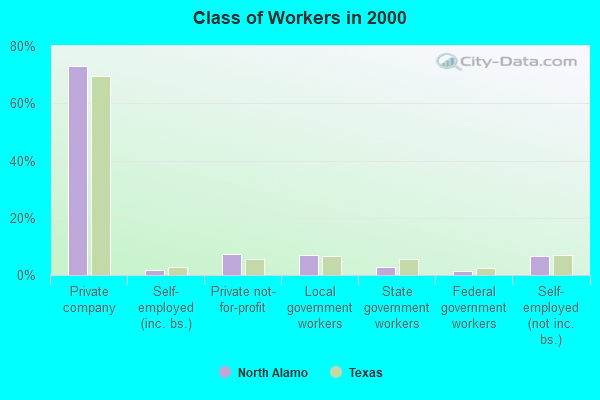
The most common industries in North Alamo are: Educational services (18.3% of civilian employees), Accommodation & food services (11.4% of civilian employees), Health care (9.1% of civilian employees). 86.3% of workers work in Hidalgo County. 67.6% of workers are employees of private companies, which is 2.9% less than the rate of 69.6% across the entire state of Texas.
Whole page based on the data from 2000 / 2022 when the population of North Alamo, Texas was 2,061 / 5,219
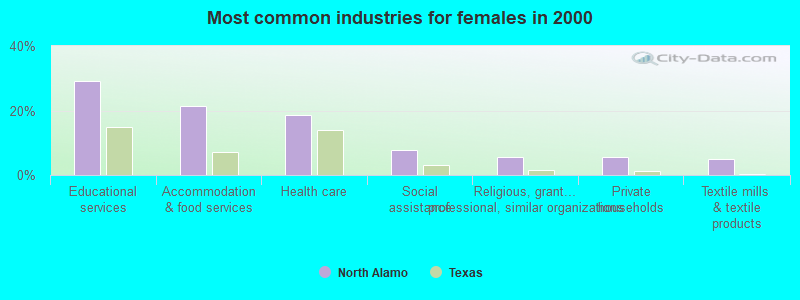
Most common industries
Most common industries Industry All Males Females
Educational services 18.3% 12.5% 29.2% Accommodation and food services 11.4% 6.1% 21.3% Health care 9.1% 4.0% 18.5% Construction 8.9% 12.2% 2.8% Food and beverage stores 6.1% 9.4% 0.0% Beverage and tobacco products 4.9% 7.6% 0.0% Motor vehicle and parts dealers 4.5% 7.0% 0.0% Social assistance 4.3% 2.4% 7.9% Finance and insurance 3.2% 4.9% 0.0% Department and other general merchandise stores 2.4% 3.6% 0.0% Food 2.2% 3.3% 0.0% Professional, scientific, and technical services 2.2% 3.3% 0.0% Transportation equipment 2.0% 3.0% 0.0% Miscellaneous nondurable goods merchant wholesalers 2.0% 3.0% 0.0% Religious, grantmaking, civic, professional, and similar organizations 2.0% 0.0% 5.6% Private households 2.0% 0.0% 5.6% Agriculture, forestry, fishing and hunting 1.8% 2.7% 0.0% Textile mills and textile products 1.8% 0.0% 5.1% Petroleum and coal products 1.6% 2.4% 0.0% Truck transportation 1.6% 2.4% 0.0% Real estate and rental and leasing 1.6% 2.4% 0.0% U. S. Postal service 1.4% 2.1% 0.0% Personal and laundry services 1.4% 0.0% 3.9% Furniture and related product manufacturing 1.2% 1.8% 0.0% Machinery 1.2% 1.8% 0.0% Used merchandise, gift, novelty, and souvenir, and other miscellaneous stores 1.2% 1.8% 0.0%
Unemployment in North Alamo Unemployment by race in 2022
Unemployment rate for American Indian and Alaska Native residents 100.0% FemalesUnemployment rate for Hispanic or Latino residents 8.9% FemalesUnemployment by race in 2000
Unemployment rate for Hispanic or Latino residents 15.4% Males11.9% Females
Time leaving home to go to work 12:00 a.m. to 4:59 a.m.: North Alamo:
5.8% (108)Texas:
5.5% (678,264)
5:30 a.m. to 5:59 a.m.: North Alamo:
0.8% (15)Texas:
4.9% (603,953)
6:00 a.m. to 6:29 a.m.: North Alamo:
11.8% (217)Texas:
9.4% (1,155,020)
6:30 a.m. to 6:59 a.m.: North Alamo:
4.0% (75)Texas:
9.3% (1,152,822)
7:00 a.m. to 7:29 a.m.: North Alamo:
15.1% (278)Texas:
15.3% (1,885,477)
7:30 a.m. to 7:59 a.m.: North Alamo:
15.2% (281)Texas:
11.9% (1,469,628)
8:00 a.m. to 8:29 a.m.: North Alamo:
23.3% (430)Texas:
11.3% (1,400,175)
8:30 a.m. to 8:59 a.m.: North Alamo:
10.0% (184)Texas:
4.9% (599,574)
9:00 a.m. to 9:59 a.m.: North Alamo:
8.9% (164)Texas:
6.7% (829,367)
10:00 a.m. to 10:59 a.m.: North Alamo:
0.7% (13)Texas:
3.2% (390,354)
12:00 p.m. to 3:59 p.m.: North Alamo:
3.4% (63)Texas:
5.8% (720,594)
4:00 p.m. to 11:59 p.m.: North Alamo:
1.8% (34)Texas:
6.3% (777,072)
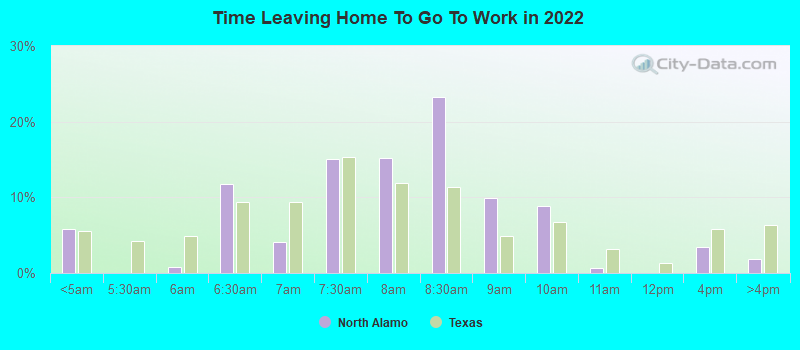
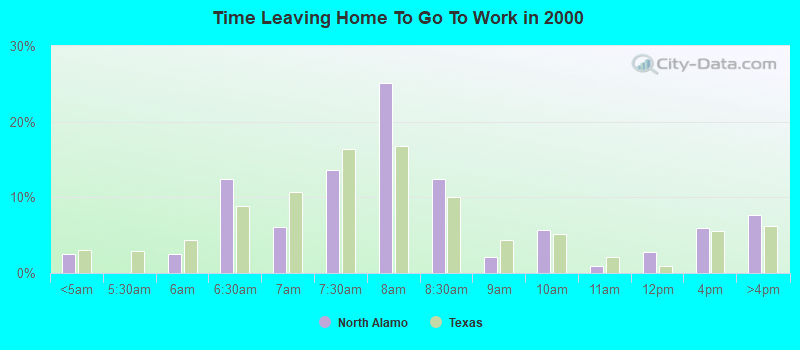
<5am: North Alamo:
2.6% (13)Texas:
3.1% (281,361)
6am: North Alamo:
2.6% (13)Texas:
4.4% (403,423)
6:30am: North Alamo:
12.4% (63)Texas:
8.8% (808,876)
7am: North Alamo:
6.1% (31)Texas:
10.7% (976,557)
7:30am: North Alamo:
13.6% (69)Texas:
16.4% (1,500,904)
8am: North Alamo:
25.0% (127)Texas:
16.8% (1,536,308)
8:30am: North Alamo:
12.4% (63)Texas:
10.0% (913,601)
9am: North Alamo:
2.2% (11)Texas:
4.4% (398,656)
10am: North Alamo:
5.7% (29)Texas:
5.2% (472,592)
11am: North Alamo:
1.0% (5)Texas:
2.2% (197,844)
12pm: North Alamo:
2.8% (14)Texas:
0.9% (86,997)
4pm: North Alamo:
5.9% (30)Texas:
5.5% (503,565)
>4pm: North Alamo:
7.7% (39)Texas:
6.1% (563,107)
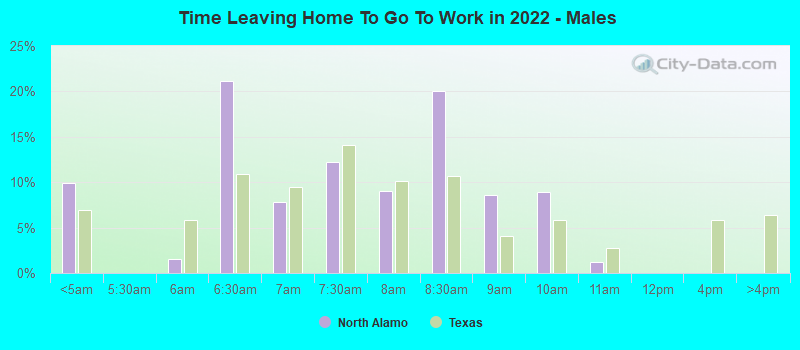
12:00 a.m. to 4:59 a.m. - Males: North Alamo:
9.9% (107)Texas:
7.0% (477,284)
5:30 a.m. to 5:59 a.m. - Males: North Alamo:
1.5% (16)Texas:
5.9% (402,788)
6:00 a.m. to 6:29 a.m. - Males: North Alamo:
21.2% (228)Texas:
10.9% (751,118)
6:30 a.m. to 6:59 a.m. - Males: North Alamo:
7.8% (84)Texas:
9.5% (652,306)
7:00 a.m. to 7:29 a.m. - Males: North Alamo:
12.3% (132)Texas:
14.1% (970,598)
7:30 a.m. to 7:59 a.m. - Males: North Alamo:
9.0% (97)Texas:
10.2% (696,429)
8:00 a.m. to 8:29 a.m. - Males: North Alamo:
20.1% (216)Texas:
10.6% (729,041)
8:30 a.m. to 8:59 a.m. - Males: North Alamo:
8.6% (92)Texas:
4.1% (281,762)
9:00 a.m. to 9:59 a.m. - Males: North Alamo:
9.0% (96)Texas:
5.8% (401,071)
10:00 a.m. to 10:59 a.m. - Males: North Alamo:
1.2% (13)Texas:
2.7% (186,469)
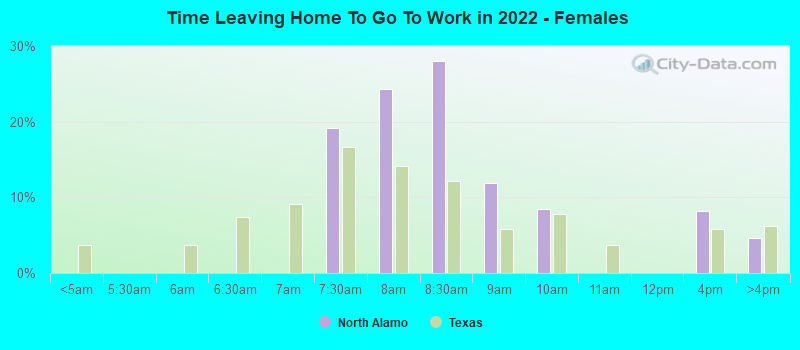
7:00 a.m. to 7:29 a.m. - Females: North Alamo:
19.2% (147)Texas:
16.7% (914,879)
7:30 a.m. to 7:59 a.m. - Females: North Alamo:
24.3% (187)Texas:
14.1% (773,199)
8:00 a.m. to 8:29 a.m. - Females: North Alamo:
28.0% (215)Texas:
12.2% (671,134)
8:30 a.m. to 8:59 a.m. - Females: North Alamo:
11.8% (91)Texas:
5.8% (317,812)
9:00 a.m. to 9:59 a.m. - Females: North Alamo:
8.4% (65)Texas:
7.8% (428,296)
12:00 p.m. to 3:59 p.m. - Females: North Alamo:
8.2% (63)Texas:
5.9% (322,799)
4:00 p.m. to 11:59 p.m. - Females: North Alamo:
4.7% (36)Texas:
6.2% (341,122)
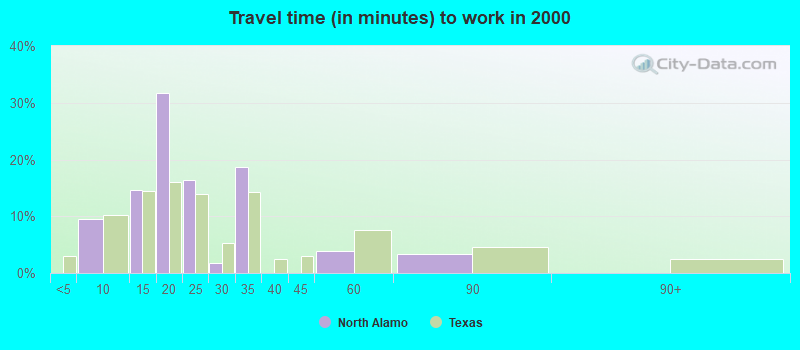
Travel time to work Percentage of workers working in this county: 86.3%
5 to 9 minutes: North Alamo:
9.5% (48)Texas:
10.3% (942,891)
10 to 14 minutes: North Alamo:
14.6% (74)Texas:
14.4% (1,317,555)
15 to 19 minutes: North Alamo:
31.8% (161)Texas:
16.0% (1,467,945)
20 to 24 minutes: North Alamo:
16.4% (83)Texas:
13.9% (1,276,781)
25 to 29 minutes: North Alamo:
1.8% (9)Texas:
5.3% (482,838)
30 to 34 minutes: North Alamo:
18.7% (95)Texas:
14.3% (1,309,699)
45 to 59 minutes: North Alamo:
3.9% (20)Texas:
7.6% (692,006)
60 to 89 minutes: North Alamo:
3.4% (17)Texas:
4.6% (418,905)
Means of transportation to work Drove car alone: North Alamo:
75.5% (383)Texas:
77.7% (7,115,590)
Carpooled: North Alamo:
17.4% (88)Texas:
14.5% (1,326,012)
Walked: North Alamo:
2.0% (10)Texas:
1.9% (173,670)
Other means: North Alamo:
5.1% (26)Texas:
0.9% (86,692)
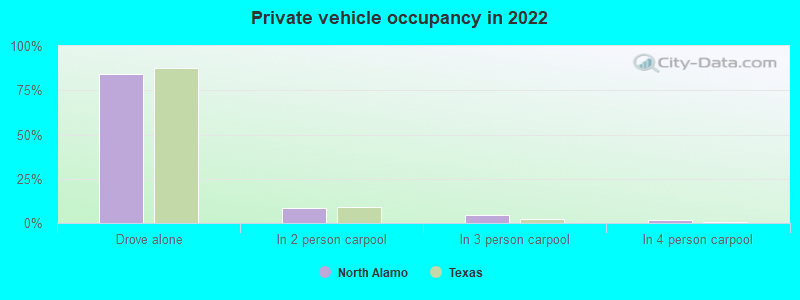
Private vehicle occupancy Drove alone: North Alamo:
84.1% (1,423)Texas:
87.6% (10,283,021)
In 2 person carpool: North Alamo:
8.7% (147)Texas:
9.0% (1,052,595)
In 3 person carpool: North Alamo:
4.6% (78)Texas:
2.1% (244,139)
In 4 person carpool: North Alamo:
1.7% (30)Texas:
0.8% (92,732)
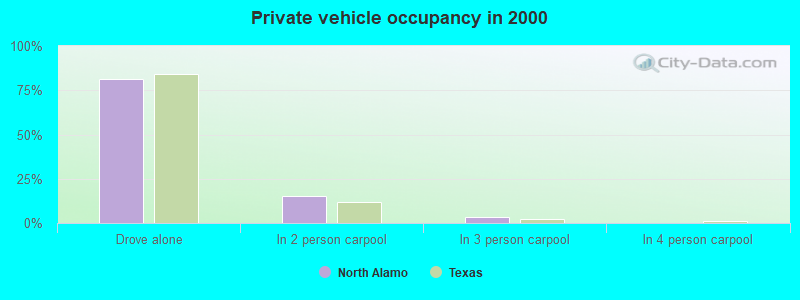
Drove alone: North Alamo:
81.3% (383)Texas:
84.3% (7,115,590)
In 2 person carpool: North Alamo:
15.1% (71)Texas:
11.6% (982,994)
In 3 person carpool: North Alamo:
3.6% (17)Texas:
2.4% (201,602)
Class of workers
Employee of private company: North Alamo:
67.6% (1,278)Texas:
69.6% (10,139,666)
Self-employed in own incorporated business: North Alamo:
0.6% (12)Texas:
3.5% (516,446)
Private not-for-profit wage and salary workers: North Alamo:
0.7% (13)Texas:
6.0% (870,454)
Local government workers: North Alamo:
17.2% (324)Texas:
7.6% (1,109,799)
State government workers: North Alamo:
5.6% (106)Texas:
3.8% (558,618)
Federal government workers: North Alamo:
1.0% (18)Texas:
2.5% (357,298)
Self-employed workers in own not incorporated business: North Alamo:
7.4% (139)Texas:
6.8% (998,270)
Employee of private company: North Alamo:
73.2% (371)Texas:
69.6% (6,425,274)
Self-employed in own incorporated business: North Alamo:
1.6% (8)Texas:
2.7% (250,864)
Private not-for-profit wage and salary workers: North Alamo:
7.3% (37)Texas:
5.7% (526,631)
Local government workers: North Alamo:
7.1% (36)Texas:
6.6% (608,479)
State government workers: North Alamo:
3.0% (15)Texas:
5.4% (501,082)
Federal government workers: North Alamo:
1.4% (7)Texas:
2.6% (237,177)
Self-employed workers in own not incorporated business: North Alamo:
6.5% (33)Texas:
7.1% (653,527)
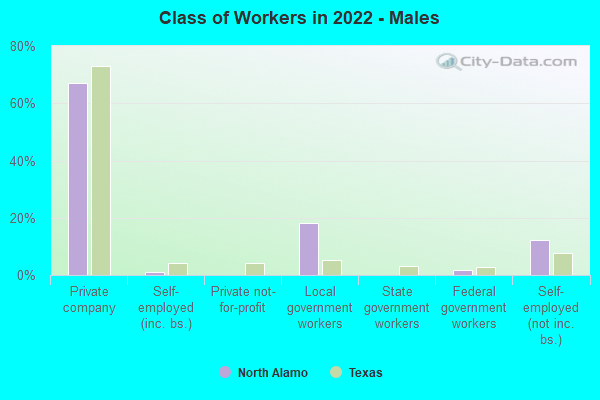
Employee of private company - Males: North Alamo:
66.9% (756)Texas:
73.1% (5,788,450)
Self-employed in own incorporated business - Males: North Alamo:
1.0% (12)Texas:
4.2% (332,655)
Local government workers - Males: North Alamo:
18.1% (204)Texas:
5.1% (405,467)
Federal government workers - Males: North Alamo:
1.6% (18)Texas:
2.7% (211,629)
Self-employed workers in own not incorporated business - Males: North Alamo:
12.3% (139)Texas:
7.7% (609,246)
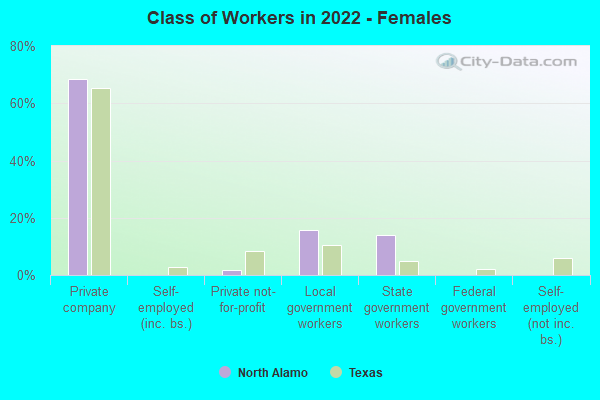
Employee of private company - Females: North Alamo:
68.5% (521)Texas:
65.4% (4,351,216)
Private not-for-profit wage and salary workers - Females: North Alamo:
1.7% (13)Texas:
8.2% (546,978)
Local government workers - Females: North Alamo:
15.8% (120)Texas:
10.6% (704,332)
State government workers - Females: North Alamo:
14.0% (106)Texas:
4.8% (321,912)