Work and Jobs in North Shore, Virginia (VA) Detailed Stats
Occupations, Industries, Unemployment, Workers, Commute
Settings
X


Recent posts about work in North Shore, Virginia on our local forum with over 2,400,000 registered users:
 | I think I love Reston... (41 replies) |
| anybody from Boston? (52 replies) |
| Calling NoVA Experts! Young Professional moving to work in Herndon! (12 replies) |
| JOb in Reston but I want to live closer to DC (10 replies) |
| How Religious is Lynchburg? (honestly) (96 replies) |
| Moving to NoVA (from rural MA)...wanting to simplify living. (26 replies) |
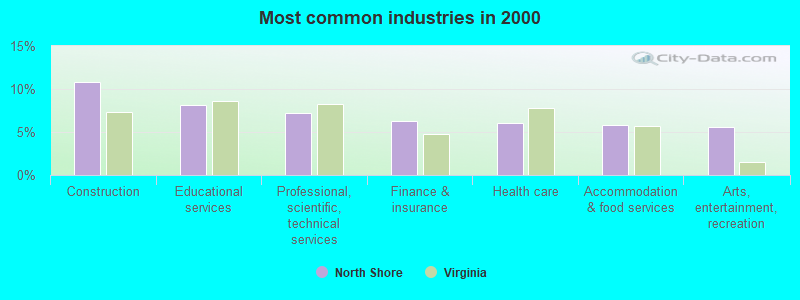
The most common industries in North Shore are: Construction (10.8% of civilian employees), Educational services (8.1% of civilian employees), Professional, scientific, technical services (7.3% of civilian employees). 57.0% of workers work in Franklin County and 26.3% of all workers work at home. 56.8% of workers are employees of private companies, which is 9.7% less than the rate of 62.3% across the entire state of Virginia.
Whole page based on the data from 2000 / 2022 when the population of North Shore, Virginia was 2,112 / 3,613
Whole page based on the data from 2000 / 2022 when the population of North Shore, Virginia was 2,112 / 3,613
Most common industries
Most common industries | |||
|---|---|---|---|
Industry | All | Males | Females |
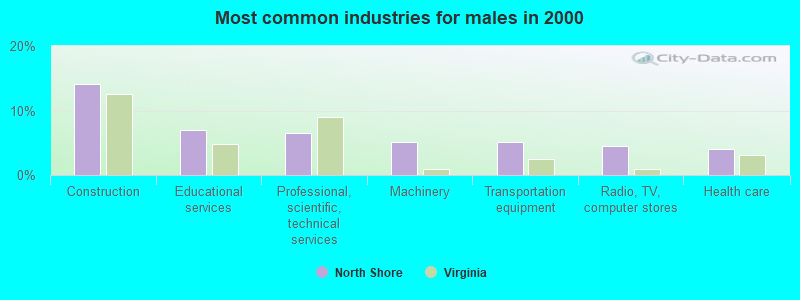
| Construction | 10.8% (104) | 14.1% (78) | 6.3% (26) |
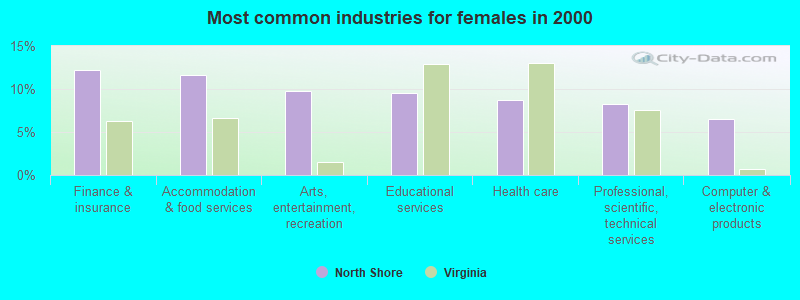
| Educational services | 8.1% (78) | 7.1% (39) | 9.5% (39) |
| Professional, scientific, and technical services | 7.3% (70) | 6.5% (36) | 8.3% (34) |
| Finance and insurance | 6.2% (60) | 1.8% (10) | 12.2% (50) |
| Health care | 6.0% (58) | 4.0% (22) | 8.8% (36) |
| Accommodation and food services | 5.8% (56) | 1.4% (8) | 11.7% (48) |
| Arts, entertainment, and recreation | 5.6% (54) | 2.5% (14) | 9.7% (40) |
| Furniture and home furnishings, and household appliance stores | 4.4% (42) | 3.8% (21) | 5.1% (21) |
| Computer and electronic products | 3.5% (34) | 1.3% (7) | 6.6% (27) |
| Furniture and related product manufacturing | 3.1% (30) | 3.4% (19) | 2.7% (11) |
| Real estate and rental and leasing | 3.1% (30) | 3.6% (20) | 2.4% (10) |
| Transportation equipment | 2.9% (28) | 5.1% (28) | 0.0% (0) |
| Machinery | 2.9% (28) | 5.1% (28) | 0.0% (0) |
| Radio, TV, and computer stores | 2.6% (25) | 4.5% (25) | 0.0% (0) |
| Miscellaneous manufacturing | 2.2% (21) | 3.8% (21) | 0.0% (0) |
| Used merchandise, gift, novelty, and souvenir, and other miscellaneous stores | 2.0% (19) | 1.4% (8) | 2.7% (11) |
| Building material and garden equipment and supplies dealers | 1.9% (18) | 1.6% (9) | 2.2% (9) |
| Metal and metal products | 1.9% (18) | 3.3% (18) | 0.0% (0) |
| Repair and maintenance | 1.9% (18) | 3.3% (18) | 0.0% (0) |
| Printing and related support activities | 1.7% (16) | 2.9% (16) | 0.0% (0) |
| Food and beverage stores | 1.6% (15) | 1.6% (9) | 1.5% (6) |
| Textile mills and textile products | 1.5% (14) | 2.5% (14) | 0.0% (0) |
| Religious, grantmaking, civic, professional, and similar organizations | 1.3% (13) | 2.4% (13) | 0.0% (0) |
| Clothing and accessories, including shoe, stores | 1.0% (10) | 0.0% (0) | 2.4% (10) |
| Administrative and support and waste management services | 1.0% (10) | 1.8% (10) | 0.0% (0) |
| Public administration | 0.9% (9) | 0.0% (0) | 2.2% (9) |
| Mining, quarrying, and oil and gas extraction | 0.9% (9) | 1.6% (9) | 0.0% (0) |
| Agriculture, forestry, fishing and hunting | 0.9% (9) | 1.6% (9) | 0.0% (0) |
| Retail florists | 0.8% (8) | 0.0% (0) | 1.9% (8) |
| Rail transportation | 0.8% (8) | 1.4% (8) | 0.0% (0) |
| U. S. Postal service | 0.8% (8) | 0.0% (0) | 1.9% (8) |
| Broadcasting and telecommunications | 0.8% (8) | 1.4% (8) | 0.0% (0) |
| Pharmacies and drug stores | 0.8% (8) | 0.0% (0) | 1.9% (8) |
| Farm product raw materials merchant wholesalers | 0.7% (7) | 1.3% (7) | 0.0% (0) |
| Other direct selling establishments | 0.7% (7) | 1.3% (7) | 0.0% (0) |
| Nonmetallic mineral products | 0.7% (7) | 1.3% (7) | 0.0% (0) |
| Truck transportation | 0.7% (7) | 1.3% (7) | 0.0% (0) |
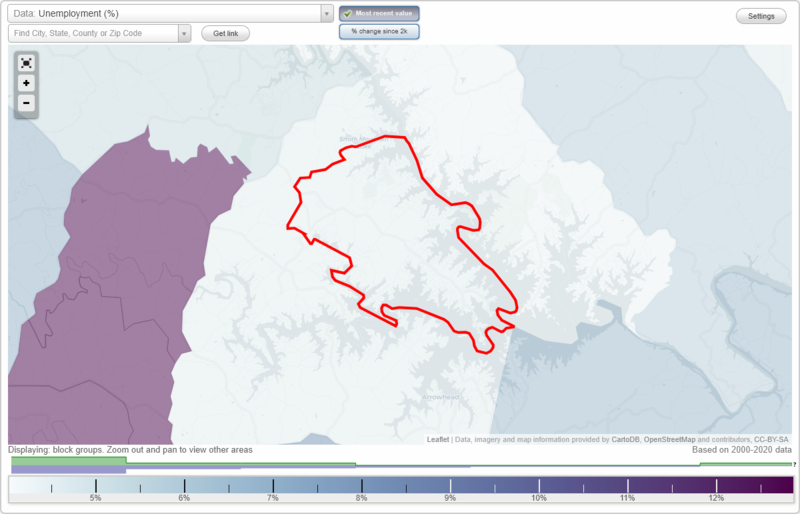
Unemployment in North Shore
- Unemployment by race in 2022
- Unemployment rate for White non-Hispanic residents
- 5.0%Males
- 1.5%Females
- Unemployment by race in 2000
- Unemployment rate for White non-Hispanic residents
- 3.4%Females
- Unemployment rate for two or more race residents
- 40.0%Males
Time leaving home to go to work
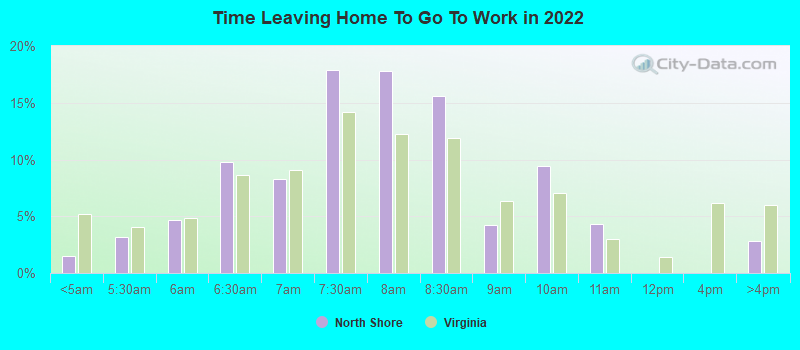
12:00 a.m. to 4:59 a.m.:
| North Shore: | 1.5% (14) |
| Virginia: | 5.2% (184,150) |
5:00 a.m. to 5:29 a.m.:
| North Shore: | 3.1% (29) |
| Virginia: | 4.0% (143,834) |
5:30 a.m. to 5:59 a.m.:
| North Shore: | 4.7% (43) |
| Virginia: | 4.8% (170,996) |
6:00 a.m. to 6:29 a.m.:
| North Shore: | 9.8% (90) |
| Virginia: | 8.6% (307,598) |
6:30 a.m. to 6:59 a.m.:
| North Shore: | 8.2% (75) |
| Virginia: | 9.1% (324,323) |
7:00 a.m. to 7:29 a.m.:
| North Shore: | 17.9% (163) |
| Virginia: | 14.2% (504,796) |
7:30 a.m. to 7:59 a.m.:
| North Shore: | 17.8% (162) |
| Virginia: | 12.3% (436,196) |
8:00 a.m. to 8:29 a.m.:
| North Shore: | 15.6% (142) |
| Virginia: | 11.9% (422,834) |
8:30 a.m. to 8:59 a.m.:
| North Shore: | 4.3% (39) |
| Virginia: | 6.3% (224,568) |
9:00 a.m. to 9:59 a.m.:
| North Shore: | 9.4% (86) |
| Virginia: | 7.0% (250,122) |
10:00 a.m. to 10:59 a.m.:
| North Shore: | 4.3% (40) |
| Virginia: | 3.0% (105,732) |
4:00 p.m. to 11:59 p.m.:
| North Shore: | 2.8% (26) |
| Virginia: | 6.0% (214,315) |
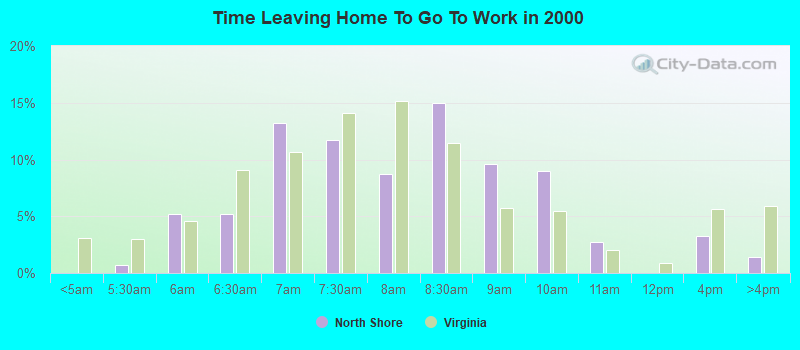
5:30am:
| North Shore: | 0.7% (7) |
| Virginia: | 3.0% (104,536) |
6am:
| North Shore: | 5.2% (49) |
| Virginia: | 4.6% (160,804) |
6:30am:
| North Shore: | 5.2% (49) |
| Virginia: | 9.1% (316,895) |
7am:
| North Shore: | 13.2% (125) |
| Virginia: | 10.7% (372,448) |
7:30am:
| North Shore: | 11.8% (111) |
| Virginia: | 14.1% (491,661) |
8am:
| North Shore: | 8.7% (82) |
| Virginia: | 15.1% (526,342) |
8:30am:
| North Shore: | 14.9% (141) |
| Virginia: | 11.5% (399,738) |
9am:
| North Shore: | 9.6% (91) |
| Virginia: | 5.8% (200,280) |
10am:
| North Shore: | 9.0% (85) |
| Virginia: | 5.5% (190,998) |
11am:
| North Shore: | 2.8% (26) |
| Virginia: | 2.0% (69,788) |
4pm:
| North Shore: | 3.3% (31) |
| Virginia: | 5.6% (196,554) |
>4pm:
| North Shore: | 1.4% (13) |
| Virginia: | 5.9% (204,265) |
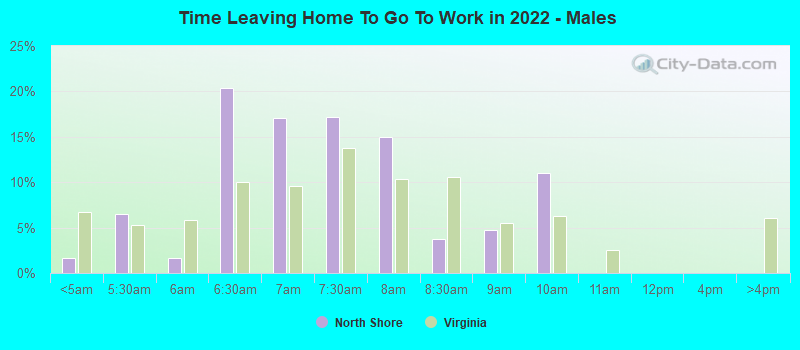
12:00 a.m. to 4:59 a.m. - Males:
| North Shore: | 1.6% (7) |
| Virginia: | 6.8% (129,709) |
5:00 a.m. to 5:29 a.m. - Males:
| North Shore: | 6.5% (28) |
| Virginia: | 5.3% (101,619) |
5:30 a.m. to 5:59 a.m. - Males:
| North Shore: | 1.7% (7) |
| Virginia: | 5.9% (112,784) |
6:00 a.m. to 6:29 a.m. - Males:
| North Shore: | 20.4% (90) |
| Virginia: | 10.0% (191,463) |
6:30 a.m. to 6:59 a.m. - Males:
| North Shore: | 17.0% (75) |
| Virginia: | 9.5% (182,672) |
7:00 a.m. to 7:29 a.m. - Males:
| North Shore: | 17.2% (76) |
| Virginia: | 13.8% (264,728) |
7:30 a.m. to 7:59 a.m. - Males:
| North Shore: | 15.0% (66) |
| Virginia: | 10.4% (198,372) |
8:00 a.m. to 8:29 a.m. - Males:
| North Shore: | 3.8% (17) |
| Virginia: | 10.6% (202,530) |
8:30 a.m. to 8:59 a.m. - Males:
| North Shore: | 4.8% (21) |
| Virginia: | 5.5% (105,302) |
9:00 a.m. to 9:59 a.m. - Males:
| North Shore: | 11.0% (48) |
| Virginia: | 6.3% (120,452) |
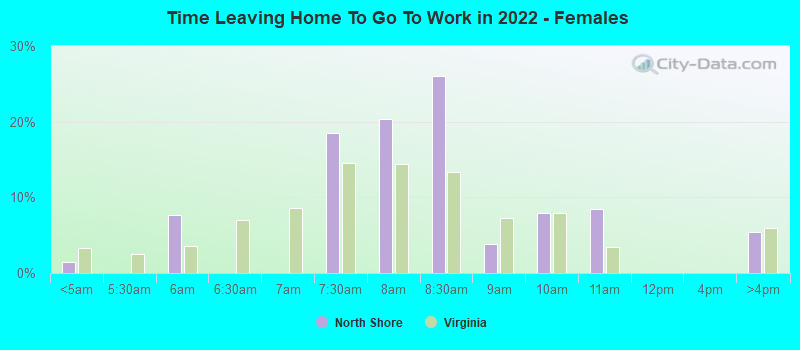
12:00 a.m. to 4:59 a.m. - Females:
| North Shore: | 1.5% (7) |
| Virginia: | 3.3% (54,441) |
5:30 a.m. to 5:59 a.m. - Females:
| North Shore: | 7.6% (36) |
| Virginia: | 3.5% (58,212) |
7:00 a.m. to 7:29 a.m. - Females:
| North Shore: | 18.5% (87) |
| Virginia: | 14.6% (240,068) |
7:30 a.m. to 7:59 a.m. - Females:
| North Shore: | 20.4% (96) |
| Virginia: | 14.5% (237,824) |
8:00 a.m. to 8:29 a.m. - Females:
| North Shore: | 26.1% (123) |
| Virginia: | 13.4% (220,304) |
8:30 a.m. to 8:59 a.m. - Females:
| North Shore: | 3.8% (18) |
| Virginia: | 7.3% (119,266) |
9:00 a.m. to 9:59 a.m. - Females:
| North Shore: | 8.0% (38) |
| Virginia: | 7.9% (129,670) |
10:00 a.m. to 10:59 a.m. - Females:
| North Shore: | 8.4% (40) |
| Virginia: | 3.4% (56,591) |
4:00 p.m. to 11:59 p.m. - Females:
| North Shore: | 5.4% (26) |
| Virginia: | 6.0% (98,286) |
Travel time to work
Percentage of workers working in this county: 57.0%
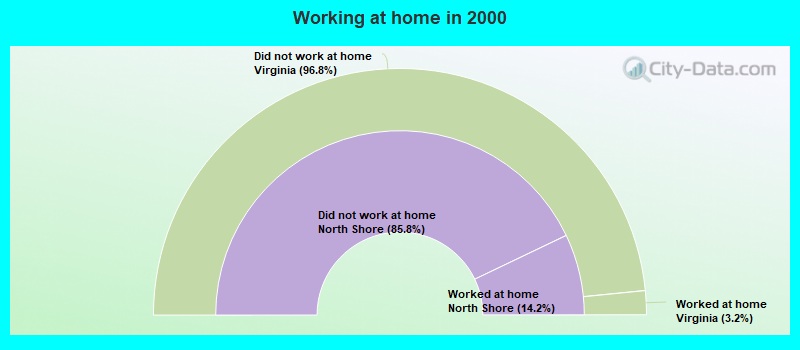
Number of people working at home: 341 (26.3% of all workers)
Number of people working at home: 341 (26.3% of all workers)
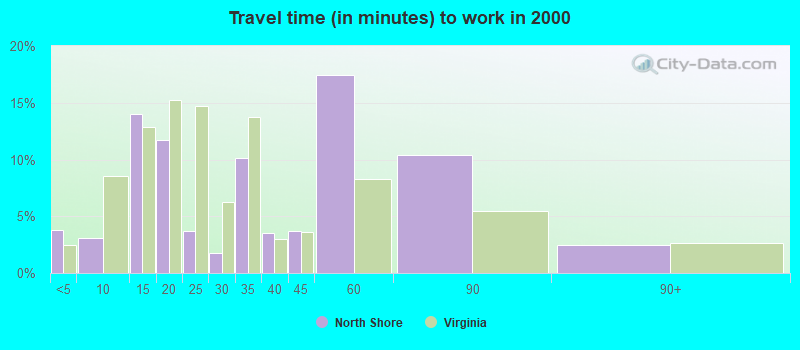
Less than 5 minutes:
| North Shore: | 3.8% (36) |
| Virginia: | 2.4% (85,207) |
5 to 9 minutes:
| North Shore: | 3.1% (29) |
| Virginia: | 8.5% (296,082) |
10 to 14 minutes:
| North Shore: | 14.0% (132) |
| Virginia: | 12.9% (448,126) |
15 to 19 minutes:
| North Shore: | 11.8% (111) |
| Virginia: | 15.2% (530,128) |
20 to 24 minutes:
| North Shore: | 3.7% (35) |
| Virginia: | 14.7% (513,490) |
25 to 29 minutes:
| North Shore: | 1.8% (17) |
| Virginia: | 6.2% (217,273) |
30 to 34 minutes:
| North Shore: | 10.2% (96) |
| Virginia: | 13.7% (478,666) |
35 to 39 minutes:
| North Shore: | 3.5% (33) |
| Virginia: | 3.0% (103,937) |
40 to 44 minutes:
| North Shore: | 3.7% (35) |
| Virginia: | 3.7% (127,218) |
45 to 59 minutes:
| North Shore: | 17.5% (165) |
| Virginia: | 8.3% (289,734) |
60 to 89 minutes:
| North Shore: | 10.4% (98) |
| Virginia: | 5.4% (189,384) |
90 or more minutes:
| North Shore: | 2.4% (23) |
| Virginia: | 2.7% (92,508) |
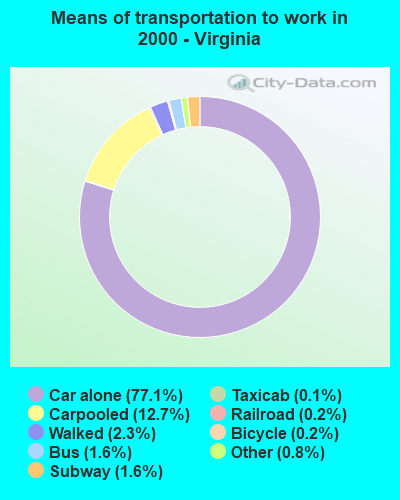
Means of transportation to work
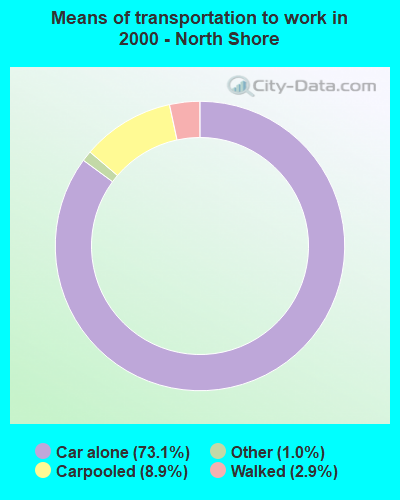
Drove car alone:
| North Shore: | 73.1% (690) |
| Virginia: | 77.1% (2,685,914) |
Carpooled:
| North Shore: | 8.9% (84) |
| Virginia: | 12.7% (441,093) |
Walked:
| North Shore: | 2.9% (27) |
| Virginia: | 2.3% (80,487) |
Other means:
| North Shore: | 1.0% (9) |
| Virginia: | 0.8% (28,983) |
Private vehicle occupancy
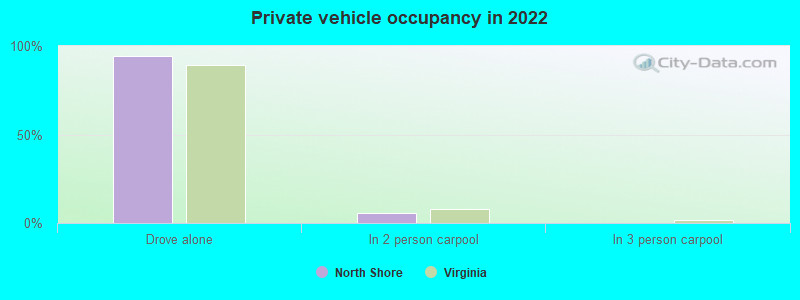
Drove alone:
| North Shore: | 94.5% (869) |
| Virginia: | 89.4% (2,955,039) |
In 2 person carpool:
| North Shore: | 5.4% (50) |
| Virginia: | 7.8% (259,148) |
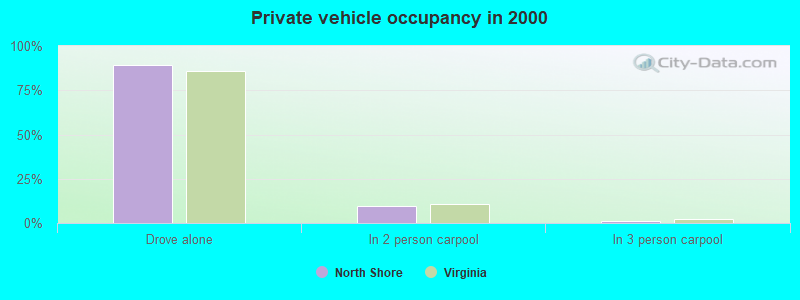
Drove alone:
| North Shore: | 89.1% (690) |
| Virginia: | 85.9% (2,685,914) |
In 2 person carpool:
| North Shore: | 9.8% (76) |
| Virginia: | 10.6% (329,961) |
In 3 person carpool:
| North Shore: | 1.0% (8) |
| Virginia: | 2.2% (69,338) |
Class of workers
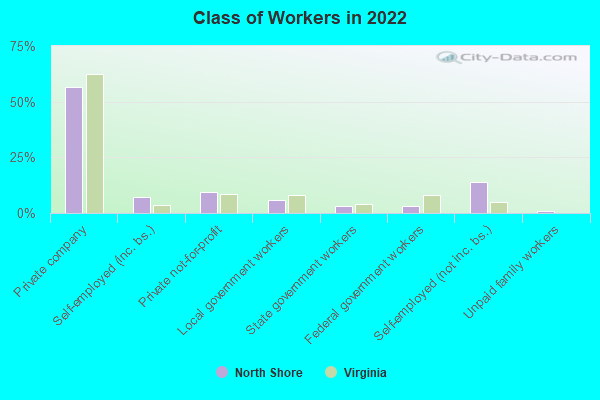
Employee of private company:
| North Shore: | 56.8% (743) |
| Virginia: | 62.3% (2,679,819) |
Self-employed in own incorporated business:
| North Shore: | 7.1% (93) |
| Virginia: | 3.7% (159,727) |
Private not-for-profit wage and salary workers:
| North Shore: | 9.3% (121) |
| Virginia: | 8.4% (359,054) |
Local government workers:
| North Shore: | 5.7% (74) |
| Virginia: | 8.1% (347,176) |
State government workers:
| North Shore: | 3.3% (43) |
| Virginia: | 4.1% (175,990) |
Federal government workers:
| North Shore: | 2.9% (38) |
| Virginia: | 8.3% (354,980) |
Self-employed workers in own not incorporated business:
| North Shore: | 14.1% (184) |
| Virginia: | 5.0% (216,243) |
Unpaid family workers:
| North Shore: | 0.9% (11) |
| Virginia: | 0.1% (5,572) |
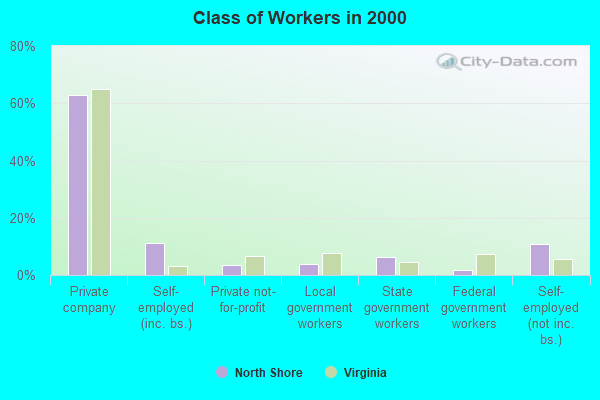
Employee of private company:
| North Shore: | 63.0% (607) |
| Virginia: | 64.9% (2,214,133) |
Self-employed in own incorporated business:
| North Shore: | 11.1% (107) |
| Virginia: | 3.1% (105,080) |
Private not-for-profit wage and salary workers:
| North Shore: | 3.3% (32) |
| Virginia: | 6.7% (228,777) |
Local government workers:
| North Shore: | 3.7% (36) |
| Virginia: | 7.9% (268,029) |
State government workers:
| North Shore: | 6.4% (62) |
| Virginia: | 4.4% (149,085) |
Federal government workers:
| North Shore: | 1.8% (17) |
| Virginia: | 7.4% (251,461) |
Self-employed workers in own not incorporated business:
| North Shore: | 10.7% (103) |
| Virginia: | 5.5% (188,035) |
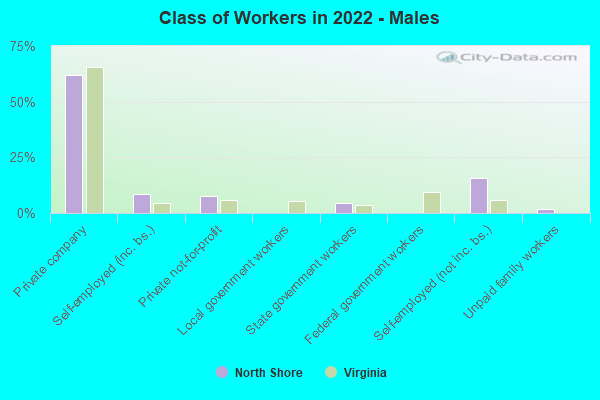
Employee of private company - Males:
| North Shore: | 62.1% (421) |
| Virginia: | 65.6% (1,465,158) |
Self-employed in own incorporated business - Males:
| North Shore: | 8.7% (59) |
| Virginia: | 4.6% (102,356) |
Private not-for-profit wage and salary workers - Males:
| North Shore: | 7.6% (52) |
| Virginia: | 5.7% (128,261) |
State government workers - Males:
| North Shore: | 4.5% (30) |
| Virginia: | 3.5% (78,080) |
Self-employed workers in own not incorporated business - Males:
| North Shore: | 15.5% (105) |
| Virginia: | 5.6% (125,765) |
Unpaid family workers - Males:
| North Shore: | 1.6% (11) |
| Virginia: | 0.1% (2,904) |
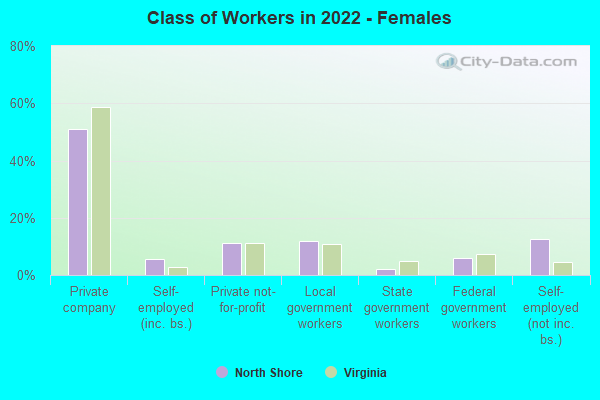
Employee of private company - Females:
| North Shore: | 51.1% (322) |
| Virginia: | 58.8% (1,214,661) |
Self-employed in own incorporated business - Females:
| North Shore: | 5.5% (34) |
| Virginia: | 2.8% (57,371) |
Private not-for-profit wage and salary workers - Females:
| North Shore: | 11.1% (70) |
| Virginia: | 11.2% (230,793) |
Local government workers - Females:
| North Shore: | 11.7% (74) |
| Virginia: | 10.8% (223,369) |
State government workers - Females:
| North Shore: | 1.9% (12) |
| Virginia: | 4.7% (97,910) |
Federal government workers - Females:
| North Shore: | 6.1% (38) |
| Virginia: | 7.2% (149,367) |
Self-employed workers in own not incorporated business - Females:
| North Shore: | 12.5% (79) |
| Virginia: | 4.4% (90,478) |