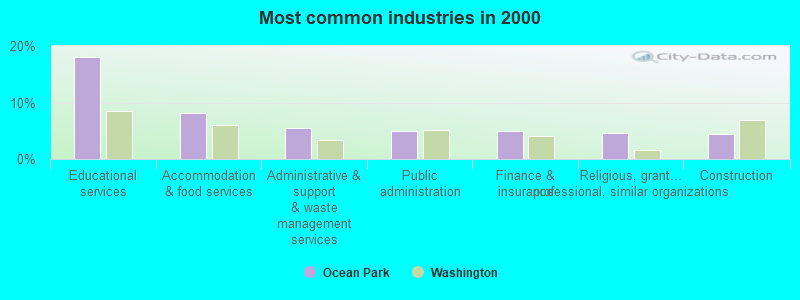
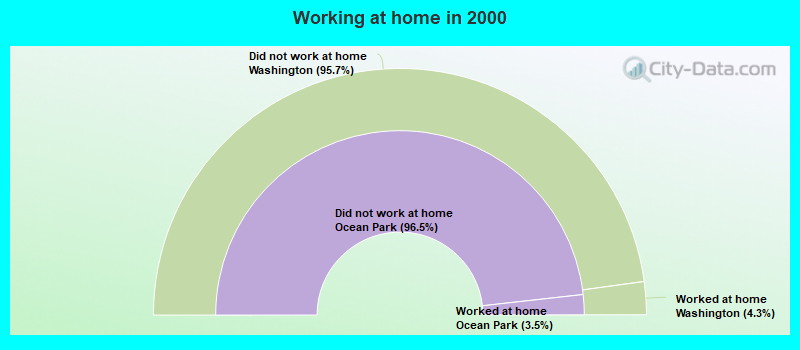
The most common industries in Ocean Park are: Educational services (18.0% of civilian employees), Accommodation & food services (8.2% of civilian employees), Administrative & support & waste management services (5.4% of civilian employees). 82.2% of workers work in Pacific County and 13.8% of all workers work at home. 70.4% of workers are employees of private companies, which is 6.2% greater than the rate of 66.0% across the entire state of Washington.
Whole page based on the data from 2000 / 2022 when the population of Ocean Park, Washington was 1,459 / 1,930
Most common industries
Most common industries
Industry
All
Males
Females
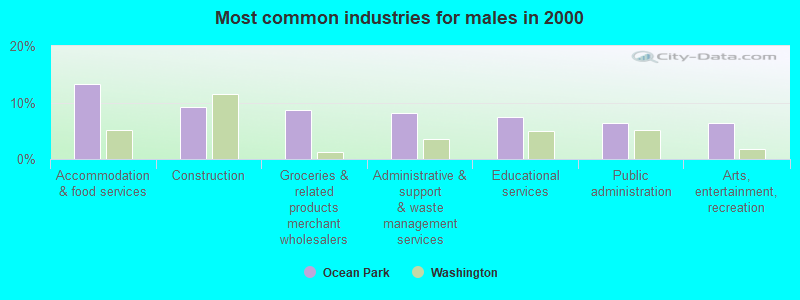
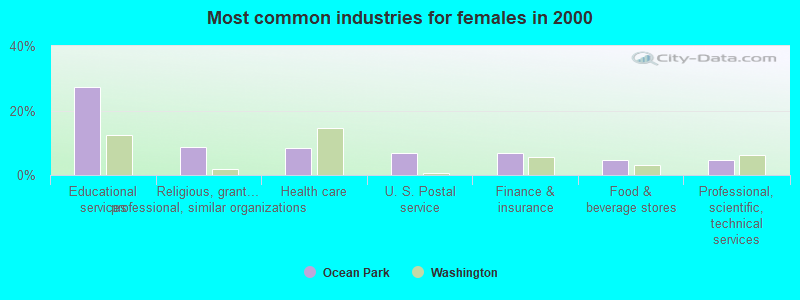
Educational services
18.0% (66)
7.5% (13)
27.3% (53)
Accommodation and food services
8.2% (30)
13.3% (23)
3.6% (7)
Administrative and support and waste management services
5.4% (20)
8.1% (14)
3.1% (6)
Public administration
4.9% (18)
6.4% (11)
3.6% (7)
Finance and insurance
4.9% (18)
2.9% (5)
6.7% (13)
Religious, grantmaking, civic, professional, and similar organizations
4.6% (17)
0.0% (0)
8.8% (17)
Construction
4.4% (16)
9.2% (16)
0.0% (0)
Health care
4.4% (16)
0.0% (0)
8.2% (16)
Groceries and related products merchant wholesalers
4.1% (15)
8.7% (15)
0.0% (0)
Truck transportation
3.8% (14)
4.6% (8)
3.1% (6)
Utilities
3.8% (14)
4.0% (7)
3.6% (7)
Broadcasting and telecommunications
3.8% (14)
4.0% (7)
3.6% (7)
U. S. Postal service
3.5% (13)
0.0% (0)
6.7% (13)
Social assistance
3.5% (13)
3.5% (6)
3.6% (7)
Arts, entertainment, and recreation
3.0% (11)
6.4% (11)
0.0% (0)
Used merchandise, gift, novelty, and souvenir, and other miscellaneous stores
2.7% (10)
2.9% (5)
2.6% (5)
Building material and garden equipment and supplies dealers
2.5% (9)
5.2% (9)
0.0% (0)
Food and beverage stores
2.5% (9)
0.0% (0)
4.6% (9)
Professional, scientific, and technical services
2.5% (9)
0.0% (0)
4.6% (9)
Agriculture, forestry, fishing and hunting
2.2% (8)
4.6% (8)
0.0% (0)
Repair and maintenance
2.2% (8)
4.6% (8)
0.0% (0)
Lumber and other construction materials merchant wholesalers
1.9% (7)
4.0% (7)
0.0% (0)
Private households
1.9% (7)
0.0% (0)
3.6% (7)
Other transportation, and support activities, and couriers
1.4% (5)
0.0% (0)
2.6% (5)
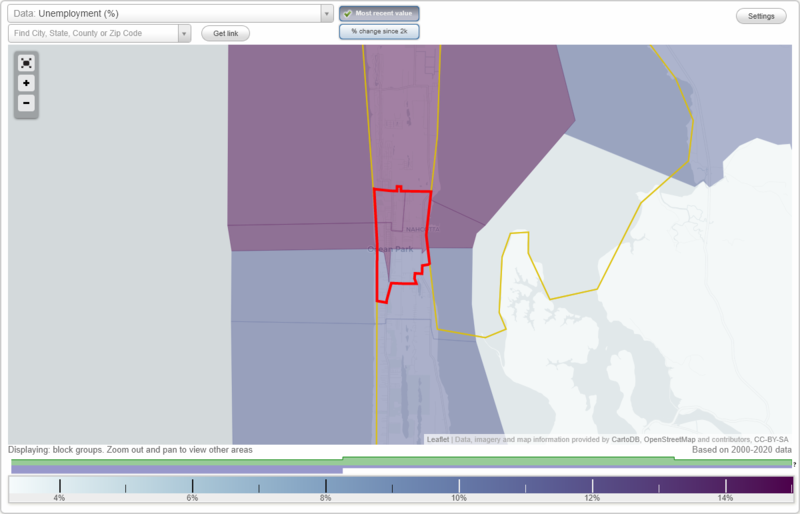
Unemployment in Ocean Park
Unemployment by race in 2022
Unemployment rate for White non-Hispanic residents
6.0%Females
Unemployment rate for other race residents
22.6%Males
Unemployment rate for Hispanic or Latino residents
24.1%Males
Unemployment by race in 2000
Unemployment rate for White non-Hispanic residents
11.5%Males
5.0%Females
Unemployment rate for American Indian and Alaska Native residents
50.0%Males
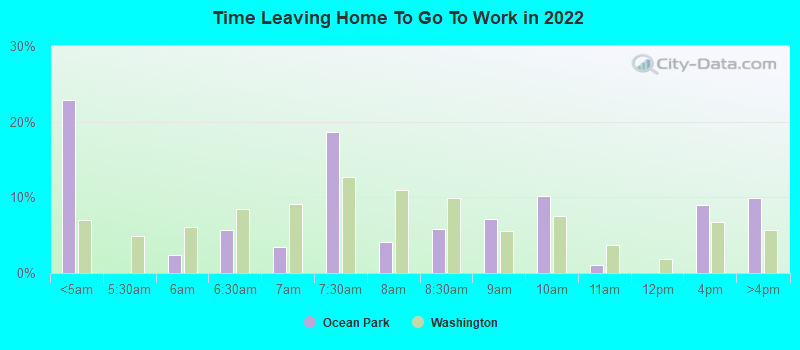
Time leaving home to go to work
12:00 a.m. to 4:59 a.m.:
Ocean Park:
22.8% (112)
Washington:
7.0% (213,920)
5:30 a.m. to 5:59 a.m.:
Ocean Park:
2.4% (12)
Washington:
6.1% (185,330)
6:00 a.m. to 6:29 a.m.:
Ocean Park:
5.7% (28)
Washington:
8.4% (257,617)
6:30 a.m. to 6:59 a.m.:
Ocean Park:
3.4% (17)
Washington:
9.1% (277,560)
7:00 a.m. to 7:29 a.m.:
Ocean Park:
18.7% (91)
Washington:
12.7% (387,691)
7:30 a.m. to 7:59 a.m.:
Ocean Park:
4.1% (20)
Washington:
11.0% (335,322)
8:00 a.m. to 8:29 a.m.:
Ocean Park:
5.8% (29)
Washington:
10.0% (304,814)
8:30 a.m. to 8:59 a.m.:
Ocean Park:
7.2% (35)
Washington:
5.5% (169,492)
9:00 a.m. to 9:59 a.m.:
Ocean Park:
10.1% (50)
Washington:
7.6% (231,053)
10:00 a.m. to 10:59 a.m.:
Ocean Park:
1.1% (5)
Washington:
3.7% (111,784)
12:00 p.m. to 3:59 p.m.:
Ocean Park:
9.0% (44)
Washington:
6.7% (205,284)
4:00 p.m. to 11:59 p.m.:
Ocean Park:
9.9% (48)
Washington:
5.7% (174,677)
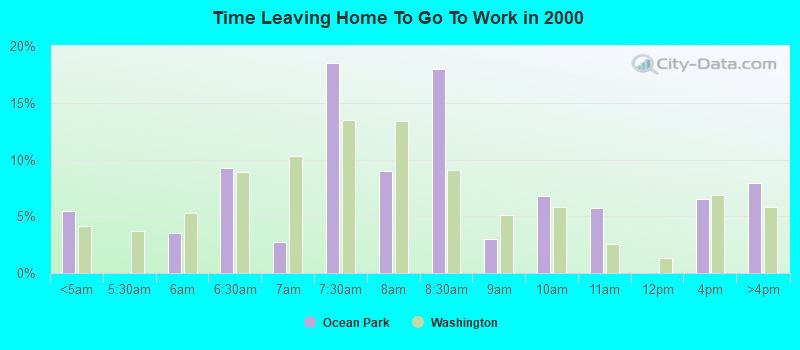
<5am:
Ocean Park:
5.4% (20)
Washington:
4.2% (115,997)
6am:
Ocean Park:
3.5% (13)
Washington:
5.3% (147,812)
6:30am:
Ocean Park:
9.3% (34)
Washington:
8.9% (248,462)
7am:
Ocean Park:
2.7% (10)
Washington:
10.3% (288,005)
7:30am:
Ocean Park:
18.5% (68)
Washington:
13.5% (375,030)
8am:
Ocean Park:
9.0% (33)
Washington:
13.4% (372,576)
8:30am:
Ocean Park:
18.0% (66)
Washington:
9.0% (252,058)
9am:
Ocean Park:
3.0% (11)
Washington:
5.1% (141,936)
10am:
Ocean Park:
6.8% (25)
Washington:
5.8% (161,204)
11am:
Ocean Park:
5.7% (21)
Washington:
2.5% (70,123)
4pm:
Ocean Park:
6.5% (24)
Washington:
6.8% (190,565)
>4pm:
Ocean Park:
7.9% (29)
Washington:
5.8% (162,401)
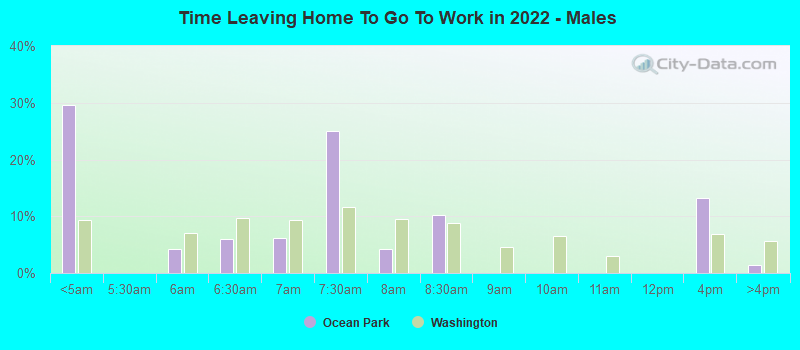
12:00 a.m. to 4:59 a.m. - Males:
Ocean Park:
29.6% (83)
Washington:
9.3% (158,516)
5:30 a.m. to 5:59 a.m. - Males:
Ocean Park:
4.2% (12)
Washington:
7.1% (120,772)
6:00 a.m. to 6:29 a.m. - Males:
Ocean Park:
5.9% (17)
Washington:
9.8% (166,050)
6:30 a.m. to 6:59 a.m. - Males:
Ocean Park:
6.1% (17)
Washington:
9.3% (158,128)
7:00 a.m. to 7:29 a.m. - Males:
Ocean Park:
25.1% (70)
Washington:
11.7% (198,720)
7:30 a.m. to 7:59 a.m. - Males:
Ocean Park:
4.2% (12)
Washington:
9.6% (162,900)
8:00 a.m. to 8:29 a.m. - Males:
Ocean Park:
10.2% (29)
Washington:
8.8% (149,907)
12:00 p.m. to 3:59 p.m. - Males:
Ocean Park:
13.2% (37)
Washington:
6.8% (115,643)
4:00 p.m. to 11:59 p.m. - Males:
Ocean Park:
1.4% (4)
Washington:
5.6% (95,440)
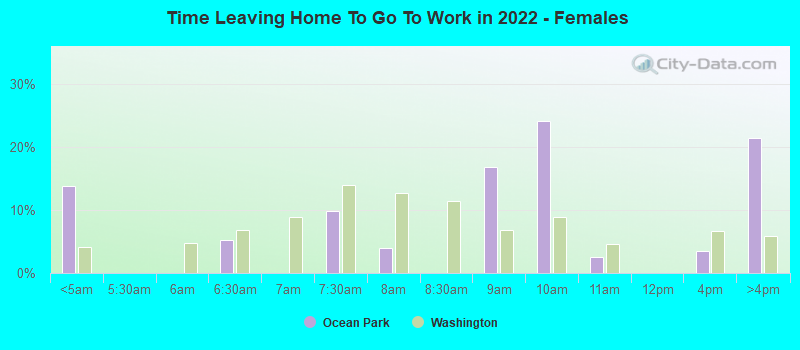
12:00 a.m. to 4:59 a.m. - Females:
Ocean Park:
13.8% (29)
Washington:
4.1% (55,404)
6:00 a.m. to 6:29 a.m. - Females:
Ocean Park:
5.3% (11)
Washington:
6.8% (91,567)
7:00 a.m. to 7:29 a.m. - Females:
Ocean Park:
9.9% (21)
Washington:
13.9% (188,971)
7:30 a.m. to 7:59 a.m. - Females:
Ocean Park:
4.0% (8)
Washington:
12.7% (172,422)
8:30 a.m. to 8:59 a.m. - Females:
Ocean Park:
16.8% (35)
Washington:
6.8% (92,720)
9:00 a.m. to 9:59 a.m. - Females:
Ocean Park:
24.1% (51)
Washington:
8.8% (119,802)
10:00 a.m. to 10:59 a.m. - Females:
Ocean Park:
2.6% (5)
Washington:
4.6% (61,816)
12:00 p.m. to 3:59 p.m. - Females:
Ocean Park:
3.5% (7)
Washington:
6.6% (89,641)
4:00 p.m. to 11:59 p.m. - Females:
Ocean Park:
21.4% (45)
Washington:
5.8% (79,237)
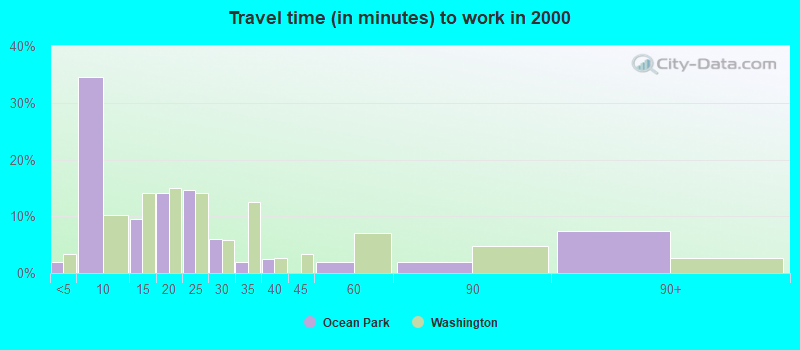
Travel time to work
Percentage of workers working in this county: 82.2% Number of people working at home: 83 (13.8% of all workers)
Less than 5 minutes:
Ocean Park:
1.9% (7)
Washington:
3.3% (91,132)
5 to 9 minutes:
Ocean Park:
34.6% (127)
Washington:
10.3% (286,517)
10 to 14 minutes:
Ocean Park:
9.5% (35)
Washington:
14.1% (391,606)
15 to 19 minutes:
Ocean Park:
14.2% (52)
Washington:
15.0% (418,990)
20 to 24 minutes:
Ocean Park:
14.7% (54)
Washington:
14.2% (394,209)
25 to 29 minutes:
Ocean Park:
6.0% (22)
Washington:
5.8% (162,590)
30 to 34 minutes:
Ocean Park:
1.9% (7)
Washington:
12.5% (348,311)
35 to 39 minutes:
Ocean Park:
2.5% (9)
Washington:
2.6% (73,592)
45 to 59 minutes:
Ocean Park:
1.9% (7)
Washington:
7.0% (195,343)
60 to 89 minutes:
Ocean Park:
1.9% (7)
Washington:
4.7% (131,691)
90 or more minutes:
Ocean Park:
7.4% (27)
Washington:
2.7% (75,486)
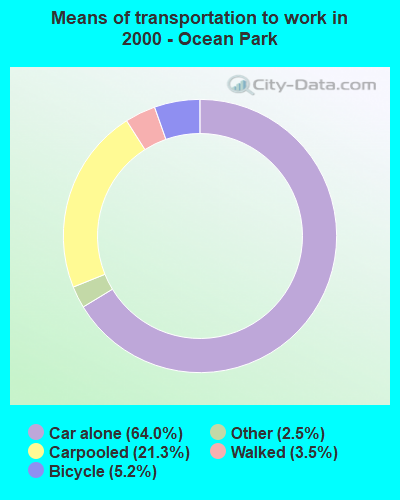
Means of transportation to work
Drove car alone:
Ocean Park:
64.0% (235)
Washington:
73.3% (2,040,833)
Carpooled:
Ocean Park:
21.3% (78)
Washington:
12.8% (357,742)
Bicycle:
Ocean Park:
5.2% (19)
Washington:
0.6% (16,205)
Walked:
Ocean Park:
3.5% (13)
Washington:
3.2% (89,739)
Other means:
Ocean Park:
2.5% (9)
Washington:
0.7% (19,499)
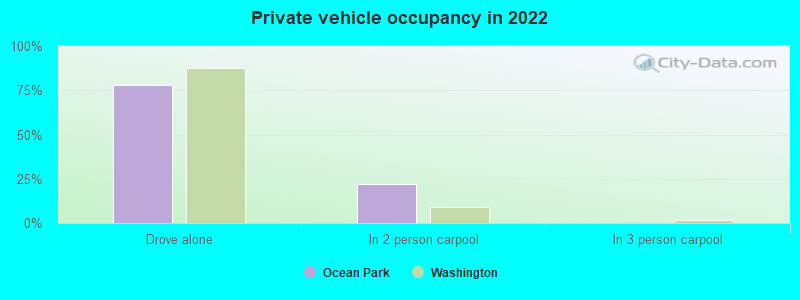
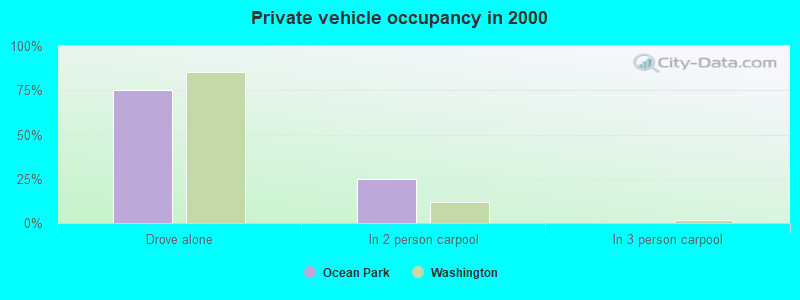
Private vehicle occupancy
Drove alone:
Ocean Park:
77.9% (380)
Washington:
87.8% (2,415,775)
In 2 person carpool:
Ocean Park:
22.1% (108)
Washington:
9.2% (252,715)
Drove alone:
Ocean Park:
75.1% (235)
Washington:
85.1% (2,040,833)
In 2 person carpool:
Ocean Park:
24.9% (78)
Washington:
11.8% (282,638)
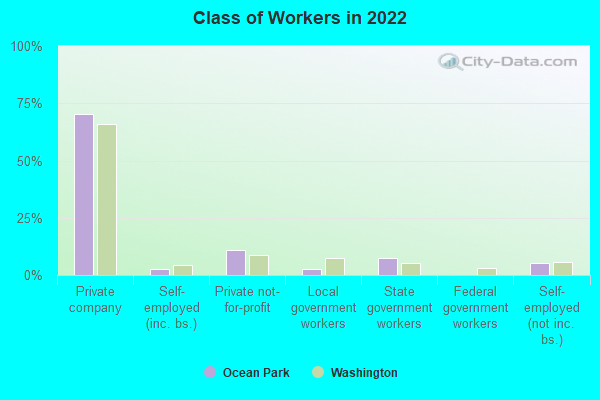
Class of workers
Employee of private company:
Ocean Park:
70.4% (437)
Washington:
66.0% (2,552,907)
Self-employed in own incorporated business:
Ocean Park:
2.7% (16)
Washington:
4.2% (161,426)
Private not-for-profit wage and salary workers:
Ocean Park:
11.1% (69)
Washington:
8.6% (330,637)
Local government workers:
Ocean Park:
2.8% (18)
Washington:
7.3% (281,034)
State government workers:
Ocean Park:
7.6% (47)
Washington:
5.2% (201,670)
Self-employed workers in own not incorporated business:
Ocean Park:
5.3% (33)
Washington:
5.5% (212,937)
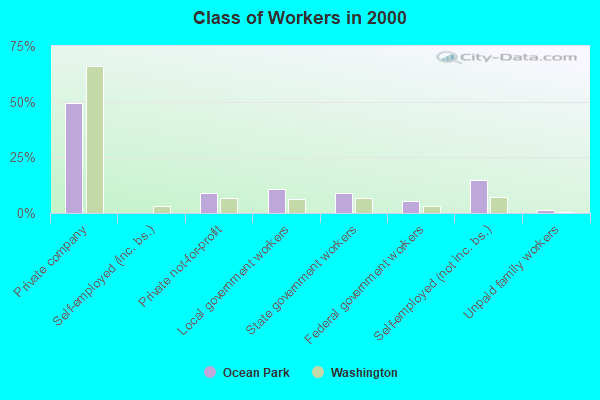
Employee of private company:
Ocean Park:
49.3% (181)
Washington:
66.0% (1,843,000)
Private not-for-profit wage and salary workers:
Ocean Park:
9.0% (33)
Washington:
6.9% (191,927)
Local government workers:
Ocean Park:
10.9% (40)
Washington:
6.4% (178,161)
State government workers:
Ocean Park:
9.0% (33)
Washington:
6.9% (192,408)
Federal government workers:
Ocean Park:
5.4% (20)
Washington:
3.2% (89,153)
Self-employed workers in own not incorporated business:
Ocean Park:
15.0% (55)
Washington:
7.2% (199,827)
Unpaid family workers:
Ocean Park:
1.4% (5)
Washington:
0.3% (9,144)
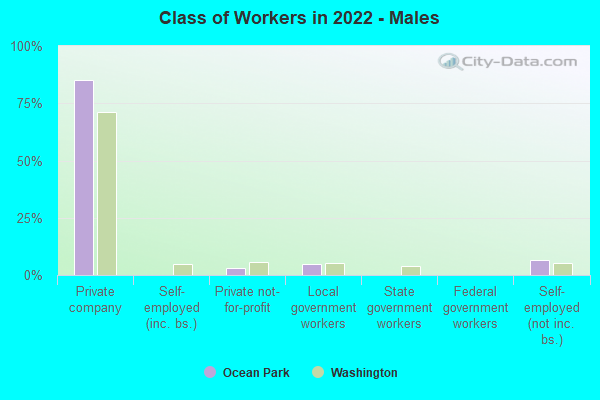
Employee of private company - Males:
Ocean Park:
85.0% (298)
Washington:
71.1% (1,491,511)
Private not-for-profit wage and salary workers - Males:
Ocean Park:
3.2% (11)
Washington:
5.5% (116,374)
Local government workers - Males:
Ocean Park:
5.0% (18)
Washington:
5.4% (114,033)
Self-employed workers in own not incorporated business - Males:
Ocean Park:
6.8% (24)
Washington:
5.4% (113,810)
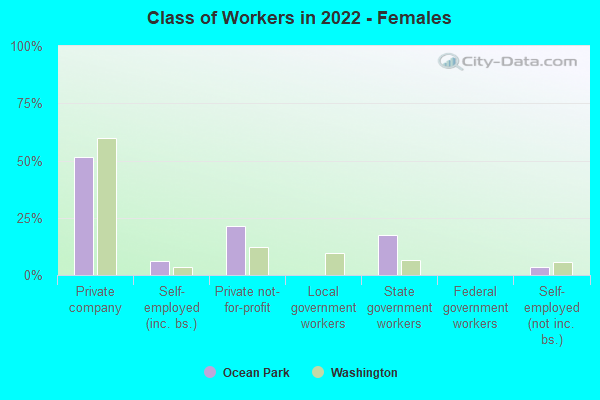
Employee of private company - Females:
Ocean Park:
51.5% (139)
Washington:
60.0% (1,061,396)
Self-employed in own incorporated business - Females:
Ocean Park:
6.1% (16)
Washington:
3.3% (58,377)
Private not-for-profit wage and salary workers - Females:
Ocean Park:
21.4% (58)
Washington:
12.1% (214,263)
State government workers - Females:
Ocean Park:
17.6% (47)
Washington:
6.6% (116,701)
Self-employed workers in own not incorporated business - Females:
Ocean Park:
3.4% (9)
Washington:
5.6% (99,127)
Discuss Ocean Park, Washington (WA) on our hugely popular Washington forum.