Work and Jobs in Opportunity, Washington (WA) Detailed Stats
Occupations, Industries, Unemployment, Workers, Commute

Recent posts about work in Opportunity, Washington on our local forum with over 2,400,000 registered users:
 | Low Income Senior housing Spokane (7 replies) |
| Short Term Apartment/Home Rental (1 reply) |
| safe fun area to live in spokane area (6 replies) |
Latest news about work in Opportunity, WA collected exclusively by city-data.com from local newspapers, TV, and radio stations
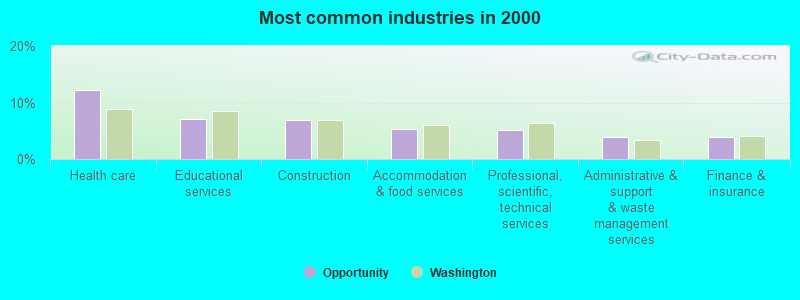
The most common industries in Opportunity are: Health care (12.2% of civilian employees), Educational services (7.1% of civilian employees), Construction (6.8% of civilian employees). 71.2% of workers are employees of private companies, which is 7.4% greater than the rate of 66.0% across the entire state of Washington.
Most common industries
Most common industries | |||
|---|---|---|---|
Industry | All | Males | Females |
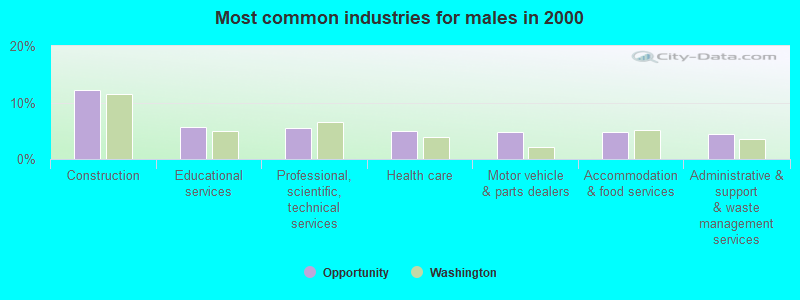
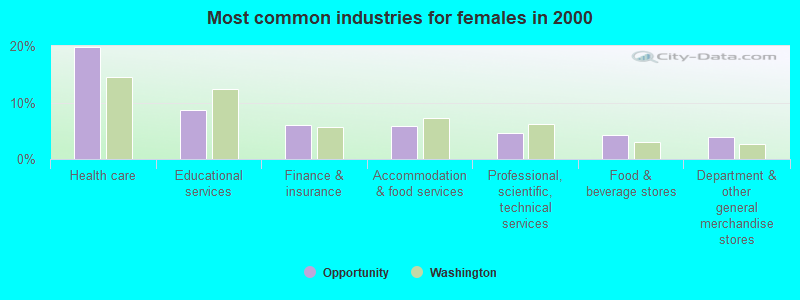
| Health care | 12.2% (1,453) | 4.9% (300) | 19.9% (1,153) |
| Educational services | 7.1% (849) | 5.7% (348) | 8.6% (501) |
| Construction | 6.8% (814) | 12.2% (746) | 1.2% (68) |
| Accommodation and food services | 5.3% (629) | 4.8% (291) | 5.8% (338) |
| Professional, scientific, and technical services | 5.1% (612) | 5.6% (340) | 4.7% (272) |
| Administrative and support and waste management services | 4.0% (472) | 4.4% (266) | 3.6% (206) |
| Finance and insurance | 3.8% (455) | 1.7% (106) | 6.0% (349) |
| Computer and electronic products | 3.6% (430) | 4.0% (242) | 3.2% (188) |
| Food and beverage stores | 3.4% (401) | 2.5% (153) | 4.3% (248) |
| Public administration | 3.3% (392) | 3.2% (198) | 3.3% (194) |
| Department and other general merchandise stores | 2.7% (326) | 1.6% (97) | 4.0% (229) |
| Motor vehicle and parts dealers | 2.7% (322) | 4.9% (296) | 0.4% (26) |
| Metal and metal products | 2.2% (266) | 3.5% (215) | 0.9% (51) |
| Social assistance | 2.0% (241) | 0.3% (20) | 3.8% (221) |
| Personal and laundry services | 1.9% (227) | 0.9% (56) | 3.0% (171) |
| Repair and maintenance | 1.9% (225) | 3.5% (214) | 0.2% (11) |
| Real estate and rental and leasing | 1.8% (212) | 1.0% (61) | 2.6% (151) |
| Arts, entertainment, and recreation | 1.5% (175) | 1.0% (58) | 2.0% (117) |
| Truck transportation | 1.5% (173) | 2.4% (144) | 0.5% (29) |
| Religious, grantmaking, civic, professional, and similar organizations | 1.4% (167) | 1.3% (81) | 1.5% (86) |
| Transportation equipment | 1.3% (153) | 1.7% (101) | 0.9% (52) |
| Other transportation, and support activities, and couriers | 1.2% (144) | 1.8% (111) | 0.6% (33) |
| Groceries and related products merchant wholesalers | 1.1% (128) | 1.7% (101) | 0.5% (27) |
| Wood products | 1.1% (126) | 1.8% (109) | 0.3% (17) |
| Building material and garden equipment and supplies dealers | 1.0% (123) | 1.4% (86) | 0.6% (37) |
| Other direct selling establishments | 1.0% (123) | 1.0% (58) | 1.1% (65) |
| Miscellaneous manufacturing | 1.0% (122) | 1.6% (98) | 0.4% (24) |
| Utilities | 1.0% (114) | 1.1% (68) | 0.8% (46) |
| Radio, TV, and computer stores | 0.9% (102) | 1.0% (59) | 0.7% (43) |
| Machinery, equipment, and supplies merchant wholesalers | 0.7% (87) | 1.0% (58) | 0.5% (29) |
| Machinery | 0.7% (79) | 1.0% (61) | 0.3% (18) |
| Publishing, and motion picture and sound recording industries | 0.6% (75) | 0.9% (52) | 0.4% (23) |
| Electrical equipment, appliances, and components | 0.6% (72) | 1.0% (61) | 0.2% (11) |
| U. S. Postal service | 0.6% (72) | 0.7% (41) | 0.5% (31) |
| Office supplies and stationery stores | 0.6% (70) | 0.3% (20) | 0.9% (50) |
| Broadcasting and telecommunications | 0.6% (69) | 0.7% (40) | 0.5% (29) |
| Motor vehicles, parts and supplies merchant wholesalers | 0.6% (68) | 0.5% (29) | 0.7% (39) |
| Furniture and home furnishings, and household appliance stores | 0.6% (68) | 0.7% (45) | 0.4% (23) |
| Food | 0.5% (63) | 0.6% (34) | 0.5% (29) |
| Used merchandise, gift, novelty, and souvenir, and other miscellaneous stores | 0.5% (63) | 0.5% (31) | 0.6% (32) |
| Pharmacies and drug stores | 0.5% (62) | 0.2% (12) | 0.9% (50) |
| Printing and related support activities | 0.5% (61) | 0.5% (29) | 0.6% (32) |
| Sporting goods, camera, and hobby and toy stores | 0.5% (57) | 0.5% (28) | 0.5% (29) |
| Nonmetallic mineral products | 0.5% (57) | 0.8% (46) | 0.2% (11) |
| Furniture and related product manufacturing | 0.4% (52) | 0.6% (37) | 0.3% (15) |
| Miscellaneous nondurable goods merchant wholesalers | 0.4% (51) | 0.5% (31) | 0.3% (20) |
| Private households | 0.4% (47) | 0.0% (0) | 0.8% (47) |
| Rail transportation | 0.4% (47) | 0.8% (47) | 0.0% (0) |
| Paper | 0.4% (44) | 0.7% (44) | 0.0% (0) |
| Clothing and accessories, including shoe, stores | 0.4% (43) | 0.4% (23) | 0.3% (20) |
| Professional and commercial equipment and supplies merchant wholesalers | 0.3% (40) | 0.5% (31) | 0.2% (9) |
| Paper and paper products merchant wholesalers | 0.3% (36) | 0.3% (17) | 0.3% (19) |
| Hardware, plumbing and heating equipment, and supplies merchant wholesalers | 0.3% (36) | 0.6% (36) | 0.0% (0) |
| Alcoholic beverages merchant wholesalers | 0.3% (34) | 0.5% (29) | 0.1% (5) |
| Apparel | 0.3% (33) | 0.1% (7) | 0.4% (26) |
| Book stores and news dealers | 0.3% (33) | 0.2% (14) | 0.3% (19) |
| Agriculture, forestry, fishing and hunting | 0.3% (31) | 0.4% (25) | 0.1% (6) |
| Lumber and other construction materials merchant wholesalers | 0.2% (28) | 0.3% (18) | 0.2% (10) |
| Jewelry, luggage, and leather goods stores | 0.2% (27) | 0.3% (20) | 0.1% (7) |
| Air transportation | 0.2% (26) | 0.0% (0) | 0.4% (26) |
| Health and personal care, except drug, stores | 0.2% (26) | 0.0% (0) | 0.4% (26) |
| Electrical and electronic goods merchant wholesalers | 0.2% (26) | 0.2% (13) | 0.2% (13) |
| Miscellaneous durable goods merchant wholesalers | 0.2% (25) | 0.1% (6) | 0.3% (19) |
| Beverage and tobacco products | 0.2% (23) | 0.1% (4) | 0.3% (19) |
| Vending machine operators | 0.2% (22) | 0.3% (16) | 0.1% (6) |
| Gasoline stations | 0.2% (22) | 0.4% (22) | 0.0% (0) |
| Data processing, libraries, and other information services | 0.2% (19) | 0.0% (0) | 0.3% (19) |
| Retail florists | 0.2% (19) | 0.0% (0) | 0.3% (19) |
| Plastics and rubber products | 0.1% (17) | 0.3% (17) | 0.0% (0) |
| Electronic shopping and mail-order houses | 0.1% (14) | 0.0% (0) | 0.2% (14) |
| Petroleum and coal products | 0.1% (13) | 0.2% (13) | 0.0% (0) |
| Metals and minerals, except petroleum, merchant wholesalers | 0.1% (13) | 0.2% (13) | 0.0% (0) |
Unemployment in Opportunity
- Unemployment by race in 2000
- Unemployment rate for White non-Hispanic residents
- 6.1%Males
- 4.9%Females
- Unemployment rate for Black residents
- 6.3%Males
- Unemployment rate for American Indian and Alaska Native residents
- 11.7%Females
- Unemployment rate for Asian residents
- 6.2%Males
- 17.1%Females
- Unemployment rate for other race residents
- 27.7%Males
- 17.6%Females
- Unemployment rate for two or more race residents
- 22.2%Males
- 7.8%Females
- Unemployment rate for Hispanic or Latino residents
- 18.1%Males
- 5.3%Females
Time leaving home to go to work
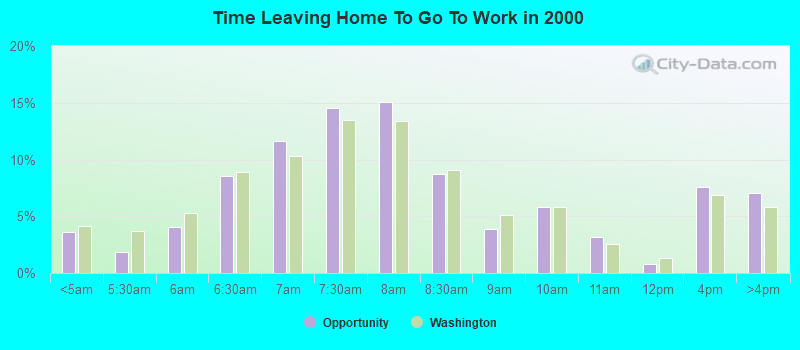
<5am:
| Opportunity: | 3.7% (430) |
| Washington: | 4.2% (115,997) |
5:30am:
| Opportunity: | 1.9% (219) |
| Washington: | 3.7% (102,868) |
6am:
| Opportunity: | 4.1% (481) |
| Washington: | 5.3% (147,812) |
6:30am:
| Opportunity: | 8.6% (1,011) |
| Washington: | 8.9% (248,462) |
7am:
| Opportunity: | 11.6% (1,366) |
| Washington: | 10.3% (288,005) |
7:30am:
| Opportunity: | 14.5% (1,710) |
| Washington: | 13.5% (375,030) |
8am:
| Opportunity: | 15.1% (1,777) |
| Washington: | 13.4% (372,576) |
8:30am:
| Opportunity: | 8.7% (1,027) |
| Washington: | 9.0% (252,058) |
9am:
| Opportunity: | 3.9% (456) |
| Washington: | 5.1% (141,936) |
10am:
| Opportunity: | 5.8% (685) |
| Washington: | 5.8% (161,204) |
11am:
| Opportunity: | 3.2% (373) |
| Washington: | 2.5% (70,123) |
12pm:
| Opportunity: | 0.8% (98) |
| Washington: | 1.3% (35,612) |
4pm:
| Opportunity: | 7.6% (893) |
| Washington: | 6.8% (190,565) |
>4pm:
| Opportunity: | 7.0% (826) |
| Washington: | 5.8% (162,401) |
Travel time to work
Daytime population change due to commuting: -4,498 (-17.9%)
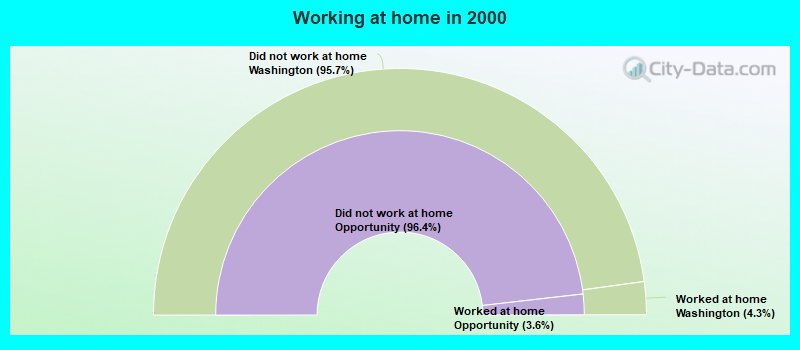
Workers who live and work in this place: 1,782 (15.1%)
Workers who live and work in this place: 1,782 (15.1%)
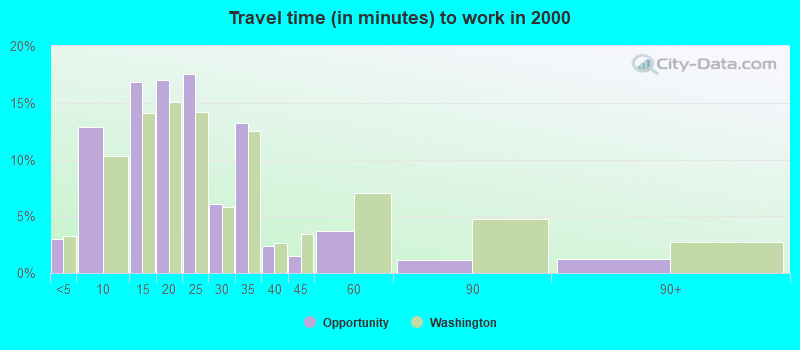
Less than 5 minutes:
| Opportunity: | 3.0% (355) |
| Washington: | 3.3% (91,132) |
5 to 9 minutes:
| Opportunity: | 12.8% (1,513) |
| Washington: | 10.3% (286,517) |
10 to 14 minutes:
| Opportunity: | 16.8% (1,983) |
| Washington: | 14.1% (391,606) |
15 to 19 minutes:
| Opportunity: | 17.0% (1,998) |
| Washington: | 15.0% (418,990) |
20 to 24 minutes:
| Opportunity: | 17.5% (2,061) |
| Washington: | 14.2% (394,209) |
25 to 29 minutes:
| Opportunity: | 6.0% (712) |
| Washington: | 5.8% (162,590) |
30 to 34 minutes:
| Opportunity: | 13.2% (1,559) |
| Washington: | 12.5% (348,311) |
35 to 39 minutes:
| Opportunity: | 2.4% (283) |
| Washington: | 2.6% (73,592) |
40 to 44 minutes:
| Opportunity: | 1.5% (179) |
| Washington: | 3.4% (95,182) |
45 to 59 minutes:
| Opportunity: | 3.7% (432) |
| Washington: | 7.0% (195,343) |
60 to 89 minutes:
| Opportunity: | 1.1% (130) |
| Washington: | 4.7% (131,691) |
90 or more minutes:
| Opportunity: | 1.2% (147) |
| Washington: | 2.7% (75,486) |
Means of transportation to work
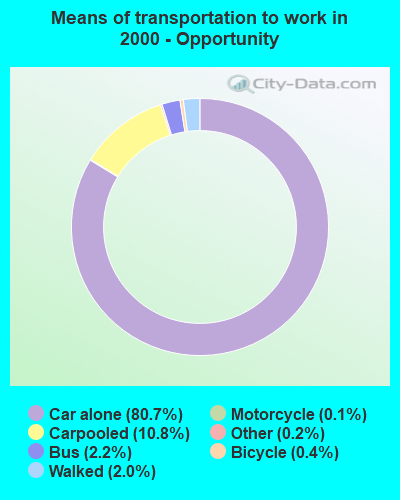

Drove car alone:
| Opportunity: | 80.7% (9,501) |
| Washington: | 73.3% (2,040,833) |
Carpooled:
| Opportunity: | 10.8% (1,274) |
| Washington: | 12.8% (357,742) |
Bus or trolley bus:
| Opportunity: | 2.2% (254) |
| Washington: | 4.5% (124,450) |
Motorcycle:
| Opportunity: | 0.1% (12) |
| Washington: | 0.2% (4,353) |
Bicycle:
| Opportunity: | 0.4% (49) |
| Washington: | 0.6% (16,205) |
Walked:
| Opportunity: | 2.0% (238) |
| Washington: | 3.2% (89,739) |
Other means:
| Opportunity: | 0.2% (24) |
| Washington: | 0.7% (19,499) |
Private vehicle occupancy
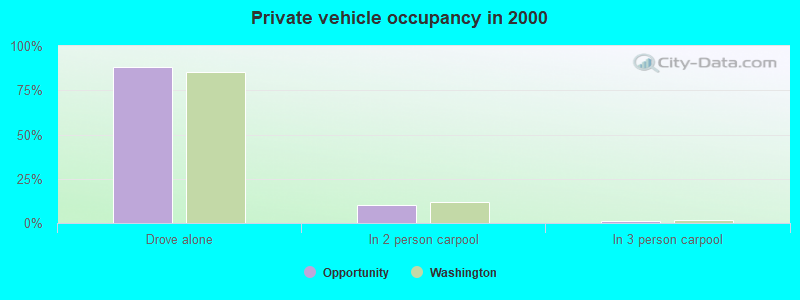
Drove alone:
| Opportunity: | 88.2% (9,501) |
| Washington: | 85.1% (2,040,833) |
In 2 person carpool:
| Opportunity: | 10.3% (1,107) |
| Washington: | 11.8% (282,638) |
In 3 person carpool:
| Opportunity: | 1.2% (128) |
| Washington: | 1.9% (44,791) |
In 4 person carpool:
| Opportunity: | 0.0% (5) |
| Washington: | 0.6% (14,195) |
In 5-6 person carpool:
| Opportunity: | 0.3% (28) |
| Washington: | 0.3% (7,914) |
In 7+ person carpool:
| Opportunity: | 0.1% (6) |
| Washington: | 0.3% (8,204) |
Class of workers
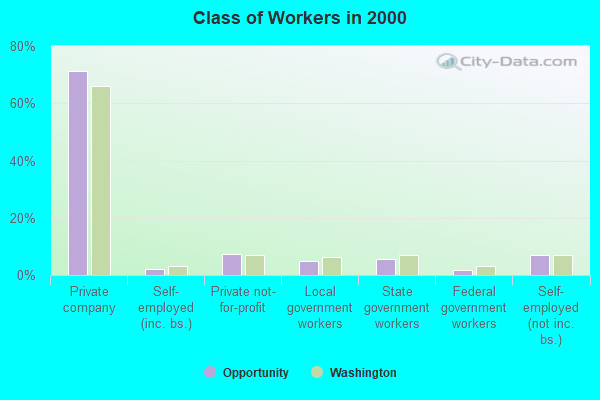
Employee of private company:
| Opportunity: | 71.2% (8,471) |
| Washington: | 66.0% (1,843,000) |
Self-employed in own incorporated business:
| Opportunity: | 2.0% (242) |
| Washington: | 3.2% (90,102) |
Private not-for-profit wage and salary workers:
| Opportunity: | 7.2% (854) |
| Washington: | 6.9% (191,927) |
Local government workers:
| Opportunity: | 4.8% (575) |
| Washington: | 6.4% (178,161) |
State government workers:
| Opportunity: | 5.6% (663) |
| Washington: | 6.9% (192,408) |
Federal government workers:
| Opportunity: | 1.8% (214) |
| Washington: | 3.2% (89,153) |
Self-employed workers in own not incorporated business:
| Opportunity: | 7.1% (843) |
| Washington: | 7.2% (199,827) |
Unpaid family workers:
| Opportunity: | 0.3% (35) |
| Washington: | 0.3% (9,144) |
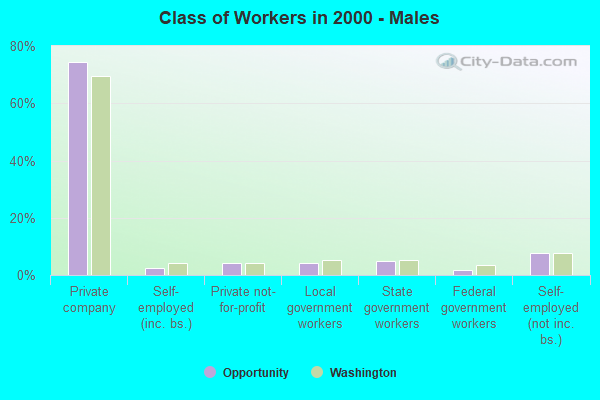
Employee of private company - Males:
| Opportunity: | 74.5% (4,548) |
| Washington: | 69.7% (1,044,674) |
Self-employed in own incorporated business - Males:
| Opportunity: | 2.3% (141) |
| Washington: | 4.3% (64,169) |
Private not-for-profit wage and salary workers - Males:
| Opportunity: | 4.2% (256) |
| Washington: | 4.2% (63,257) |
Local government workers - Males:
| Opportunity: | 4.1% (252) |
| Washington: | 5.3% (79,844) |
State government workers - Males:
| Opportunity: | 5.0% (307) |
| Washington: | 5.1% (76,834) |
Federal government workers - Males:
| Opportunity: | 1.7% (106) |
| Washington: | 3.5% (52,763) |
Self-employed workers in own not incorporated business - Males:
| Opportunity: | 7.7% (467) |
| Washington: | 7.6% (114,199) |
Unpaid family workers - Males:
| Opportunity: | 0.4% (25) |
| Washington: | 0.3% (3,889) |
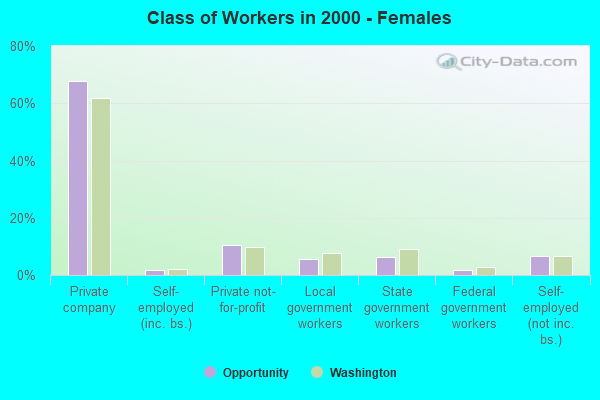
Employee of private company - Females:
| Opportunity: | 67.7% (3,923) |
| Washington: | 61.7% (798,326) |
Self-employed in own incorporated business - Females:
| Opportunity: | 1.7% (101) |
| Washington: | 2.0% (25,933) |
Private not-for-profit wage and salary workers - Females:
| Opportunity: | 10.3% (598) |
| Washington: | 9.9% (128,670) |
Local government workers - Females:
| Opportunity: | 5.6% (323) |
| Washington: | 7.6% (98,317) |
State government workers - Females:
| Opportunity: | 6.1% (356) |
| Washington: | 8.9% (115,574) |
Federal government workers - Females:
| Opportunity: | 1.9% (108) |
| Washington: | 2.8% (36,390) |
Self-employed workers in own not incorporated business - Females:
| Opportunity: | 6.5% (376) |
| Washington: | 6.6% (85,628) |
Unpaid family workers - Females:
| Opportunity: | 0.2% (10) |
| Washington: | 0.4% (5,255) |