Work and Jobs in Paso Robles, California (CA) Detailed Stats
Occupations, Industries, Unemployment, Workers, Commute
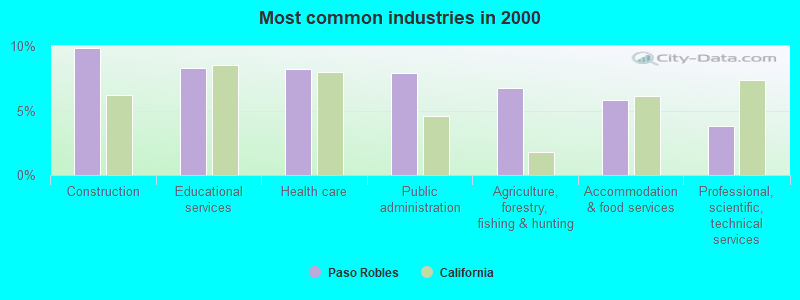
The most common industries in Paso Robles are: Construction (9.9% of civilian employees), Educational services (8.3% of civilian employees), Health care (8.2% of civilian employees). 61.7% of workers are employees of private companies, which is 10.3% less than the rate of 68.0% across the entire state of California.
Most common industries
Most common industries | |||
|---|---|---|---|
Industry | All | Males | Females |
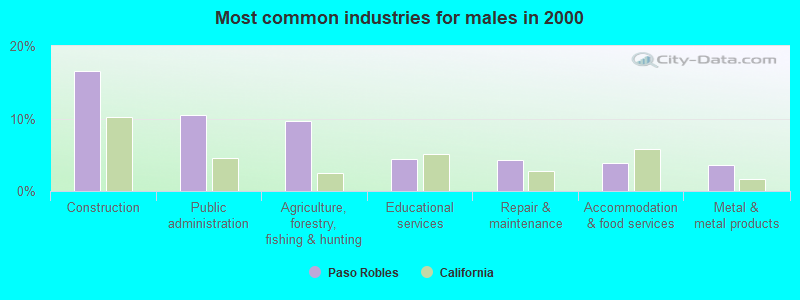
| Construction | 9.9% (1,726) | 16.5% (1,597) | 1.6% (129) |
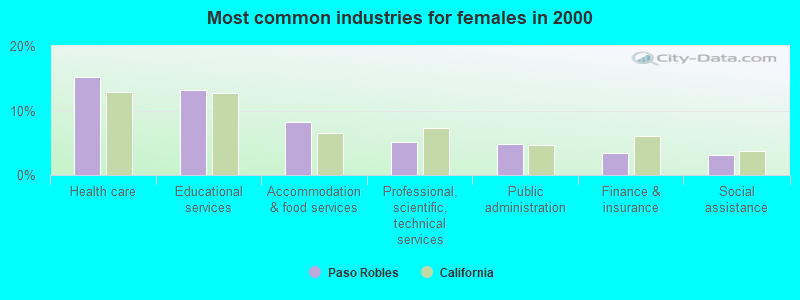
| Educational services | 8.3% (1,455) | 4.4% (426) | 13.1% (1,029) |
| Health care | 8.2% (1,442) | 2.6% (255) | 15.1% (1,187) |
| Public administration | 7.9% (1,391) | 10.5% (1,017) | 4.8% (374) |
| Agriculture, forestry, fishing and hunting | 6.7% (1,176) | 9.7% (939) | 3.0% (237) |
| Accommodation and food services | 5.8% (1,017) | 3.9% (375) | 8.2% (642) |
| Professional, scientific, and technical services | 3.8% (660) | 2.6% (255) | 5.2% (405) |
| Administrative and support and waste management services | 3.1% (551) | 3.2% (309) | 3.1% (242) |
| Metal and metal products | 2.6% (458) | 3.6% (353) | 1.3% (105) |
| Repair and maintenance | 2.5% (442) | 4.2% (408) | 0.4% (34) |
| Finance and insurance | 2.1% (369) | 1.1% (107) | 3.3% (262) |
| Food and beverage stores | 2.1% (369) | 1.9% (186) | 2.3% (183) |
| Miscellaneous manufacturing | 1.9% (341) | 1.8% (175) | 2.1% (166) |
| Real estate and rental and leasing | 1.9% (331) | 1.2% (112) | 2.8% (219) |
| Motor vehicle and parts dealers | 1.8% (324) | 2.5% (244) | 1.0% (80) |
| Arts, entertainment, and recreation | 1.8% (320) | 1.3% (125) | 2.5% (195) |
| Social assistance | 1.8% (315) | 0.7% (71) | 3.1% (244) |
| Department and other general merchandise stores | 1.7% (298) | 0.6% (62) | 3.0% (236) |
| Personal and laundry services | 1.6% (278) | 0.5% (53) | 2.9% (225) |
| Utilities | 1.4% (246) | 2.0% (198) | 0.6% (48) |
| Religious, grantmaking, civic, professional, and similar organizations | 1.2% (218) | 1.3% (125) | 1.2% (93) |
| Beverage and tobacco products | 1.2% (216) | 1.5% (144) | 0.9% (72) |
| Other transportation, and support activities, and couriers | 1.2% (216) | 1.9% (181) | 0.4% (35) |
| Printing and related support activities | 1.1% (198) | 1.2% (112) | 1.1% (86) |
| Building material and garden equipment and supplies dealers | 1.1% (195) | 1.1% (105) | 1.1% (90) |
| Mining, quarrying, and oil and gas extraction | 1.0% (179) | 1.7% (162) | 0.2% (17) |
| Used merchandise, gift, novelty, and souvenir, and other miscellaneous stores | 1.0% (177) | 0.5% (52) | 1.6% (125) |
| Broadcasting and telecommunications | 0.9% (161) | 0.9% (91) | 0.9% (70) |
| Publishing, and motion picture and sound recording industries | 0.9% (160) | 0.6% (58) | 1.3% (102) |
| Pharmacies and drug stores | 0.7% (125) | 0.2% (23) | 1.3% (102) |
| Truck transportation | 0.7% (123) | 1.2% (117) | 0.1% (6) |
| Computer and electronic products | 0.7% (119) | 0.6% (60) | 0.8% (59) |
| Transportation equipment | 0.7% (119) | 0.9% (85) | 0.4% (34) |
| Chemicals | 0.7% (114) | 0.9% (84) | 0.4% (30) |
| Gasoline stations | 0.7% (114) | 0.7% (66) | 0.6% (48) |
| Wood products | 0.5% (85) | 0.7% (72) | 0.2% (13) |
| Electrical equipment, appliances, and components | 0.5% (82) | 0.8% (74) | 0.1% (8) |
| Furniture and home furnishings, and household appliance stores | 0.4% (77) | 0.5% (45) | 0.4% (32) |
| U. S. Postal service | 0.4% (72) | 0.4% (39) | 0.4% (33) |
| Private households | 0.4% (70) | 0.2% (20) | 0.6% (50) |
| Furniture and related product manufacturing | 0.4% (69) | 0.6% (60) | 0.1% (9) |
| Nonmetallic mineral products | 0.4% (68) | 0.6% (61) | 0.1% (7) |
| Machinery | 0.4% (67) | 0.3% (33) | 0.4% (34) |
| Other direct selling establishments | 0.4% (63) | 0.2% (21) | 0.5% (42) |
| Sporting goods, camera, and hobby and toy stores | 0.3% (60) | 0.4% (37) | 0.3% (23) |
| Petroleum and coal products | 0.3% (60) | 0.5% (51) | 0.1% (9) |
| Miscellaneous durable goods merchant wholesalers | 0.3% (56) | 0.1% (6) | 0.6% (50) |
| Air transportation | 0.3% (53) | 0.3% (33) | 0.3% (20) |
| Miscellaneous nondurable goods merchant wholesalers | 0.3% (52) | 0.4% (35) | 0.2% (17) |
| Machinery, equipment, and supplies merchant wholesalers | 0.3% (52) | 0.3% (32) | 0.3% (20) |
| Plastics and rubber products | 0.3% (50) | 0.3% (25) | 0.3% (25) |
| Groceries and related products merchant wholesalers | 0.3% (50) | 0.5% (50) | 0.0% (0) |
| Data processing, libraries, and other information services | 0.2% (41) | 0.1% (8) | 0.4% (33) |
| Motor vehicles, parts and supplies merchant wholesalers | 0.2% (41) | 0.4% (41) | 0.0% (0) |
| Health and personal care, except drug, stores | 0.2% (38) | 0.2% (23) | 0.2% (15) |
| Radio, TV, and computer stores | 0.2% (35) | 0.3% (25) | 0.1% (10) |
| Clothing and accessories, including shoe, stores | 0.2% (32) | 0.0% (1) | 0.4% (31) |
| Electrical and electronic goods merchant wholesalers | 0.1% (26) | 0.3% (26) | 0.0% (0) |
| Paper | 0.1% (25) | 0.3% (25) | 0.0% (0) |
| Petroleum and petroleum products merchant wholesalers | 0.1% (25) | 0.2% (16) | 0.1% (9) |
| Retail florists | 0.1% (22) | 0.0% (0) | 0.3% (22) |
| Office supplies and stationery stores | 0.1% (22) | 0.0% (0) | 0.3% (22) |
| Food | 0.1% (21) | 0.2% (19) | 0.0% (2) |
| Furniture and home furnishing merchant wholesalers | 0.1% (21) | 0.0% (0) | 0.3% (21) |
| Music stores | 0.1% (21) | 0.1% (9) | 0.2% (12) |
| Apparel | 0.1% (21) | 0.1% (8) | 0.2% (13) |
| Jewelry, luggage, and leather goods stores | 0.1% (11) | 0.1% (11) | 0.0% (0) |
| Rail transportation | 0.1% (11) | 0.1% (11) | 0.0% (0) |
Unemployment in Paso Robles
- Unemployment by race in 2000
- Unemployment rate for White non-Hispanic residents
- 5.7%Males
- 5.1%Females
- Unemployment rate for American Indian and Alaska Native residents
- 4.1%Males
- 22.2%Females
- Unemployment rate for Asian residents
- 9.9%Males
- 14.0%Females
- Unemployment rate for other race residents
- 10.6%Males
- 5.2%Females
- Unemployment rate for two or more race residents
- 0.7%Males
- 8.7%Females
- Unemployment rate for Hispanic or Latino residents
- 7.3%Males
- 6.1%Females
Time leaving home to go to work
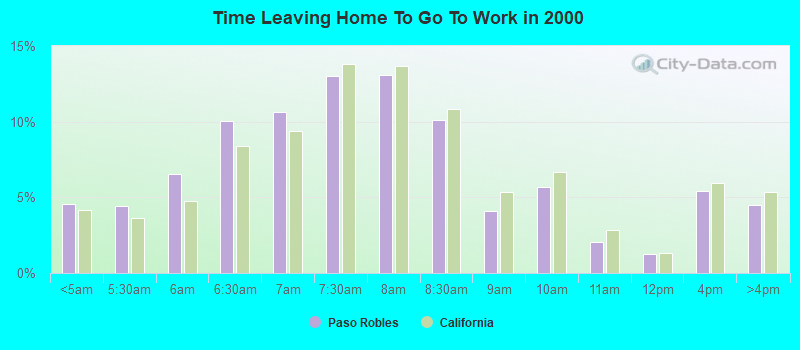
<5am:
| Paso Robles: | 4.5% (786) |
| California: | 4.2% (606,086) |
5:30am:
| Paso Robles: | 4.4% (760) |
| California: | 3.6% (523,209) |
6am:
| Paso Robles: | 6.6% (1,133) |
| California: | 4.8% (692,256) |
6:30am:
| Paso Robles: | 10.0% (1,731) |
| California: | 8.4% (1,216,867) |
7am:
| Paso Robles: | 10.6% (1,840) |
| California: | 9.4% (1,362,830) |
7:30am:
| Paso Robles: | 13.0% (2,247) |
| California: | 13.8% (2,006,950) |
8am:
| Paso Robles: | 13.1% (2,262) |
| California: | 13.7% (1,986,831) |
8:30am:
| Paso Robles: | 10.1% (1,745) |
| California: | 10.9% (1,577,815) |
9am:
| Paso Robles: | 4.1% (710) |
| California: | 5.4% (778,152) |
10am:
| Paso Robles: | 5.7% (984) |
| California: | 6.7% (972,355) |
11am:
| Paso Robles: | 2.0% (353) |
| California: | 2.9% (414,479) |
12pm:
| Paso Robles: | 1.3% (222) |
| California: | 1.3% (189,005) |
4pm:
| Paso Robles: | 5.4% (931) |
| California: | 6.0% (865,284) |
>4pm:
| Paso Robles: | 4.5% (773) |
| California: | 5.3% (776,167) |
Travel time to work
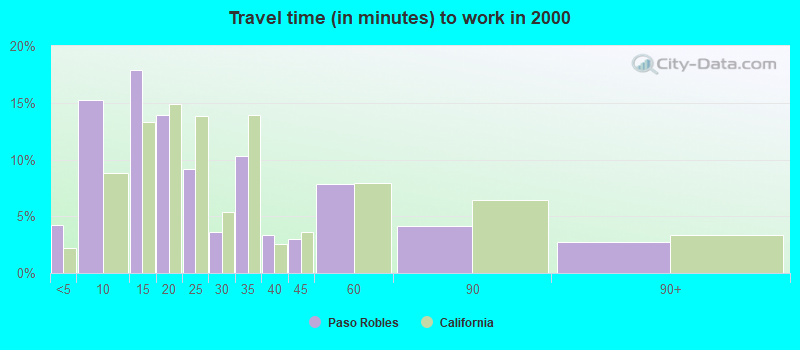
Less than 5 minutes:
| Paso Robles: | 4.2% (733) |
| California: | 2.2% (324,703) |
5 to 9 minutes:
| Paso Robles: | 15.3% (2,638) |
| California: | 8.8% (1,280,443) |
10 to 14 minutes:
| Paso Robles: | 17.9% (3,086) |
| California: | 13.3% (1,930,263) |
15 to 19 minutes:
| Paso Robles: | 13.9% (2,408) |
| California: | 14.9% (2,157,970) |
20 to 24 minutes:
| Paso Robles: | 9.1% (1,576) |
| California: | 13.8% (2,004,060) |
25 to 29 minutes:
| Paso Robles: | 3.6% (623) |
| California: | 5.4% (782,241) |
30 to 34 minutes:
| Paso Robles: | 10.3% (1,783) |
| California: | 13.9% (2,025,657) |
35 to 39 minutes:
| Paso Robles: | 3.3% (574) |
| California: | 2.5% (366,487) |
40 to 44 minutes:
| Paso Robles: | 3.0% (520) |
| California: | 3.6% (528,043) |
45 to 59 minutes:
| Paso Robles: | 7.8% (1,349) |
| California: | 7.9% (1,151,598) |
60 to 89 minutes:
| Paso Robles: | 4.1% (710) |
| California: | 6.4% (933,123) |
90 or more minutes:
| Paso Robles: | 2.8% (477) |
| California: | 3.3% (483,698) |
Means of transportation to work
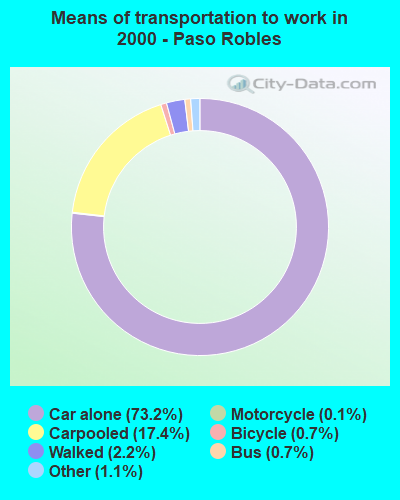

Drove car alone:
| Paso Robles: | 73.2% (12,650) |
| California: | 71.8% (10,432,462) |
Carpooled:
| Paso Robles: | 17.4% (3,011) |
| California: | 14.5% (2,113,313) |
Bus or trolley bus:
| Paso Robles: | 0.7% (116) |
| California: | 3.8% (549,425) |
Motorcycle:
| Paso Robles: | 0.1% (21) |
| California: | 0.2% (36,262) |
Bicycle:
| Paso Robles: | 0.7% (114) |
| California: | 0.8% (120,567) |
Walked:
| Paso Robles: | 2.2% (377) |
| California: | 2.9% (414,581) |
Other means:
| Paso Robles: | 1.1% (188) |
| California: | 0.8% (115,064) |
Private vehicle occupancy
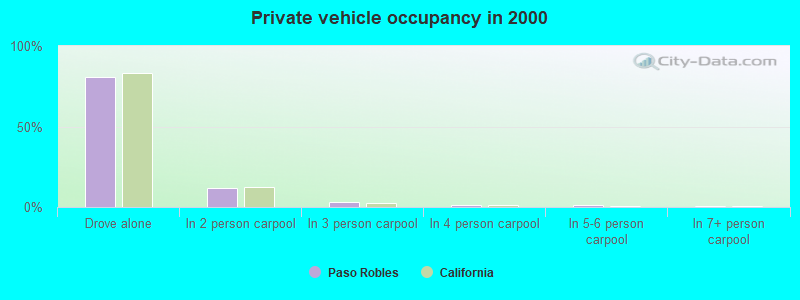
Drove alone:
| Paso Robles: | 80.8% (12,650) |
| California: | 83.2% (10,432,462) |
In 2 person carpool:
| Paso Robles: | 12.0% (1,884) |
| California: | 12.5% (1,564,905) |
In 3 person carpool:
| Paso Robles: | 3.4% (533) |
| California: | 2.6% (330,732) |
In 4 person carpool:
| Paso Robles: | 1.4% (225) |
| California: | 1.0% (119,364) |
In 5-6 person carpool:
| Paso Robles: | 1.4% (224) |
| California: | 0.5% (57,036) |
In 7+ person carpool:
| Paso Robles: | 0.9% (145) |
| California: | 0.3% (41,276) |
Class of workers
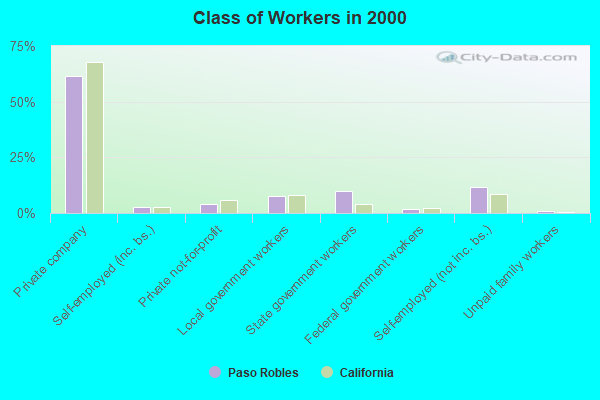
Employee of private company:
| Paso Robles: | 61.7% (10,803) |
| California: | 68.0% (10,009,465) |
Self-employed in own incorporated business:
| Paso Robles: | 2.7% (469) |
| California: | 2.7% (402,392) |
Private not-for-profit wage and salary workers:
| Paso Robles: | 3.9% (686) |
| California: | 5.7% (845,536) |
Local government workers:
| Paso Robles: | 7.8% (1,365) |
| California: | 8.3% (1,218,764) |
State government workers:
| Paso Robles: | 9.9% (1,738) |
| California: | 4.0% (594,953) |
Federal government workers:
| Paso Robles: | 1.7% (292) |
| California: | 2.3% (344,354) |
Self-employed workers in own not incorporated business:
| Paso Robles: | 11.6% (2,030) |
| California: | 8.5% (1,249,530) |
Unpaid family workers:
| Paso Robles: | 0.8% (136) |
| California: | 0.4% (53,934) |
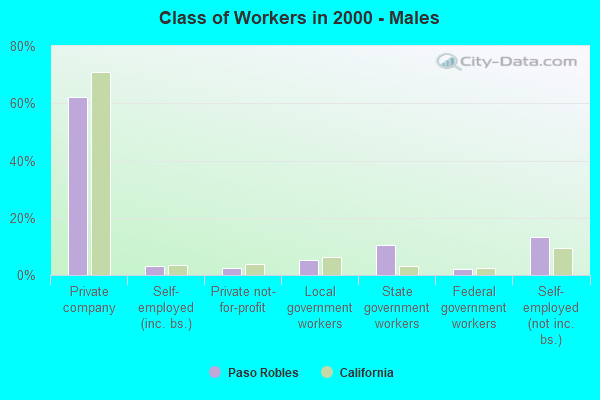
Employee of private company - Males:
| Paso Robles: | 62.2% (6,016) |
| California: | 71.1% (5,716,697) |
Self-employed in own incorporated business - Males:
| Paso Robles: | 3.1% (303) |
| California: | 3.6% (290,657) |
Private not-for-profit wage and salary workers - Males:
| Paso Robles: | 2.6% (248) |
| California: | 3.8% (303,997) |
Local government workers - Males:
| Paso Robles: | 5.4% (523) |
| California: | 6.2% (495,927) |
State government workers - Males:
| Paso Robles: | 10.6% (1,025) |
| California: | 3.2% (255,434) |
Federal government workers - Males:
| Paso Robles: | 2.2% (211) |
| California: | 2.5% (198,555) |
Self-employed workers in own not incorporated business - Males:
| Paso Robles: | 13.3% (1,291) |
| California: | 9.5% (760,853) |
Unpaid family workers - Males:
| Paso Robles: | 0.6% (57) |
| California: | 0.3% (23,230) |
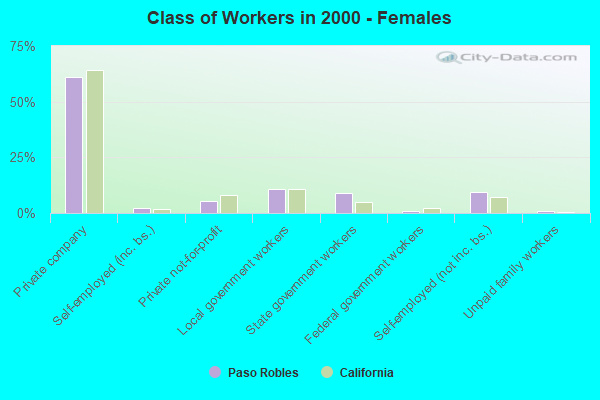
Employee of private company - Females:
| Paso Robles: | 61.0% (4,787) |
| California: | 64.3% (4,292,768) |
Self-employed in own incorporated business - Females:
| Paso Robles: | 2.1% (166) |
| California: | 1.7% (111,735) |
Private not-for-profit wage and salary workers - Females:
| Paso Robles: | 5.6% (438) |
| California: | 8.1% (541,539) |
Local government workers - Females:
| Paso Robles: | 10.7% (842) |
| California: | 10.8% (722,837) |
State government workers - Females:
| Paso Robles: | 9.1% (713) |
| California: | 5.1% (339,519) |
Federal government workers - Females:
| Paso Robles: | 1.0% (81) |
| California: | 2.2% (145,799) |
Self-employed workers in own not incorporated business - Females:
| Paso Robles: | 9.4% (739) |
| California: | 7.3% (488,677) |
Unpaid family workers - Females:
| Paso Robles: | 1.0% (79) |
| California: | 0.5% (30,704) |